2900 Pomeroy Rd SE #104 · Washington, DC
Flood risk 1/10 · Minimal
- FEMA flood zone
- X (unshaded)
- Chance of flooding over 30 yrs
- 0.0%
- Est. flood insurance / yr
- $473 – $860
Fire risk 1/10 · Minimal
- Est. fire insurance / yr
- $631 – $1,173
Heat risk 7/10 · Major
- Hot days now (above 104°F)
- 7 days/yr
- Hot days in 30 yrs
- 14 days/yr
Wind risk 4/10 · Minor
- Chance of severe wind over 30 yrs
- 23.0%
Air-quality risk 4/10 · Minor
- Unhealthy air days now
- 4 days/yr
- Unhealthy air days in 30 yrs
- 5 days/yr
Risk factors via First Street. Map © Google.
Why this score? — see what drove the C- grade
The composite is a weighted blend of 9 inputs, each scored 0–100. Each bar is that input's sub-score; the figure is the points it added to the 100-point composite (weight × sub-score).
- Cash flow +18.8/30.0
- 1% rule +7.6/10.0
- ARV discount +7.5/15.0
- DSCR +5.9/10.0
- Condition / age +4.0/5.0
- Livability +3.7/5.0
- Schools +3.6/10.0
- Rent growth +3.5/5.0
- Appreciation +0.0/10.0
$149,900
🖨 Deal sheet (PDF) 📄 Offer letter ✓ Due diligence
Listing remarks
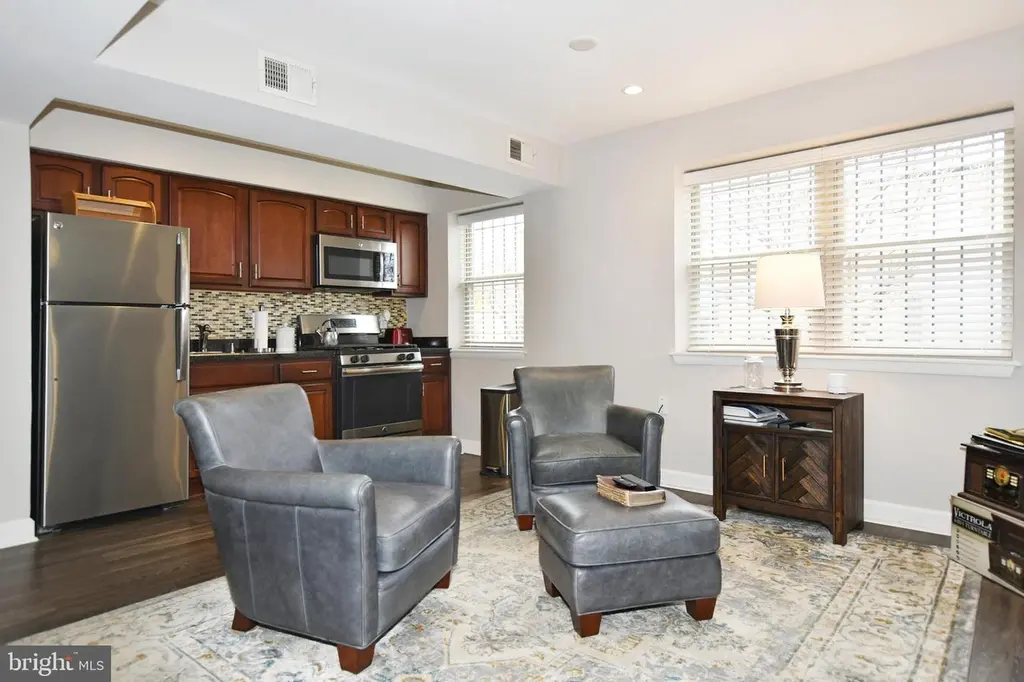
Welcome to 2900 Pomeroy Rd SE #104, a well-maintained 1-bedroom, 1-bathroom co-op offering comfortable and convenient living in Washington, DC. This inviting unit features a functional layout designed to maximize space, with a bright living area that flows seamlessly into the dining space, creating an ideal setup for both everyday living and entertaining. The kitchen offers practical workspace and storage, while the spacious bedroom provides a quiet retreat with ample closet space. Large windows bring in natural light, giving the home a warm and welcoming feel throughout. The bathroom is thoughtfully laid out, completing a home that is both efficient and easy to maintain. Located in a well-
Key facts
- Large windows
- Practical workspace
- Bright living area
Tags
Property features AI
Finance
- HOA & community: Monthly coop fee of $300 includes water and sewer; Ownership is cooperative; Pets allowed with no restrictions
Exterior
- Parking: Parking lot
- Utilities: Public water; Public sewer
- Home design: Garden-style building (1–4 floors); Unit/flat; Entry on level 1
- Construction: Brick construction; Major renovation in 2016; Year built (estimated)
- Exterior features: Above-grade unit; No tidal water
Interior
- Bedrooms: One bedroom on main level
- Bathrooms: One full bathroom on main level
- Heating & cooling: Other heating; Other cooling; Other hot water
- Interior features: Estimated living area; No basement
- Laundry & utility: Washer/dryer hookup in unit
Neighborhood map
What this means for you Summary
Snapshot
- This is a 1-bed/1.0-bath condo listed at $150k. Condition is rated good.
Deal economics
- At list price, monthly cash flow is $151 ($2k/yr) — positive.
- The deal already cash-flows at list — no discount required.
- Meets the 1% rule at list price ($2k rent vs $150k).
- Recommended offer: $136k (9.0% below list) — sets the bar for market timing.
- Cap rate 7.5% vs local median 2.5% in Washington — top-decile yield for the area; either an underpriced asset or a hidden risk that comps aren't pricing in. Stress-test before assuming the spread holds.
Location & tenants
- Location reads 73/100 on livability (#1 in DC) — a middle-class / working-renter tenant base. Strengths: amenities A+, commute A+, employment A+; Watch: crime F, cost of living F.
- District Of Columbia Public Schools (urban): math 33% / reading 40% proficiency, ranked #8 of 32 in DC (top 25%) — families likely to look elsewhere, expect single-tenant / working-renter base with shorter leases; 65% free/reduced lunch — lower-income household profile, screen leases tightly.
- Zoned schools: Capitol Hill Montessori School At Logan (424 students, 0% FRL); Kramer Ms (203 students, 0% FRL); Anacostia Hs (287 students, 0% FRL) — zoned schools average 0% FRL vs 65% district-wide (65 pts lower); this property's tenant base skews higher-income than the district average.
- Market conditions: Rents rising (+3.9%/yr); 298 active listings in the ZIP; 40 comparable units currently listed for rent nearby; rentals at typical pace (median 22d on market — plan ~3-4 weeks tenant-placement turnaround); 1,737 units permitted in District of Columbia in 2024 (1,506 in 5+ unit buildings).
- This rent runs 42% of the median local income ($54k/yr) — at the standard rent-burdened threshold; future hikes will face affordability resistance.
Forward outlook
- Local home prices are declining (-3.0%/yr); year-one equity from $1k of loan paydown is wiped out by about $4k of value loss. Plan a longer hold.
- District of Columbia County population projected at +50% by 2050 — long-run rental-demand tailwind backs the buy-and-hold thesis.
Negotiation context
- It's been on market 96 days — a 9% lower offer ($136k) is reasonable based on typical stale-listing flexibility.
Risks & watch-outs
- Watch-outs: built in 1952 — expect roof / HVAC / electrical / plumbing capex.
- Climate carrying-cost: extreme-heat days projected 7→14/yr by 2055 (HVAC capex compounding) — expect insurance premiums to compound above CPI over the hold.
Questions for the listing agent
- It's been on market 96 days. Have you received any prior offers? Is the seller open to a 9% concession, seller financing, or rate buy-down credit?
- Built in 1952 — when were the roof, HVAC, electrical panel, plumbing, and water heater last replaced?
- What does the HOA fee cover, when was the last increase, and are there any pending special assessments or reserve-fund shortfalls?
- Any open or pending special assessments — roof, HVAC, plumbing, elevator, façade? What's the per-unit balance and payoff schedule, and is the seller paying it off at close or rolling it to the buyer?
- Why hasn't it sold? Are there any deal-killer items the seller is aware of (foundation, flood, title, zoning, code violations)?
- Is there a deadline driving the sale (1031 exchange, divorce, estate, relocation)? That informs how much negotiation room exists.
- Crime grade is F in this area — have there been break-ins, vandalism, or insurance claims at this property in the last 3 years? What carrier currently insures it and at what premium?
- What's the average days-on-market for RENTAL listings here right now (not sales)? A rising rental-DOM trend means longer vacancies and softer asking-rent achievability than the comps imply.
- What's the recent tenant-quality profile in this submarket — average credit score on applications, eviction rate, late-payment / NSF rate, and stable-employment percentage? A property-management company in the area should have these aggregated.
- How much new apartment / multifamily construction is in the pipeline within 1–3 miles? Heavy new supply (>2% of stock underway) typically softens rents 12–24 months out; light construction supports rent growth.
Investment metrics
- 1% rule
- 1.26% ✓
- Cap rate
- 7.50%
- Cash-on-cash
- 4.32%
- DSCR
- 1.19
- GRM
- 6.6
CMA / ARV
No comps found within radius.
Projected returns pro-forma
-3.0% appreciation · 3.86% rent growth · sell at horizon
- IRR
- -8.2%
- Equity multiple
- 0.69×
- Total profit
- $-12,813
- Equity at exit
- $22,351
- IRR
- 2.8%
- Equity multiple
- 1.21×
- Total profit
- $8,957
- Equity at exit
- $12,961
Cash invested: $41,972 (down + closing). Projections, not guarantees.
Landlord ↔ Tenant lean methodology
- Overall (CITY)
- 0 Strongly Tenant-Friendly
- State District of Columbia
- 12 Strongly Tenant-Friendly · D+43
- County
- — inherits STATE
- City Washington
- 0 Strongly Tenant-Friendly · D+43
ZIP-level market 20020
- Rents YoY
- 3.9%
- Active inventory
- 298
- Price-to-rent
- 6.6×
Monthly cashflow live
- Estimated rent
- $1,882 high interval (Pro) →
- Mortgage (P&I)
- −$786
- Tax est. 1.5%
- −$187 /mo · $2,248/yr
- Insurance
- −$62
- HOA
- −$300
- Vacancy / Maint / Mgmt
- −$395
- Net cashflow
- $151
Break-even live
Sensitivity live
| Price | -10% $255 | -5% $203 | +0% $151 | +5% $99 | +10% $47 |
|---|---|---|---|---|---|
| Rent | -10% $2 | -5% $77 | +0% $151 | +5% $225 | +10% $300 |
| Rate | -1.0pp $227 | -0.5pp $189 | base $151 | +0.5pp $112 | +1.0pp $73 |
UW: 25.0% down · 7.5% · 30yr · 1.5% tax · 5.0% vac · 8.0% maint · 8.0% mgmt
Financing live
Cash to close
- Down payment
- $37,475
- Closing costs
- $4,497
- Reserves months
- —
- Total cash needed
- —
Loan-product check · same deal, 3 products live
Conventional
25% down · 7.5% · 30yr
- Down + closing
- —
- Monthly P&I
- —
- Monthly cashflow
- —
- DSCR
- —
- Eligible?
- —
Personal DTI + credit; lowest rate.
DSCR
20% down · 8.5% · 30yr
- Down + closing
- —
- Monthly P&I
- —
- Monthly cashflow
- —
- DSCR
- —
- Eligible?
- —
No personal income docs; deal must DSCR.
Hard money
10% down · 12.0% · 12mo
- Down + closing
- —
- Monthly P&I
- —
- Monthly cashflow
- —
- DSCR
- —
- Eligible?
- —
Short-term bridge; refi at stabilization.
Rent comps 40 comps
| Address | Beds | Baths | Sqft | Rent | $/sqft | DOM | Units | Dist |
|---|---|---|---|---|---|---|---|---|
| 1300 Morris Rd SE Washington, DC | 2.0 | 1.0 | 650 | $1,650 | $2.54 | 0d | 1 | 0.49mi |
| 1300 Morris Rd SE Washington, DC | 2.0 | 1.0 | 650 | $1,499 | $2.31 | 26d | 1 | 0.49mi |
| 2228 Martin Luther King Jr Ave SE Washington, DC | 1.0 | 1.0 | 656 | $1,795 | $2.73 | 0d | 3 | 0.52mi |
| 650 Howard Rd SE Washington, DC | 3.0 | 1.0–2.0 | 852 | $2,687 | $3.15 | 0d | 54 | 0.59mi |
| 632 Howard Rd SE Unit 531 Washington, DC | 1.0 | 1.0 | 632 | $2,761 | $4.37 | 21d | 1 | 0.62mi |
| 632 Howard Rd SE Washington, DC | 2.0 | 1.0–2.0 | 673 | $3,216 | $4.78 | 22d | 112 | 0.62mi |
| 632 Howard Rd SE Unit 434 Washington, DC | 1.0 | 1.0 | 623 | $2,761 | $4.43 | 18d | 1 | 0.62mi |
| 1425-1429 Cedar St SE Washington, DC | 1.0–2.0 | 1.0–2.0 | 736 | $1,419 | $1.93 | 0d | 5 | 0.62mi |
| 407 Lebaum St SE Unit 4 Washington, DC | 2.0 | 1.0 | 550 | $1,750 | $3.18 | 4d | 1 | 0.65mi |
| 407 Lebaum St SE Unit 1 Washington, DC | 1.0 | 1.0 | 550 | $1,700 | $3.09 | 4d | 1 | 0.65mi |
| 600 Howard Rd SE Washington, DC | 2.0 | 1.0–2.5 | 805 | $4,132 | $5.13 | 3d | 89 | 0.65mi |
| 430 Mellon St SE Unit 2 Washington, DC | 1.0 | 1.0 | 650 | $1,200 | $1.85 | 26d | 1 | 0.67mi |
| 1619 Butler St SE Unit 3 Washington, DC | 2.0 | 1.0 | 700 | $1,700 | $2.43 | 26d | 1 | 0.69mi |
| 535 Mellon St SE Unit 5 Washington, DC | 1.0 | 1.0 | 700 | $1,350 | $1.93 | 22d | 1 | 0.76mi |
| 535 Mellon St SE Washington, DC | 1.0 | 1.0 | 700 | $1,350 | $1.93 | 26d | 1 | 0.76mi |
| 1201 Oak Dr SE Washington, DC | 3.0 | 1.0–2.0 | 892 | $1,312 | $1.47 | 0d | 32 | 0.77mi |
| 212 Oakwood St SE Unit B2 Washington, DC | 1.0 | 1.0 | 597 | $1,650 | $2.76 | 26d | 1 | 0.77mi |
| 215 Oakwood St SE Unit 302 Washington, DC | 1.0 | 1.0 | 700 | $1,080 | $1.54 | 26d | 1 | 0.81mi |
| 562 Malcolm X Ave SE Unit 4 Washington, DC | 2.0 | 1.0 | 550 | $1,600 | $2.91 | 13d | 1 | 0.83mi |
| 2341 Green St SE Washington, DC | 2.0 | 1.0 | 741 | $1,225 | $1.65 | 26d | 1 | 0.85mi |
| 447 Orange St SE #3 Washington, DC | 2.0 | 1.0 | 700 | $1,500 | $2.14 | 6d | 1 | 0.85mi |
| 2942 2nd St SE Washington, DC | 1.0–2.0 | 1.0–2.0 | 762 | $1,299 | $1.70 | 0d | 10 | 0.86mi |
| 327 Parkland Pl SE Washington, DC | 1.0 | 1.0 | 650 | $1,199 | $1.84 | 26d | 1 | 0.90mi |
| 1244 Savannah Pl SE Unit B Washington, DC | 1.0 | 1.0 | 700 | $1,395 | $1.99 | 26d | 1 | 0.98mi |
| 88 V St SW Washington, DC | 1.0–2.0 | 1.5 | 682 | $2,600 | $3.81 | 20d | 2 | 1.00mi |
| 88 V St SW Washington, DC | 1.0–2.0 | 1.5–2.0 | 745 | $2,600 | $3.49 | 23d | 3 | 1.00mi |
| 1600 Marion Barry Ave SE Unit Basement -B01 Washington, DC | 1.0 | 1.0 | 550 | $1,550 | $2.82 | 26d | 1 | 1.00mi |
| 1900 Half St SW Washington, DC | 3.0 | 1.0–2.0 | 862 | $2,832 | $3.28 | 0d | 52 | 1.01mi |
| 2121 1st St SW Washington, DC | 2.0 | 1.0–2.0 | 807 | $3,162 | $3.92 | 0d | 37 | 1.06mi |
| 3321 13th St SE Unit 3 Washington, DC | 2.0 | 1.0 | 703 | $1,750 | $2.49 | 26d | 1 | 1.06mi |
| 2099 1st St SW Washington, DC | 6.0 | 1.0–4.0 | 916 | $2,424 | $2.65 | 0d | 173 | 1.07mi |
| 1800 Half St SW Washington, DC | 2.0 | 1.0–2.0 | 881 | $2,917 | $3.31 | 4d | 30 | 1.08mi |
| 3320 11th Pl SE Washington, DC | 1.0 | 1.0 | 750 | $1,198 | $1.60 | 26d | 1 | 1.08mi |
| 101 V St SW Washington, DC | 2.0 | 1.0–2.5 | 878 | $4,610 | $5.25 | 0d | 116 | 1.08mi |
| 3325 13th St SE Unit 10 Washington, DC | 2.0 | 1.0 | 750 | $1,750 | $2.33 | 26d | 1 | 1.08mi |
| 2000 2nd St SW Washington, DC | 2.0 | 1.0–2.0 | 1046 | $3,878 | $3.71 | 0d | 189 | 1.10mi |
| 1721 T St SE Washington, DC | 1.0–2.0 | 1.0 | 785 | $1,350 | $1.72 | 23d | 6 | 1.11mi |
| 1310 Congress St SE Washington, DC | 1.0 | 1.0 | 518 | $1,150 | $2.22 | 26d | 1 | 1.11mi |
| 1847 Marion Barry Ave SE Washington, DC | 1.0–2.0 | 1.0 | 725 | $1,250 | $1.72 | 26d | 1 | 1.11mi |
| 1300 Congress St SE Unit 10 Washington, DC | 2.0 | 1.0 | 625 | $1,799 | $2.88 | 23d | 1 | 1.11mi |
HOA detail condo
- Monthly dues
- $300 · $3,600/yr
- Assessments
- None detected in remarks — confirm with the listing agent.
Listing history 15 events
-
2026-06-21days on market $149,900 Active 96 DOM
-
2026-06-18days on market $149,900 Active 93 DOM
-
2026-06-17days on market $149,900 Active 92 DOM
-
2026-06-16days on market $149,900 Active 91 DOM
-
2026-06-15days on market $149,900 Active 90 DOM
-
2026-06-13days on market $149,900 Active 88 DOM
-
2026-06-09days on market $149,900 Active 84 DOM
-
2026-06-08days on market $149,900 Active 83 DOM
-
2026-06-07days on market $149,900 Active 82 DOM
-
2026-06-04days on market $149,900 Active 79 DOM
-
2026-06-03days on market $149,900 Active 78 DOM
-
2026-06-02days on market $149,900 Active 77 DOM
-
2026-06-01days on market $149,900 Active 76 DOM
-
2026-05-31days on market $149,900 Active 75 DOM
-
2026-03-17$149,900 Active
ⓘ Source: listings_history table (triggers on properties + properties_extension) + one-shot
backfill from property_details.listing_events for pre-trigger history.
Climate risk First Street
- Flood 1/10 Low FEMA zone X (unshaded) · 0% chance over 30 yrs
- Wildfire 1/10 Low
- Heat 7/10 Severe 7 d/yr ≥104°F today · 14 d/yr by 30 yrs out
- Wind 4/10 Moderate 23% chance of damaging wind over 30 yrs
- Air quality 4/10 Moderate 4 unhealthy d/yr today · 5 by 30 yrs out
Nearby sold comps map
Loading sold comps map…
Walkable amenities ~0.75 mi
Loading nearby amenities…
Taxation est. · year 1
- Rental income
- $22,587
- − Mortgage interest
- −$8,397
- − Property taxes
- −$2,248
- − Insurance
- −$750
- − Repairs & maintenance
- −$1,807
- − Management
- −$1,807
- − HOA
- −$3,600
- − Depreciation
- −$4,361
- Taxable loss
- −$382
- Est. tax savings @ 24.0%
- +$92
- After-tax cash flow
- $1,905/yr
For passive investors: Depreciation is non-cash, so a rental often shows a tax loss while cash-flowing — sheltering income. Rental losses are passive: they offset passive income freely, and up to $25,000/yr can offset ordinary (W-2) income if you actively participate and your MAGI is under $100k (phasing out to $0 by $150k); unused losses carry forward. On sale, claimed depreciation is recaptured at up to 25%, and gains may owe capital-gains tax (a 1031 exchange can defer both). Figures are a year-1 estimate at your 24.0% rate — not tax advice; consult a CPA.
Condition & rehab AI · 12 photos
This well-maintained 1-bedroom, 1-bathroom co-op in Washington, DC is ready for move-in with good condition and minimal repairs needed.
Value-add opportunities
- Both Painting the exterior brick — Enhances curb appeal and can increase both resale and rental value
- Both Landscaping the front yard — Improves curb appeal and can increase both resale and rental value
Renovation cost estimate screening
Value-add ROI direction
- Both Painting the exterior brick — Enhances curb appeal and can increase both resale and rental value ↑
- Both Landscaping the front yard — Improves curb appeal and can increase both resale and rental value ↑
ⓘ Cost ranges are severity-bucket heuristics (US national rule-of-thumb). Get contractor quotes + a written scope before underwriting a rehab budget.
Schools (NCES district)
- District
- District Of Columbia Public Schools
- NCES district ID
- 1100030
- Math proficiency
- 33% ▲ 3.00%
- Reading proficiency
- 40% ▲ 5.00%
- Median HH income
- $67,671
- Composite
- 35.84/100
- National rank
- #9606
- State rank
- #8 of 32 in DC
Livability — Washington
- Score
- 73/100
- State rank
- #1
- US rank
- #5327
Category grades
Schools grade is shown separately in the Schools card above.
Census & demographics
- Census place
- Washington, DC
- County
- District of Columbia · 671,873 people
- City population
- 671,873
- Metro
- Washington-Arlington-Alexandria, DC-VA-MD-WV
- Population (ZIP)
- 53,005
- Household income
- $54,032
- Rent vs Own
- Severe rent burden
- 5148.0
Population outlook (District of Columbia County) Hauer SSP2
- Today (2025)
- 821,926 people
- By 2030
- 899,517 · +9.4%
- By 2040
- 1,061,162 · +29.1%
- By 2050
- 1,231,493 · +49.8%
- By 2075
- 1,603,312 · +95.1%
- By 2100
- 1,847,141 · +124.7%
Race, ethnicity, and origin ACS 2023
- Neighborhood character
- Predominantly Black (90%)
- Race & ethnicity
- Black 90% Two or more races 3% Hispanic / Latino 3% White 3%
- Common ancestry
- Lithuanian 1%
- Foreign-born
- 3% · Canada
- Languages at home
- 95% English-only · Spanish 2% French/Haitian/Cajun 1%
Political lean MEDSL · District of Columbia
- 2024 margin
- Solid D (+86.1) · D 91.2% · R 5.1% · Other 3.8%
- 2008→2024 swing
- +0.1pp no change · 2008: 85.9pp · 2024: 86.1pp
- All cycles
- 2024: D+86.1 2020: D+86.8 2016: D+88.7 2012: D+84.2 2008: D+85.9
Not yet ingested
- Civics
- —
Market trends
- HPI YoY
- ▼ -415.44%
- Current HPI
- 306.5068
- Rent YoY
- ▲ 3.86%
- Metro
- Washington-Arlington-Alexandria, DC-VA-MD-WV
- State GDP YoY
- ▲ 1.33%
- F500 in state
- 6
Industry mix (Fortune 500 HQ in DC)
| Industry | F500 HQs | Revenue |
|---|---|---|
| Financial Services | 1 | $153B |
|
||
| Life Sciences / Industrials | 1 | $25B |
|
||
| Industrial Machinery | 1 | $8B |
|
||
Price history
1 event — show timeline
- 2026-03-17 Listed $149,900 BRIGHT MLS
Cash-flow waterfall
monthlySold comps — $/sqft
last 12 mo · ≤1 miLoading sold comps…