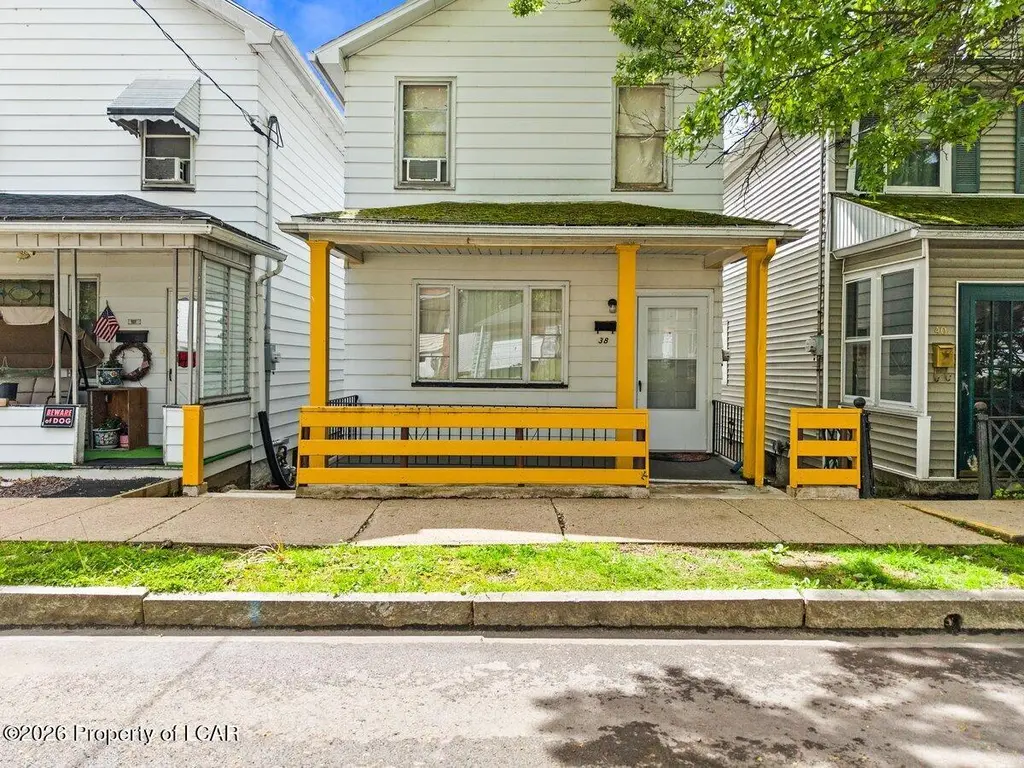
38 Sheridan St · Wilkes-Barre, PA
Flood risk 1/10 · Minimal
- FEMA flood zone
- X (unshaded)
- Chance of flooding over 30 yrs
- 0.0%
- Est. flood insurance / yr
- $507 – $1,088
Fire risk 4/10 · Minor
- Est. fire insurance / yr
- $511 – $949
Heat risk 4/10 · Minor
- Hot days now (above 95°F)
- 7 days/yr
- Hot days in 30 yrs
- 16 days/yr
Wind risk 3/10 · Minor
- Chance of severe wind over 30 yrs
- 5.0%
Air-quality risk 2/10 · Minimal
- Unhealthy air days now
- 1 days/yr
- Unhealthy air days in 30 yrs
- 2 days/yr
Risk factors via First Street. Map © Google.
Why this score? — see what drove the C- grade
The composite is a weighted blend of 9 inputs, each scored 0–100. Each bar is that input's sub-score; the figure is the points it added to the 100-point composite (weight × sub-score).
- Cash flow +19.8/30.0
- ARV discount +8.6/15.0
- DSCR +6.3/10.0
- 1% rule +5.2/10.0
- Rent growth +4.2/5.0
- Livability +2.5/5.0
- Condition / age +2.5/5.0
- Schools +2.1/10.0
- Appreciation +0.0/10.0
$120,000
🖨 Deal sheet 📄 Offer letter ✓ Due diligence
Listing remarks
This well-kept 2-bedroom, 1-bath home in Wilkes-Barre offers comfort, convenience, and solid rental potential. Currently used as a rental property, it provides an excellent opportunity for investors or for buyers looking for an affordable primary residence. Inside, you'll find a bright living space, an efficient kitchen with plenty of storage, and two comfortable bedrooms. The bathroom has
Key facts
- Built 1923
- Listed 31 days
Property features AI
Exterior
- Utilities: Public water; Public sewer; Cable available
- Home design: Single family residence; Two levels
- Construction: Vinyl siding
- Exterior features: Porch; Cleared lot
Interior
- Kitchen: Eat-in kitchen
- Bedrooms: Total of 5 rooms (includes sleeping areas)
- Bathrooms: 1 full bathroom
- Heating & cooling: Natural gas heating; Steam heating; Ceiling fan(s) for cooling; Has central cooling
- Interior features: Eat-in kitchen; Full unfinished basement
- Laundry & utility: Gas water heater
Neighborhood map
What this means for you Summary
Snapshot
- This is a 2-bed/1.0-bath single-family listed at $120k.
Deal economics
- At list price, monthly cash flow is $142 ($2k/yr) — positive.
- The deal already cash-flows at list — no discount required.
- Meets the 1% rule at list price ($1k rent vs $120k).
- Recommended offer: $116k (3.0% below list) — sets the bar for market timing.
- Cap rate 7.7% vs local median 5.7% in Wilkes-Barre — top-decile yield for the area; either an underpriced asset or a hidden risk that comps aren't pricing in. Stress-test before assuming the spread holds.
Location & tenants
- Location reads: area grade C — affects rentability + tenant quality, not the cash-flow math above.
- Wilkes-Barre Area SD (urban): math 19% / reading 32% proficiency, ranked #469 of 539 in PA (top 87%) — low school quality limits family demand, transient renter base, plan for 1-2y turnover; 61% free/reduced lunch — lower-income household profile, screen leases tightly.
- Market conditions: Rents rising fast (+6.8%/yr); 221 active listings in the ZIP; 38 comparable units currently listed for rent nearby; rentals at typical pace (median 21d on market — plan ~3-4 weeks tenant-placement turnaround); 42% of comp listings sitting > 30 days — soft ceiling on asking rent; 349 units permitted in Luzerne County in 2024 (16 in 5+ unit buildings).
Forward outlook
- Local home prices are declining (-3.0%/yr); year-one equity from $830 of loan paydown is wiped out by about $4k of value loss. Plan a longer hold.
- Luzerne County population projected at +4% by 2050 — modest demand growth; plan on rents tracking national, not racing it.
- At projected returns (-3.0% appreciation + 6.8% rent growth), your $34k cash investment doubles in ~10 years — after that, you're playing with house money.
Negotiation context
- It's been on market 31 days — a 3% lower offer ($116k) is reasonable based on typical stale-listing flexibility.
Risks & watch-outs
- Watch-outs: built in 1923 — expect roof / HVAC / electrical / plumbing capex.
Questions for the listing agent
- It's been on market 31 days. Have you received any prior offers? Is the seller open to a 3% concession, seller financing, or rate buy-down credit?
- Built in 1923 — when were the roof, HVAC, electrical panel, plumbing, and water heater last replaced?
- Is there a deadline driving the sale (1031 exchange, divorce, estate, relocation)? That informs how much negotiation room exists.
- What's the average days-on-market for RENTAL listings here right now (not sales)? A rising rental-DOM trend means longer vacancies and softer asking-rent achievability than the comps imply.
- What's the recent tenant-quality profile in this submarket — average credit score on applications, eviction rate, late-payment / NSF rate, and stable-employment percentage? A property-management company in the area should have these aggregated.
- How much new for-sale + rental construction is in the pipeline within 1–3 miles? Heavy new supply typically softens prices + rents 12–24 months out; constrained supply supports both.
Investment metrics
- 1% rule
- 1.02% ✓
- Cap rate
- 7.71%
- Cash-on-cash
- 5.07%
- DSCR
- 1.23
- GRM
- 8.1
CMA / ARV
- ARV (median comp)
- $122,989
- List price
- $120,000
- Delta
- -2.43%
- Verdict
- FAIR
- Comps
- 20 within 1.0 mi
Show comp detail 11 sales within ~0.75 mi
| Address | Dist | Beds/Ba | Sqft | Sold | Price | $/sf | Match |
|---|---|---|---|---|---|---|---|
| 9 Joseph Ln | 0.05mi | 3/1.5 (+1) | 1,000 (+8%) | 3mo | $135,000 | $135 | 75 |
| 233 Augusta St | 0.54mi | 2/1.0 | 986 (+6%) | 10mo | $185,000 | $188 | 56 |
| 218 Moyallen St | 0.75mi | 3/1.0 (+1) | 940 (+1%) | 6mo | $120,000 | $128 | 53 |
| 412 Grant St | 0.58mi | 3/2.0 (+1) | 882 (-5%) | 7mo | $115,000 | $130 | 50 |
| 253 Meade St | 0.26mi | 2/1.5 | 814 (-12%) | 20mo | $177,000 | $217 | 49 |
| 305 Sheridan St | 0.51mi | 2/1.0 | 850 (-8%) | 18mo | $105,000 | $124 | 47 |
| 69 Hutson St | 0.66mi | 2/1.0 | 1,044 (+12%) | 8mo | $125,000 | $120 | 42 |
| 664 Pine St | 0.46mi | 2/1.0 | 1,058 (+14%) | 17mo | $190,000 | $180 | 41 |
| 220 Noble Ln | 0.62mi | 2/1.0 | 1,052 (+13%) | 10mo | $90,000 | $86 | 41 |
| 73 Leslie St | 0.71mi | 3/1.0 (+1) | 1,007 (+8%) | 16mo | $100,000 | $99 | 34 |
| 204 Noble Ln | 0.60mi | 3/1.5 (+1) | 1,052 (+13%) | 16mo | $173,000 | $164 | 29 |
Match score weights: distance 35% · size 25% · config 20% · recency 20%. Top-matched comps best support the ARV.
Projected returns pro-forma
-3.0% appreciation · 6.84% rent growth · sell at horizon
- IRR
- -4.2%
- Equity multiple
- 0.84×
- Total profit
- $-5,455
- Equity at exit
- $17,892
- IRR
- 9.5%
- Equity multiple
- 1.86×
- Total profit
- $28,875
- Equity at exit
- $10,375
Cash invested: $33,600 (down + closing). Projections, not guarantees.
Landlord ↔ Tenant lean methodology
- Overall (STATE)
- 62 Landlord-Friendly
- State Pennsylvania
- 62 Landlord-Friendly · EVEN
- County
- — inherits STATE
- City
- — inherits STATE
ZIP-level market 18702
- Rents YoY
- 6.8%
- Active inventory
- 221
- Price-to-rent
- 8.1×
Monthly cashflow live
- Estimated rent
- $1,229 high interval (Pro) →
- Mortgage (P&I)
- −$629
- Tax est. 1.5%
- −$150 /mo · $1,800/yr
- Insurance
- −$50
- HOA
- −$0
- Vacancy / Maint / Mgmt
- −$258
- Net cashflow
- $142
Break-even live
UW: 25.0% down · 7.5% · 30yr · 1.5% tax · 5.0% vac · 8.0% maint · 8.0% mgmt
Financing live
Cash to close
- Down payment
- $30,000
- Closing costs
- $3,600
- Reserves months
- —
- Total cash needed
- —
Loan-product check · same deal, 3 products live
Conventional
25% down · 7.5% · 30yr
- Down + closing
- —
- Monthly P&I
- —
- Monthly cashflow
- —
- DSCR
- —
- Eligible?
- —
Personal DTI + credit; lowest rate.
DSCR
20% down · 8.5% · 30yr
- Down + closing
- —
- Monthly P&I
- —
- Monthly cashflow
- —
- DSCR
- —
- Eligible?
- —
No personal income docs; deal must DSCR.
Hard money
10% down · 12.0% · 12mo
- Down + closing
- —
- Monthly P&I
- —
- Monthly cashflow
- —
- DSCR
- —
- Eligible?
- —
Short-term bridge; refi at stabilization.
Rent comps 38 comps
| Address | Beds | Baths | Sqft | Rent | $/sqft | DOM | Units | Dist |
|---|---|---|---|---|---|---|---|---|
| 79 Sheridan St Wilkes-Barre, PA | 2.0 | 1.0 | 650 | $1,200 | $1.85 | 43d | 1 | 0.08mi |
| 83 S Empire St Unit 2 Wilkes-Barre, PA | 1.0 | 1.0 | 600 | $850 | $1.42 | 13d | 1 | 0.14mi |
| 83 S Empire St Unit 1 Wilkes-Barre, PA | 1.0 | 1.0 | 900 | $850 | $0.94 | 21d | 1 | 0.14mi |
| 178 S Sherman St Wilkes Barre, PA | 3.0 | 1.0 | 670 | $1,500 | $2.24 | 21d | 1 | 0.19mi |
| 178 S Sherman St Unit 1 Wilkes-Barre, PA | 3.0 | 1.0 | 670 | $1,500 | $2.24 | 43d | 1 | 0.19mi |
| 2 S Empire St Unit 2R Wilkes-Barre, PA | 2.0 | 1.0 | 850 | $1,250 | $1.47 | 21d | 1 | 0.29mi |
| 703 E Northampton St Wilkes Barre, PA | 1.0 | 1.0 | 600 | $825 | $1.38 | 43d | 1 | 0.53mi |
| 62 Hutson St Unit 1 Wilkes-Barre, PA | 2.0 | 1.0 | 730 | $1,250 | $1.71 | 13d | 1 | 0.63mi |
| 62 Hutson St Wilkes Barre, PA | 2.0 | 1.0 | 1100 | $1,150 | $1.05 | 43d | 1 | 0.63mi |
| 32 Murray St Unit 34 Wilkes-Barre, PA | 3.0 | 1.0 | 930 | $1,100 | $1.18 | 21d | 1 | 0.81mi |
| 67-69 Public Sq #1203 Wilkes Barre, PA | 2.0 | 1.0 | 875 | $1,825 | $2.09 | 43d | 1 | 0.83mi |
| 273 New Hancock St Apt 3 Wilkes-Barre, PA | 1.0 | 1.0 | 625 | $1,125 | $1.80 | 43d | 1 | 0.83mi |
| 67-69 Public Sq Wilkes-Barre, PA | 2.0 | 1.0 | 910 | $1,875 | $2.06 | 43d | 1 | 0.83mi |
| 273 New Hancock St Unit 2 Wilkes-Barre, PA | 2.0 | 1.0 | 725 | $1,300 | $1.79 | 21d | 1 | 0.83mi |
| 2 N Diamond St Wilkes-Barre, PA | 3.0 | 1.0 | 1000 | $1,500 | $1.50 | 21d | 1 | 0.89mi |
| 150 S Franklin St Wilkes Barre, PA | 2.0 | 1.0 | 850 | $1,750 | $2.06 | 43d | 1 | 0.92mi |
| 30 Chapel St Wilkes Barre, PA | 1.0 | 1.0 | 700 | $1,150 | $1.64 | 21d | 1 | 0.98mi |
| 268 N Pennsylvania Ave Unit 2 Wilkes-Barre, PA | 3.0 | 1.0 | 758 | $1,300 | $1.72 | 21d | 1 | 1.00mi |
| 261 N Washington St Wilkes Barre, PA | 3.0 | 1.0 | 1050 | $1,400 | $1.33 | 43d | 1 | 1.04mi |
| 19 N River St Unit 403 Wilkes-Barre, PA | 2.0 | 1.0 | 723 | $1,600 | $2.21 | 13d | 1 | 1.05mi |
| 19 N River St Unit 308 Wilkes-Barre, PA | 2.0 | 1.5 | 910 | $1,600 | $1.76 | 13d | 1 | 1.05mi |
| 403 S Franklin St Wilkes Barre, PA | 2.0 | 1.0 | 900 | $1,050 | $1.17 | 21d | 1 | 1.08mi |
| 366 S River St Apt 3 Wilkes-Barre, PA | 1.0 | 1.0 | 1000 | $975 | $0.97 | 21d | 1 | 1.12mi |
| 132 Sambourne St Wilkes Barre, PA | 2.0 | 1.0 | 1000 | $1,250 | $1.25 | 21d | 1 | 1.13mi |
| 168-170 Kidder St Wilkes-Barre, PA | 2.0 | 1.0 | 750 | $1,250 | $1.67 | 21d | 1 | 1.17mi |
| 44 Eagle Ct Wilkes Barre, PA | 1.0–3.0 | 1.0–1.5 | 910 | $1,722 | $1.89 | 13d | 5 | 1.18mi |
| 168 Kidder St City of Wilkes Barre, PA | 2.0 | 1.0 | 750 | $1,250 | $1.67 | 21d | 1 | 1.18mi |
| 301 N Main St Unit 2 Wilkes-Barre, PA | 3.0 | 1.0 | 1050 | $1,300 | $1.24 | 21d | 1 | 1.20mi |
| 155 W River St Wilkes Barre, PA | 3.0 | 2.0 | 1100 | $1,425 | $1.30 | 43d | 1 | 1.21mi |
| 239 Poplar St Wilkes Barre, PA | 3.0 | 1.5 | 1100 | $1,350 | $1.23 | 43d | 1 | 1.30mi |
| 402 Scott St Fl 3 Wilkes-Barre, PA | 2.0 | 1.0 | 761 | $950 | $1.25 | 43d | 1 | 1.30mi |
| 30 Elizabeth St Wilkes Barre, PA | 1.0 | 1.0 | 650 | $900 | $1.38 | 43d | 1 | 1.31mi |
| 423 Scott St Apt 1 Wilkes-Barre, PA | 3.0 | 1.0 | 1100 | $1,450 | $1.32 | 43d | 1 | 1.33mi |
| 26 Stanley St Wilkes Barre, PA | 2.0 | 1.0 | 950 | $1,650 | $1.74 | 43d | 1 | 1.34mi |
| 75 Wood St Wilkes Barre, PA | 2.0 | 1.0 | 990 | $1,300 | $1.31 | 43d | 1 | 1.36mi |
| 26 Bradford St Wilkes Barre, PA | 3.0 | 1.5 | 1056 | $1,400 | $1.33 | 13d | 1 | 1.40mi |
| 100 Parkway Blvd Kingston, PA | 2.0 | 1.0 | 650 | $1,400 | $2.15 | 13d | 1 | 1.46mi |
| 780 Hazle St Unit Rear 2nd Fl Ashley, PA | 2.0 | 1.0 | 850 | $975 | $1.15 | 13d | 1 | 1.48mi |
Listing history 14 events
-
2026-06-15status $120,000 Pending 31 DOM
-
2026-06-15days on market $120,000 Active 31 DOM
-
2026-06-14days on market $120,000 Active 29 DOM
-
2026-06-13days on market $120,000 Active 28 DOM
-
2026-06-10days on market $120,000 Active 26 DOM
-
2026-06-09days on market $120,000 Active 25 DOM
-
2026-06-08days on market $120,000 Active 24 DOM
-
2026-06-07days on market $120,000 Active 23 DOM
-
2026-06-03price $120,000 Active 18 DOM
-
2026-06-02days on market $135,000 Active 18 DOM
-
2026-06-01days on market $135,000 Active 17 DOM
-
2026-05-31days on market $135,000 Active 16 DOM
-
2026-05-30days on market $135,000 Active 15 DOM
-
2026-05-15$135,000 Active 392-char remark
ⓘ Source: listings_history table (triggers on properties + properties_extension) + one-shot
backfill from property_details.listing_events for pre-trigger history.
Climate risk First Street
- Flood 1/10 Low FEMA zone X (unshaded) · 0% chance over 30 yrs
- Wildfire 4/10 Moderate
- Heat 4/10 Moderate 7 d/yr ≥95°F today · 16 d/yr by 30 yrs out
- Wind 3/10 Moderate 5% chance of damaging wind over 30 yrs
- Air quality 2/10 Low 1 unhealthy d/yr today · 2 by 30 yrs out
Nearby sold comps map
Loading sold comps map…
Walkable amenities ~0.75 mi
Loading nearby amenities…
Taxation est. · year 1
- Rental income
- $14,753
- − Mortgage interest
- −$6,722
- − Property taxes
- −$1,800
- − Insurance
- −$600
- − Repairs & maintenance
- −$1,180
- − Management
- −$1,180
- − Depreciation
- −$3,491
- Taxable loss
- −$221
- Est. tax savings @ 24.0%
- +$53
- After-tax cash flow
- $1,756/yr
For passive investors: Depreciation is non-cash, so a rental often shows a tax loss while cash-flowing — sheltering income. Rental losses are passive: they offset passive income freely, and up to $25,000/yr can offset ordinary (W-2) income if you actively participate and your MAGI is under $100k (phasing out to $0 by $150k); unused losses carry forward. On sale, claimed depreciation is recaptured at up to 25%, and gains may owe capital-gains tax (a 1031 exchange can defer both). Figures are a year-1 estimate at your 24.0% rate — not tax advice; consult a CPA.
Schools (NCES district)
- District
- Wilkes-Barre Area SD
- NCES district ID
- 4226300
- Math proficiency
- 19% ▼ -2.00%
- Reading proficiency
- 32% ▼ -9.00%
- Median HH income
- $37,420
- Composite
- 21.22/100
- National rank
- #8409
- State rank
- #469 of 539 in PA
Livability — Wilkes-Barre
No livability data for this city. (Only ~50 U.S. cities are tracked.)
Census & demographics
- Census place
- Wilkes-Barre, PA
- County
- Luzerne County · 118,885 people
- City population
- 73,981
- Metro
- Scranton--Wilkes-Barre, PA
- Population (ZIP)
- 41,970
- Household income
- $56,378
- Rent vs Own
- Severe rent burden
- 1632.0
Population outlook (Luzerne County) Hauer SSP2
- Today (2025)
- 319,505 people
- By 2030
- 319,943 · +0.1%
- By 2040
- 322,643 · +1.0%
- By 2050
- 330,817 · +3.5%
- By 2075
- 379,145 · +18.7%
- By 2100
- 431,908 · +35.2%
Race, ethnicity, and origin ACS 2023
- Neighborhood character
- Diverse neighborhood (Simpson 0.59)
- Race & ethnicity
- White 58% Hispanic / Latino 25% Black 12% Two or more races 11% Asian 2%
- Hispanic origin (detail)
- Mexican 6% Puerto Rican 6% Dominican 9%
- Common ancestry
- Romanian 14% Scotch-Irish 2% Iranian 1%
- Foreign-born
- 13% · Canada, Jamaica
- Languages at home
- 79% English-only · Spanish 17% Other Asian/Pacific 1% Other Indo-European 1%
Political lean MEDSL · Luzerne
- 2024 margin
- R (+19.2) · D 40.0% · R 59.2%
- 2008→2024 swing
- -27.6pp toward R · 2008: 8.4pp · 2024: -19.2pp
- All cycles
- 2024: R+19.2 2020: R+14.4 2016: R+19.6 2012: D+4.8 2008: D+8.4
Not yet ingested
- Civics
- —
Market trends
- HPI YoY
- ▼ -156.99%
- Current HPI
- 216.9373
- Rent YoY
- ▲ 6.84%
- Metro
- Scranton--Wilkes-Barre, PA
- State GDP YoY
- ▲ 1.68%
- F500 in state
- 34
Industry mix (Fortune 500 HQ in PA)
| Industry | F500 HQs | Revenue |
|---|---|---|
| Healthcare | 2 | $309B |
|
||
| Insurance | 2 | $27B |
|
||
| Telecommunications / Media | 1 | $124B |
|
||
| Industrial Distribution | 1 | $22B |
|
||
| Financial Services | 1 | $20B |
|
||
| Chemicals / Materials | 1 | $18B |
|
||
Price history
-11.1% since first listed3 events — show timeline
- 2026-06-15 Pending — LCAR
- 2026-06-02 Price Changed $120,000 LCAR
- 2026-05-15 Listed $135,000 LCAR
Property tax history
+20.4%/yrLatest (2026): $7,397 · +0.1% YoY. Source: county tax records.
Cash-flow waterfall
monthlySold comps — $/sqft
last 12 mo · ≤1 miLoading sold comps…