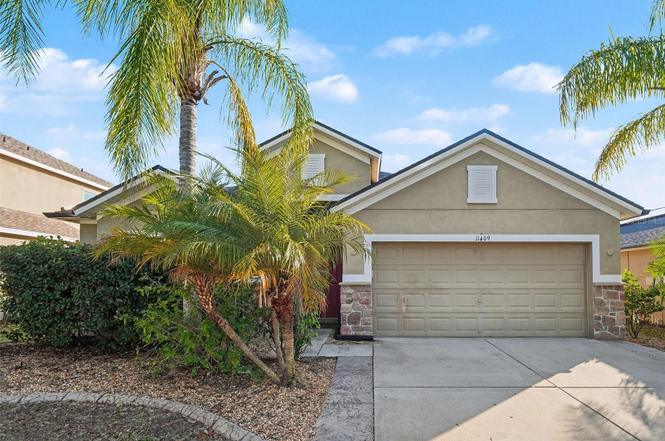
11409 Flora Springs Dr · Riverview, FL
Flood risk 1/10 · Minimal
- FEMA flood zone
- X (unshaded)
- Chance of flooding over 30 yrs
- 0.0%
- Est. flood insurance / yr
- $507 – $1,088
Fire risk 3/10 · Minor
- Est. fire insurance / yr
- $947 – $1,759
Heat risk 10/10 · Severe
- Hot days now (above 109°F)
- 7 days/yr
- Hot days in 30 yrs
- 29 days/yr
Wind risk 9/10 · Severe
- Chance of severe wind over 30 yrs
- 99.0%
Air-quality risk 3/10 · Minor
- Unhealthy air days now
- 3 days/yr
- Unhealthy air days in 30 yrs
- 3 days/yr
Risk factors via First Street. Map © Google.
Why this score? — see what drove the D grade
The composite is a weighted blend of 9 inputs, each scored 0–100. Each bar is that input's sub-score; the figure is the points it added to the 100-point composite (weight × sub-score).
- Cash flow +10.4/30.0
- ARV discount +7.5/15.0
- Appreciation +4.3/10.0
- Schools +4.2/10.0
- Livability +4.0/5.0
- DSCR +3.0/10.0
- Rent growth +2.8/5.0
- 1% rule +2.5/10.0
- Condition / age +2.5/5.0
$375,000
🖨 Deal sheet (PDF) 📄 Offer letter ✓ Due diligence
Listing remarks MLS
Beautiful, model-like home that shows pride of ownership. You won’t find a 4-bedroom home with the amenities this home has to offer in this price range. Great curb appeal with Florida landscaping. The driveway has been extended on both sides. This home has many features and up-grades that you will not find with other homes. The home is complete with a water softener system for the entire house, and a special filter system for the drinking water at the fridge and reverse osmosis faucet installed at the kitchen sink. The house is monitored by a state of the art security system. The garage comes equipped with storage shelving. The seller installed gutters around the house . The entrance, kitchen, living areas and hall way are tiled and the interior is painted with all neutral colors making this a turn-key move in with no work or paintings needed. The kitchen is open with a cooking island and granite counter tops with a double door pantry There is plenty of cabinet space for all your kitchen appliances and dishes. ,The seller installed Plantation shutters an exceptional look. Relax and enjoy the 72’ LED home theater system, you will not believe the sound and picture an amazing value and upgrade to this home not matched anyplace else. A conservation home site with plenty of privacy. The back yard is fenced for your family pet. Sit and enjoy the Florida sunsets in the screened in Lanai. Make this your first stop
Key facts
- Screened-in lanai
- Gourmet kitchen
- Granite countertops
Tags
Property features AI
Finance
- Other: Property type: Residential (Single Family Residence); Zoning: PD
- Financial info: CDD present
- HOA & community: Community amenities include clubhouse, pool, park, playground and sidewalks; Deed-restricted community; HOA managed by DLG Management Services; HOA required; $41 monthly (approximately $123 quarterly)
Exterior
- Parking: 2-car garage
- Utilities: Public water; Public sewer; Public utilities
- Home design: Single-family residence; One story; North-facing
- Construction: Stucco construction; Shingle roof; Slab foundation; Built area approximately 2,772 square feet
- Exterior features: Rain gutters; Paved road access; Lot about 0.14 acres (0 to less than 1/4 acre)
Interior
- Kitchen: Dishwasher; Microwave; Range; Refrigerator
- Bedrooms: 4 bedrooms
- Flooring: Carpet; Tile
- Bathrooms: 2 full bathrooms
- Heating & cooling: Central heating; Central air conditioning
- Interior features: Ceiling fans
- Laundry & utility: Laundry room with washer and electric dryer hookups
Neighborhood map
What this means for you Summary
Snapshot
- This is a 4-bed/2.0-bath single-family listed at $375k.
Deal economics
- At list price, monthly cash flow is $-200 ($-2k/yr) — negative.
- To cash-flow at today's rent, offer at most $340k (9.4% below list).
- To meet the 1% rule (rent ≥ 1% of price), the offer needs to be $280k (25.4% below list).
- Recommended offer: $280k (25.4% below list) — sets the bar for 1% rule.
Location & tenants
- Location reads 79/100 on livability (#134 in FL, #2,000 nationally) — a middle-class / working-renter tenant base. Strengths: housing A+, health & safety A+, employment B+; Watch: amenities F.
- Hillsborough (suburban): math 47% / reading 50% proficiency, ranked #41 of 73 in FL (top 56%) — families likely to look elsewhere, expect single-tenant / working-renter base with shorter leases.
- Zoned schools: Summerfield Crossings Elementary School (math 43% / reading 45%, grade F, #1,330 of 2,144 statewide, top 63%, 869 students, 53% FRL); East Bay High School (math 24% / reading 35%, grade F, #447 of 667 statewide, top 68%, 1,995 students, 51% FRL) — zoned schools at 52% FRL track the district average.
- Market conditions: Rents rising (+1.2%/yr); 463 active listings in the ZIP; 40 comparable units currently listed for rent nearby; rentals at typical pace (median 16d on market — plan ~3-4 weeks tenant-placement turnaround); high-income renter base; 9,053 units permitted in Hillsborough County in 2024 (4,555 in 5+ unit buildings).
Forward outlook
- Local home prices are declining (-1.4%/yr); year-one equity from $3k of loan paydown is wiped out by about $5k of value loss. Plan a longer hold.
- Hillsborough County population projected at +37% by 2050 — long-run rental-demand tailwind backs the buy-and-hold thesis.
Negotiation context
- It's been on market 101 days — a 9% lower offer ($341k) is reasonable based on typical stale-listing flexibility.
- 4 sale attempts since 17y ago; this cycle's ask has dropped $25k (6%) from the opening price — seller is motivated, your offer sets the floor, not the list.
Risks & watch-outs
- Climate carrying-cost: severe wind risk, 99% chance of damaging wind over 30y; extreme-heat days projected 7→29/yr by 2055 (HVAC capex compounding) — expect insurance premiums to compound above CPI over the hold.
Questions for the listing agent
- What do current leases actually rent for vs. the listed asking? Can we see a recent rent roll and the last 12 months of T-12 income?
- It's been on market 101 days. Have you received any prior offers? Is the seller open to a 25% concession, seller financing, or rate buy-down credit?
- What does the HOA fee cover, when was the last increase, and are there any pending special assessments or reserve-fund shortfalls?
- Why hasn't it sold? Are there any deal-killer items the seller is aware of (foundation, flood, title, zoning, code violations)?
- Is there a deadline driving the sale (1031 exchange, divorce, estate, relocation)? That informs how much negotiation room exists.
- Schools are B-rated — typically a magnet for longer-tenancy family renters. What's the average tenant stay here, and is there a school-zone premium baked into asking?
- The area grade is low — what's the realistic commute time and amenity access for the typical tenant pool here? Any planned neighborhood developments (good or bad) we should know about?
- What's the average days-on-market for RENTAL listings here right now (not sales)? A rising rental-DOM trend means longer vacancies and softer asking-rent achievability than the comps imply.
- What's the recent tenant-quality profile in this submarket — average credit score on applications, eviction rate, late-payment / NSF rate, and stable-employment percentage? A property-management company in the area should have these aggregated.
- How much new for-sale + rental construction is in the pipeline within 1–3 miles? Heavy new supply typically softens prices + rents 12–24 months out; constrained supply supports both.
Investment metrics
- 1% rule
- 0.75% ✗
- Cap rate
- 5.65%
- Cash-on-cash
- -2.28%
- DSCR
- 0.90
- GRM
- 11.2
CMA / ARV
No comps found within radius.
Projected returns pro-forma
-1.42% appreciation · 1.18% rent growth · sell at horizon
- IRR
- -12.4%
- Equity multiple
- 0.49×
- Total profit
- $-53,135
- Equity at exit
- $83,000
- IRR
- -7.1%
- Equity multiple
- 0.43×
- Total profit
- $-59,445
- Equity at exit
- $80,900
Cash invested: $105,000 (down + closing). Projections, not guarantees.
Landlord ↔ Tenant lean methodology
- Overall (STATE)
- 87 Strongly Landlord-Friendly
- State Florida
- 87 Strongly Landlord-Friendly · R+3
- County
- — inherits STATE
- City
- — inherits STATE
ZIP-level market 33579
- Home prices YoY
- -0.6%
- Rents YoY
- 1.2%
- Active inventory
- 463
- Price-to-rent
- 11.2×
Monthly cashflow live
- Estimated rent
- $2,796 high interval (Pro) →
- Mortgage (P&I)
- −$1,967
- Tax from tax record
- −$245 /mo · $2,938/yr
- Insurance
- −$156
- HOA
- −$41
- Vacancy / Maint / Mgmt
- −$587
- Net cashflow
- $-200
Break-even live
Sensitivity live
| Price | -10% $12 | -5% $-94 | +0% $-200 | +5% $-306 | +10% $-412 |
|---|---|---|---|---|---|
| Rent | -10% $-421 | -5% $-310 | +0% $-200 | +5% $-89 | +10% $21 |
| Rate | -1.0pp $-11 | -0.5pp $-105 | base $-200 | +0.5pp $-297 | +1.0pp $-396 |
UW: 25.0% down · 7.5% · 30yr · 1.5% tax · 5.0% vac · 8.0% maint · 8.0% mgmt
Financing live
Cash to close
- Down payment
- $93,750
- Closing costs
- $11,250
- Reserves months
- —
- Total cash needed
- —
Loan-product check · same deal, 3 products live
Conventional
25% down · 7.5% · 30yr
- Down + closing
- —
- Monthly P&I
- —
- Monthly cashflow
- —
- DSCR
- —
- Eligible?
- —
Personal DTI + credit; lowest rate.
DSCR
20% down · 8.5% · 30yr
- Down + closing
- —
- Monthly P&I
- —
- Monthly cashflow
- —
- DSCR
- —
- Eligible?
- —
No personal income docs; deal must DSCR.
Hard money
10% down · 12.0% · 12mo
- Down + closing
- —
- Monthly P&I
- —
- Monthly cashflow
- —
- DSCR
- —
- Eligible?
- —
Short-term bridge; refi at stabilization.
Rent comps 40 comps
| Address | Beds | Baths | Sqft | Rent | $/sqft | DOM | Units | Dist |
|---|---|---|---|---|---|---|---|---|
| 11211 Flora Springs Dr Riverview, FL | 5.0 | 3.0 | 2320 | $2,723 | $1.17 | 25d | 1 | 0.23mi |
| 13625 Silver Charm Ct Riverview, FL | 4.0 | 2.5 | 1907 | $2,350 | $1.23 | 26d | 1 | 0.28mi |
| 11164 Golden Silence Dr Riverview, FL | 3.0 | 2.0 | 1930 | $2,050 | $1.06 | 26d | 1 | 0.32mi |
| 11510 Harlan Eddy Ct Riverview, FL | 4.0 | 2.0 | 2351 | $2,700 | $1.15 | 26d | 1 | 0.33mi |
| 13423 Beechberry Dr Riverview, FL | 4.0 | 2.5 | 2322 | $2,795 | $1.20 | 0d | 1 | 0.39mi |
| 13305 Silvercreek Dr Riverview, FL | 3.0 | 2.0 | 1743 | $2,099 | $1.20 | 7d | 1 | 0.44mi |
| 11025 Golden Silence Dr Riverview, FL | 3.0 | 2.5 | 1785 | $2,210 | $1.24 | 16d | 1 | 0.45mi |
| 13655 Artesa Bell Dr Riverview, FL | 4.0 | 3.0 | 2351 | $3,000 | $1.28 | 0d | 1 | 0.45mi |
| 13465 Fladgate Mark Dr Riverview, FL | 4.0 | 2.0 | 1544 | $2,045 | $1.32 | 1d | 1 | 0.51mi |
| 13465 Fladgate Mark Dr Riverview, FL | 4.0 | 2.0 | 1544 | $2,045 | $1.32 | 7d | 1 | 0.51mi |
| 11009 Golden Silence Dr Riverview, FL | 4.0 | 2.5 | 2154 | $2,800 | $1.30 | 26d | 1 | 0.51mi |
| 11514 Brighton Knoll Loop Riverview, FL | 3.0 | 2.5 | 2759 | $2,900 | $1.05 | 14d | 1 | 0.52mi |
| 11218 Scotchwood Dr Riverview, FL | 3.0 | 2.0 | 1546 | $2,150 | $1.39 | 16d | 1 | 0.61mi |
| 11176 Leland Groves Dr Riverview, FL | 4.0 | 2.5 | 2318 | $2,700 | $1.16 | 7d | 1 | 0.64mi |
| 11519 Misty Isle Ln Riverview, FL | 4.0 | 2.0 | 1936 | $2,600 | $1.34 | 26d | 1 | 0.66mi |
| 11025 Whittney Chase Dr Riverview, FL | 4.0 | 2.0 | 1544 | $2,170 | $1.41 | 0d | 1 | 0.66mi |
| 11167 Leland Groves Dr Riverview, FL | 5.0 | 3.0 | 2526 | $3,500 | $1.39 | 26d | 1 | 0.68mi |
| 10925 Subtle Trail Dr Riverview, FL | 3.0 | 2.0 | 1716 | $2,000 | $1.17 | 26d | 1 | 0.70mi |
| 11618 Ashton Field Ave Riverview, FL | 4.0 | 3.0 | 2114 | $2,400 | $1.14 | 1d | 1 | 0.75mi |
| 10805 Australian Pine Dr Riverview, FL | 3.0 | 2.0 | 1897 | $2,350 | $1.24 | 26d | 1 | 0.77mi |
| 14207 Poke Ridge Dr Riverview, FL | 3.0 | 2.5 | 1897 | $2,600 | $1.37 | 1d | 1 | 0.80mi |
| 14207 Poke Ridge Dr Riverview, FL | 3.0 | 3.0 | 1897 | $2,350 | $1.24 | 25d | 1 | 0.80mi |
| 11412 Misty Isle Ln Riverview, FL | 5.0 | 4.0 | 2523 | $3,200 | $1.27 | 26d | 1 | 0.80mi |
| 11424 Misty Isle Ln Riverview, FL | 3.0 | 2.0 | 1839 | $2,165 | $1.18 | 14d | 1 | 0.81mi |
| 14217 Poke Ridge Dr Riverview, FL | 3.0 | 2.5 | 1913 | $2,511 | $1.31 | 7d | 1 | 0.83mi |
| 11427 Misty Isle Ln Riverview, FL | 4.0 | 2.0 | 1916 | $2,310 | $1.21 | 7d | 1 | 0.84mi |
| 11328 Misty Isle Ln Riverview, FL | 4.0 | 3.5 | 2532 | $2,600 | $1.03 | 12d | 1 | 0.84mi |
| 14153 Arbor Pines Dr Riverview, FL | 5.0 | 2.5 | 2889 | $3,586 | $1.24 | 26d | 1 | 0.84mi |
| 13924 Arbor Pines Dr Riverview, FL | 4.0 | 2.5 | 1920 | $2,545 | $1.33 | 26d | 1 | 0.86mi |
| 10904 Summerton Dr Riverview, FL | 4.0 | 3.0 | 2977 | $3,150 | $1.06 | 5d | 1 | 0.91mi |
| 13130 Fennway Ridge Dr Riverview, FL | 4.0 | 2.5 | 1736 | $2,219 | $1.28 | 4d | 1 | 0.94mi |
| 13263 Evening Sunset Ln Riverview, FL | 4.0 | 2.0 | 1959 | $2,200 | $1.12 | 7d | 1 | 0.95mi |
| 11201 Hudson Hills Ln Riverview, FL | 5.0 | 2.5 | 2254 | $2,450 | $1.09 | 16d | 1 | 0.95mi |
| 11716 Navajo Sandstone St Riverview, FL | 4.0 | 2.5 | 2450 | $2,900 | $1.18 | 7d | 1 | 0.96mi |
| 13114 Fennway Ridge Dr Riverview, FL | 3.0 | 2.5 | 1556 | $2,225 | $1.43 | 0d | 1 | 1.00mi |
| 11322 Torrey Pines Dr Riverview, FL | 4.0 | 2.0 | 2194 | $2,300 | $1.05 | 26d | 1 | 1.01mi |
| 13016 Prestwick Dr Riverview, FL | 4.0 | 3.0 | 2506 | $3,500 | $1.40 | 26d | 1 | 1.03mi |
| 11121 Kempton Vista Dr Riverview, FL | 4.0 | 2.0 | 1983 | $2,350 | $1.19 | 26d | 1 | 1.07mi |
| 10614 Shady Branch Dr Riverview, FL | 4.0 | 2.5 | 2482 | $2,286 | $0.92 | 16d | 1 | 1.12mi |
| 12962 Fennway Ridge Dr Riverview, FL | 4.0 | 2.5 | 2098 | $2,950 | $1.41 | 26d | 1 | 1.14mi |
HOA detail
- Monthly dues
- $41 · $492/yr
- Likely covers
- waterlandscapingsecurity
Listing history 11 events
-
2026-06-21days on market $375,000 Active 101 DOM
-
2026-06-18days on market $375,000 Active 98 DOM
-
2026-06-17days on market $375,000 Active 97 DOM
-
2026-06-16days on market $375,000 Active 96 DOM
-
2026-06-15days on market $375,000 Active 95 DOM
-
2026-06-13days on market $375,000 Active 93 DOM
-
2026-06-13days on market $375,000 Active 92 DOM
-
2026-06-09days on market $375,000 Active 89 DOM
-
2026-06-08days on market $375,000 Active 88 DOM
-
2026-06-07remarks 693-char remark
-
2026-06-07$375,000 Active 87 DOM
ⓘ Source: listings_history table (triggers on properties + properties_extension) + one-shot
backfill from property_details.listing_events for pre-trigger history.
Tax reassessment forecast FL · Resets to sale price
- Current annual tax
- $2,938 · $245/mo
- Projected year-2 tax
- $3,112 · $259/mo
- Expected delta
- +$175/yr (+$15/mo · 6.0%)
ⓘ Screening estimate from a state-policy table — verify with the county assessor before closing.
Climate risk First Street
- Flood 1/10 Low FEMA zone X (unshaded) · 0% chance over 30 yrs
- Wildfire 3/10 Moderate
- Heat 10/10 Extreme 7 d/yr ≥109°F today · 29 d/yr by 30 yrs out
- Wind 9/10 Extreme 99% chance of damaging wind over 30 yrs
- Air quality 3/10 Moderate 3 unhealthy d/yr today · 3 by 30 yrs out
Nearby sold comps map
Loading sold comps map…
Walkable amenities ~0.75 mi
Loading nearby amenities…
Taxation est. · year 1
- Rental income
- $33,550
- − Mortgage interest
- −$21,006
- − Property taxes
- −$2,938
- − Insurance
- −$1,875
- − Repairs & maintenance
- −$2,684
- − Management
- −$2,684
- − HOA
- −$492
- − Depreciation
- −$10,909
- Taxable loss
- −$9,038
- Est. tax savings @ 24.0%
- +$2,169
- After-tax cash flow
- $-230/yr
For passive investors: Depreciation is non-cash, so a rental often shows a tax loss while cash-flowing — sheltering income. Rental losses are passive: they offset passive income freely, and up to $25,000/yr can offset ordinary (W-2) income if you actively participate and your MAGI is under $100k (phasing out to $0 by $150k); unused losses carry forward. On sale, claimed depreciation is recaptured at up to 25%, and gains may owe capital-gains tax (a 1031 exchange can defer both). Figures are a year-1 estimate at your 24.0% rate — not tax advice; consult a CPA.
Schools (NCES district)
- District
- Hillsborough
- NCES district ID
- 1200870
- Math proficiency
- 47% ▼ -8.00%
- Reading proficiency
- 50% ▼ -4.00%
- Median HH income
- $50,622
- Composite
- 41.6/100
- National rank
- #3435
- State rank
- #41 of 73 in FL
Livability — Riverview
- Score
- 79/100
- State rank
- #134
- US rank
- #2000
Category grades
Schools grade is shown separately in the Schools card above.
Census & demographics
- Census place
- Riverview, FL
- County
- Hillsborough County · 1,540,968 people
- City population
- 137,988
- Metro
- Tampa-St. Petersburg-Clearwater, FL
- Population (ZIP)
- 49,470
- Household income
- $116,134
- Rent vs Own
- Severe rent burden
- 258.0
Population outlook (Hillsborough County) Hauer SSP2
- Today (2025)
- 1,607,022 people
- By 2030
- 1,733,968 · +7.9%
- By 2040
- 1,979,565 · +23.2%
- By 2050
- 2,203,427 · +37.1%
- By 2075
- 2,667,893 · +66.0%
- By 2100
- 2,891,558 · +79.9%
Race, ethnicity, and origin ACS 2023
- Neighborhood character
- Highly diverse neighborhood (Simpson 0.71)
- Race & ethnicity
- White 42% Hispanic / Latino 25% Black 24% Two or more races 19% Asian 5%
- Hispanic origin (detail)
- Mexican 3% Puerto Rican 12% Cuban 3% Dominican 1%
- Common ancestry
- Hispanic 1% British 1% Romanian 1%
- Foreign-born
- 17% · Canada, Jamaica, China
- Languages at home
- 73% English-only · Spanish 19% Other Indo-European 2% French/Haitian/Cajun 1%
Political lean MEDSL · Hillsborough
- 2024 margin
- Toss-up / Even · D 47.8% · R 50.9% · Other 1.3%
- 2008→2024 swing
- -10.2pp toward R · 2008: 7.1pp · 2024: -3.1pp
- All cycles
- 2024: R+3.1 2020: D+6.9 2016: D+6.8 2012: D+6.7 2008: D+7.1
Not yet ingested
- Civics
- —
Market trends
- HPI YoY
- ▼ -1.42%
- Current HPI
- 240.5825
- Rent YoY
- ▲ 1.18%
- Metro
- Tampa-St. Petersburg-Clearwater, FL
- State GDP YoY
- ▲ 3.28%
- F500 in state
- 36
Industry mix (Fortune 500 HQ in FL)
| Industry | F500 HQs | Revenue |
|---|---|---|
| Industrial Technology | 2 | $29B |
|
||
| Insurance | 2 | $17B |
|
||
| Retail | 1 | $60B |
|
||
| Technology Distribution | 1 | $58B |
|
||
| Homebuilding | 1 | $35B |
|
||
| Technology Manufacturing | 1 | $35B |
|
||
Price history
-89.4% since first listed17 events — show timeline
- 2026-06-05 Relisted — Stellar MLS as Distributed by MLS Grid
- 2026-03-25 Price Changed $375,000 Stellar MLS as Distributed by MLS Grid
- 2026-03-05 Price Changed $379,900 Stellar MLS as Distributed by MLS Grid
- 2026-02-17 Price Changed $385,000 Stellar MLS as Distributed by MLS Grid
- 2026-01-09 Listed $400,000 Stellar MLS as Distributed by MLS Grid
- 2025-11-21 Sold (Public Records) $400,000 Public Records
- 2014-10-09 Sold (Public Records) $188,900 Public Records
- 2014-10-07 Sold (MLS) $188,900 Stellar MLS as Distributed by MLS Grid
- 2014-09-02 Pending — Stellar MLS as Distributed by MLS Grid
- 2014-08-01 Price Changed $188,900 Stellar MLS as Distributed by MLS Grid
- 2014-07-24 Price Changed $199,000 Stellar MLS as Distributed by MLS Grid
- 2014-07-23 Price Changed $199,900 Stellar MLS as Distributed by MLS Grid
- 2014-07-08 Listed $204,900 Stellar MLS as Distributed by MLS Grid
- 2010-05-10 Sold (MLS) $189,900 Stellar MLS as Distributed by MLS Grid
- 2009-12-17 Listed $189,900 Stellar MLS as Distributed by MLS Grid
- 2009-08-13 Sold (Public Records) $97,500 Public Records
- 2006-09-06 Sold (Public Records) $3,540,000 Public Records
Property tax history
-3.3%/yrLatest (2025): $2,938 · -47.3% YoY. Source: county tax records.
Cash-flow waterfall
monthlySold comps — $/sqft
last 12 mo · ≤1 miLoading sold comps…