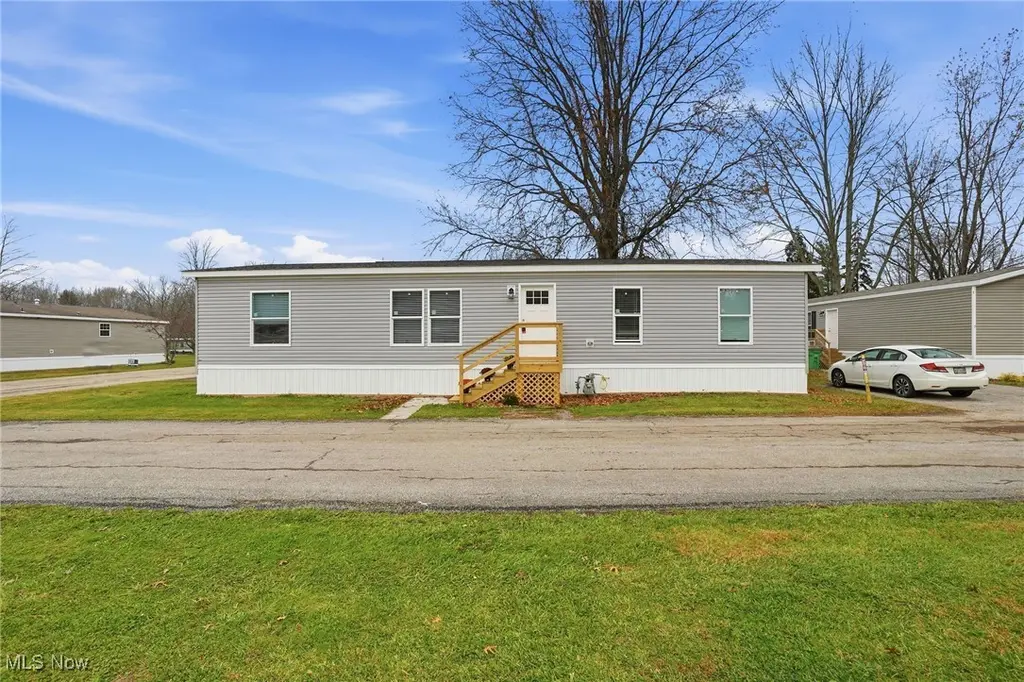
3583 Austin Rd #5 · Geneva, OH
Flood risk 4/10 · Minor
- FEMA flood zone
- X (unshaded)
- Chance of flooding over 30 yrs
- 0.24%
- Est. flood insurance / yr
- $473 – $860
Fire risk 1/10 · Minimal
- Est. fire insurance / yr
- $713 – $1,323
Heat risk 3/10 · Minor
- Hot days now (above 94°F)
- 7 days/yr
- Hot days in 30 yrs
- 18 days/yr
Wind risk 1/10 · Minimal
- Chance of severe wind over 30 yrs
- —
Air-quality risk 3/10 · Minor
- Unhealthy air days now
- 2 days/yr
- Unhealthy air days in 30 yrs
- 5 days/yr
Risk factors via First Street. Map © Google.
Why this score? — see what drove the C+ grade
The composite is a weighted blend of 9 inputs, each scored 0–100. Each bar is that input's sub-score; the figure is the points it added to the 100-point composite (weight × sub-score).
- Cash flow +30.0/30.0
- 1% rule +10.0/10.0
- DSCR +10.0/10.0
- Schools +4.7/10.0
- Condition / age +4.0/5.0
- Livability +3.7/5.0
- Rent growth +2.5/5.0
- ARV discount +0.0/15.0
- Appreciation +0.0/10.0
$99,600
🖨 Deal sheet (PDF) 📄 Offer letter ✓ Due diligence
Listing remarks MLS
Come look at this brand new, 2025 Skyline home ready for you to move in! Skyline Homes is recognized as one of America's most trusted manufactured and modular home builders. The stunning open-concept kitchen has ample room for creating memories while enjoying your meals. With an additional living room, there is ample space to entertain guests, or you could convert it to a bedroom. Austin Woods has undergone a complete transformation.
Key facts
- Parking
- Built 2025
- Listed 521 days
Neighborhood map
What this means for you Summary
Snapshot
- This is a 3-bed/2.0-bath single-family listed at $100k. Condition is rated good.
Deal economics
- At list price, monthly cash flow is $535 ($6k/yr) — positive.
- The deal already cash-flows at list — no discount required.
- Meets the 1% rule at list price ($2k rent vs $100k).
- Recommended offer: $88k (12.0% below list) — sets the bar for market timing.
- Cap rate 12.7% vs local median 4.5% in Geneva — top-decile yield for the area; either an underpriced asset or a hidden risk that comps aren't pricing in. Stress-test before assuming the spread holds.
Location & tenants
- Location reads 74/100 on livability (#291 in OH, #4,770 nationally) — a middle-class / working-renter tenant base. Strengths: cost of living A+, housing A+, health & safety A+; Watch: commute F, employment F.
- Geneva Area City (town): math 52% / reading 60% proficiency, ranked #362 of 656 in OH (top 55%) — acceptable for families but not a draw, mixed tenant base, ~2y average lease.
- Market conditions: 88 active listings in the ZIP; 1 comparable units currently listed for rent nearby; 155 units permitted in Ashtabula County in 2024 (0 in 5+ unit buildings).
- This rent runs 32% of the median local income ($58k/yr) — at the standard rent-burdened threshold; future hikes will face affordability resistance.
Forward outlook
- Local home prices are declining (-3.0%/yr); year-one equity from $689 of loan paydown is wiped out by about $3k of value loss. Plan a longer hold.
- Ashtabula County population projected at -22% by 2050 — secular population decline; favor cash flow + early exit over multi-decade hold.
- At projected returns (-3.0% appreciation + 3.0% rent growth), your $28k cash investment doubles in ~6 years — after that, you're playing with house money.
Negotiation context
- It's been on market 521 days — a 12% lower offer ($88k) is reasonable based on typical stale-listing flexibility.
Questions for the listing agent
- It's been on market 521 days. Have you received any prior offers? Is the seller open to a 12% concession, seller financing, or rate buy-down credit?
- Why hasn't it sold? Are there any deal-killer items the seller is aware of (foundation, flood, title, zoning, code violations)?
- Is there a deadline driving the sale (1031 exchange, divorce, estate, relocation)? That informs how much negotiation room exists.
- What's the average days-on-market for RENTAL listings here right now (not sales)? A rising rental-DOM trend means longer vacancies and softer asking-rent achievability than the comps imply.
- What's the recent tenant-quality profile in this submarket — average credit score on applications, eviction rate, late-payment / NSF rate, and stable-employment percentage? A property-management company in the area should have these aggregated.
- How much new for-sale + rental construction is in the pipeline within 1–3 miles? Heavy new supply typically softens prices + rents 12–24 months out; constrained supply supports both.
Investment metrics
- 1% rule
- 1.56% ✓
- Cap rate
- 12.74%
- Cash-on-cash
- 23.04%
- DSCR
- 2.03
- GRM
- 5.4
CMA / ARV
- ARV (median comp)
- $83,429
- List price
- $99,600
- Delta
- 19.38%
- Verdict
- OVERPRICED
- Comps
- 20 within 1.0 mi
Show comp detail 12 sales within ~0.75 mi
| Address | Dist | Beds/Ba | Sqft | Sold | Price | $/sf | Match |
|---|---|---|---|---|---|---|---|
| 3583 Austin #140 | 0.00mi | 3/2.0 | 1,493 (-1%) | 23mo | $101,304 | $68 | 78 |
| 3583 Austin Rd #24 | 0.00mi | 3/2.0 | 1,344 (-11%) | 4mo | $69,560 | $52 | 78 |
| 3583 Austin Rd #9 | 0.00mi | 4/2.0 (+1) | 1,568 (+4%) | 18mo | $77,750 | $50 | 74 |
| 3583 Austin Rd #97 | 0.00mi | 3/2.0 | 1,296 (-14%) | 13mo | $69,900 | $54 | 65 |
| 3410 North Broadway | 0.44mi | 3/2.0 | 1,636 (+8%) | 4mo | $235,000 | $144 | 62 |
| 3669 N Broadway | 0.29mi | 3/1.0 | 1,356 (-10%) | 5mo | $157,250 | $116 | 61 |
| 685 Millwood Dr | 0.70mi | 3/2.0 | 1,530 (+1%) | 10mo | $248,000 | $162 | 57 |
| 3906 Austin Rd | 0.54mi | 3/1.0 | 1,612 (+7%) | 6mo | $172,000 | $107 | 55 |
| 5314 W Maple Ave | 0.36mi | 3/2.0 | 1,688 (+12%) | 16mo | $259,999 | $154 | 51 |
| 760 Millwood Dr | 0.75mi | 3/2.0 | 1,415 (-6%) | 15mo | $230,000 | $163 | 42 |
| 4838 E Maple Rd | 0.62mi | 3/1.0 | 1,348 (-11%) | 14mo | $165,000 | $122 | 37 |
| 3808 N Broadway | 0.49mi | 3/3.0 | 1,730 (+14%) | 16mo | $392,500 | $227 | 36 |
Match score weights: distance 35% · size 25% · config 20% · recency 20%. Top-matched comps best support the ARV.
Projected returns pro-forma
-3.0% appreciation · 3.0% rent growth · sell at horizon
- IRR
- 16.0%
- Equity multiple
- 1.64×
- Total profit
- $17,984
- Equity at exit
- $14,851
- IRR
- 24.6%
- Equity multiple
- 3.14×
- Total profit
- $59,664
- Equity at exit
- $8,612
Cash invested: $27,888 (down + closing). Projections, not guarantees.
Landlord ↔ Tenant lean methodology
- Overall (STATE)
- 73 Landlord-Friendly
- State Ohio
- 73 Landlord-Friendly · R+6
- County
- — inherits STATE
- City
- — inherits STATE
ZIP-level market 44041
- Home prices YoY
- -31.3%
- Active inventory
- 88
- Price-to-rent
- 5.4×
Monthly cashflow live
- Estimated rent
- $1,549 medium interval (Pro) →
- Mortgage (P&I)
- −$522
- Tax est. 1.5%
- −$124 /mo · $1,494/yr
- Insurance
- −$42
- HOA
- −$0
- Vacancy / Maint / Mgmt
- −$325
- Net cashflow
- $535
Break-even live
Sensitivity live
| Price | -10% $604 | -5% $570 | +0% $535 | +5% $501 | +10% $467 |
|---|---|---|---|---|---|
| Rent | -10% $413 | -5% $474 | +0% $535 | +5% $597 | +10% $658 |
| Rate | -1.0pp $586 | -0.5pp $561 | base $535 | +0.5pp $510 | +1.0pp $483 |
UW: 25.0% down · 7.5% · 30yr · 1.5% tax · 5.0% vac · 8.0% maint · 8.0% mgmt
Financing live
Cash to close
- Down payment
- $24,900
- Closing costs
- $2,988
- Reserves months
- —
- Total cash needed
- —
Loan-product check · same deal, 3 products live
Conventional
25% down · 7.5% · 30yr
- Down + closing
- —
- Monthly P&I
- —
- Monthly cashflow
- —
- DSCR
- —
- Eligible?
- —
Personal DTI + credit; lowest rate.
DSCR
20% down · 8.5% · 30yr
- Down + closing
- —
- Monthly P&I
- —
- Monthly cashflow
- —
- DSCR
- —
- Eligible?
- —
No personal income docs; deal must DSCR.
Hard money
10% down · 12.0% · 12mo
- Down + closing
- —
- Monthly P&I
- —
- Monthly cashflow
- —
- DSCR
- —
- Eligible?
- —
Short-term bridge; refi at stabilization.
Rent comps 1 comps
| Address | Beds | Baths | Sqft | Rent | $/sqft | DOM | Units | Dist |
|---|---|---|---|---|---|---|---|---|
| 430 Garfield St Geneva, OH | 4.0 | 1.0 | 1248 | $1,549 | $1.24 | 45d | 1 | 1.41mi |
Listing history 17 events
-
2026-06-21days on market $99,600 Active 521 DOM
-
2026-06-18days on market $99,600 Active 519 DOM
-
2026-06-17days on market $99,600 Active 518 DOM
-
2026-06-16days on market $99,600 Active 517 DOM
-
2026-06-15days on market $99,600 Active 516 DOM
-
2026-06-13remarks 699-char remark
-
2026-06-13days on market $99,600 Active 514 DOM
-
2026-06-12pricedays on market $99,600 Active 513 DOM
-
2026-06-09days on market $114,210 Active 510 DOM
-
2026-06-08days on market $114,210 Active 509 DOM
-
2026-06-08days on market $114,210 Active 508 DOM
-
2026-06-07days on market $114,210 Active 507 DOM
-
2026-06-04days on market $114,210 Active 504 DOM
-
2026-06-02days on market $114,210 Active 503 DOM
-
2026-06-01days on market $114,210 Active 502 DOM
-
2026-05-31days on market $114,210 Active 501 DOM
-
2025-01-12$114,210 Active 437-char remark
Show marketing remark (437 chars)
Come look at this brand new, 2025 Skyline home ready for you to move in! Skyline Homes is recognized as one of America's most trusted manufactured and modular home builders. The stunning open-concept kitchen has ample room for creating memories while enjoying your meals. With an additional living room, there is ample space to entertain guests, or you could convert it to a bedroom. Austin Woods has undergone a complete transformation.
ⓘ Source: listings_history table (triggers on properties + properties_extension) + one-shot
backfill from property_details.listing_events for pre-trigger history.
Climate risk First Street
- Flood 4/10 Moderate FEMA zone X (unshaded) · 24% chance over 30 yrs
- Wildfire 1/10 Low
- Heat 3/10 Moderate 7 d/yr ≥94°F today · 18 d/yr by 30 yrs out
- Wind 1/10 Low
- Air quality 3/10 Moderate 2 unhealthy d/yr today · 5 by 30 yrs out
Nearby sold comps map
Loading sold comps map…
Walkable amenities ~0.75 mi
Loading nearby amenities…
Taxation est. · year 1
- Rental income
- $18,588
- − Mortgage interest
- −$5,579
- − Property taxes
- −$1,494
- − Insurance
- −$498
- − Repairs & maintenance
- −$1,487
- − Management
- −$1,487
- − Depreciation
- −$2,897
- Taxable income
- $5,145
- Est. tax owed @ 24.0%
- −$1,235
- After-tax cash flow
- $5,190/yr
For passive investors: Depreciation is non-cash, so a rental often shows a tax loss while cash-flowing — sheltering income. Rental losses are passive: they offset passive income freely, and up to $25,000/yr can offset ordinary (W-2) income if you actively participate and your MAGI is under $100k (phasing out to $0 by $150k); unused losses carry forward. On sale, claimed depreciation is recaptured at up to 25%, and gains may owe capital-gains tax (a 1031 exchange can defer both). Figures are a year-1 estimate at your 24.0% rate — not tax advice; consult a CPA.
Condition & rehab AI · 12 photos
This 2025 Skyline home is move-in ready with a good condition score and minimal repairs needed. It offers a good balance of modern features and a clean, well-maintained exterior. Potential buyers and renters will appreciate the open-concept kitchen and ample living space.
Value-add opportunities
- Both Painting the exterior and interior walls — Fresh paint can enhance curb appeal and interior aesthetics.
- Both Landscaping improvements — Enhanced landscaping can improve curb appeal and attract potential buyers/tenants.
- Both Adding a small shed or storage unit — Additional storage can be useful for both resale and rental purposes.
- Both Upgrading the kitchen appliances — Modern appliances can make the kitchen more appealing to potential buyers/tenants.
- Both Adding a small patio or outdoor seating area — An outdoor space can increase the home's appeal and functionality for both resale and rental purposes.
Renovation cost estimate screening
Value-add ROI direction
- Both Painting the exterior and interior walls — Fresh paint can enhance curb appeal and interior aesthetics. ↑
- Both Landscaping improvements — Enhanced landscaping can improve curb appeal and attract potential buyers/tenants. ↑
- Both Adding a small shed or storage unit — Additional storage can be useful for both resale and rental purposes. ↑
- Both Upgrading the kitchen appliances — Modern appliances can make the kitchen more appealing to potential buyers/tenants. ↑
- Both Adding a small patio or outdoor seating area — An outdoor space can increase the home's appeal and functionality for both resale and rental purposes. ↑
ⓘ Cost ranges are severity-bucket heuristics (US national rule-of-thumb). Get contractor quotes + a written scope before underwriting a rehab budget.
Schools (NCES district)
- District
- Geneva Area City
- NCES district ID
- 3904405
- Math proficiency
- 52% ▼ -16.00%
- Reading proficiency
- 60% ▼ -2.00%
- Median HH income
- $43,525
- Composite
- 47.12/100
- National rank
- #2328
- State rank
- #362 of 656 in OH
Livability — Geneva
- Score
- 74/100
- State rank
- #291
- US rank
- #4770
Category grades
Schools grade is shown separately in the Schools card above.
Census & demographics
- County
- Ashtabula · 97,617 people
- Metro
- Cleveland, OH
- Population (ZIP)
- 13,992
- Household income
- $58,438
- Rent vs Own
- Severe rent burden
- 12.5
Population outlook (Ashtabula County) Hauer SSP2
- Today (2025)
- 92,950 people
- By 2030
- 89,146 · -4.1%
- By 2040
- 80,715 · -13.2%
- By 2050
- 72,270 · -22.2%
- By 2075
- 55,780 · -40.0%
- By 2100
- 40,928 · -56.0%
Race, ethnicity, and origin ACS 2023
- Neighborhood character
- Predominantly White (85%)
- Race & ethnicity
- White 85% Hispanic / Latino 7% Two or more races 6% Black 4%
- Hispanic origin (detail)
- Mexican 1% Puerto Rican 4%
- Common ancestry
- Romanian 3% Slovak 2% Lithuanian 2%
- Foreign-born
- 1% · Canada
- Languages at home
- 96% English-only · Spanish 4%
Political lean MEDSL · Ashtabula
- 2024 margin
- Strong R (+28.4) · D 35.4% · R 63.8%
- 2008→2024 swing
- -41.9pp toward R · 2008: 13.5pp · 2024: -28.4pp
- All cycles
- 2024: R+28.4 2020: R+23.5 2016: R+19.0 2012: D+12.1 2008: D+13.5
Not yet ingested
- Civics
- —
Market trends
- HPI YoY
- ▼ -105.04%
- Current HPI
- 230.8747
- Rent YoY
- —
- Metro
- —
- State GDP YoY
- ▲ 1.98%
- F500 in state
- 48
Industry mix (Fortune 500 HQ in OH)
| Industry | F500 HQs | Revenue |
|---|---|---|
| Insurance | 3 | $145B |
|
||
| Industrial Machinery | 3 | $49B |
|
||
| Financial Services | 3 | $24B |
|
||
| Consumer Goods | 2 | $93B |
|
||
| Aerospace / Defense | 2 | $47B |
|
||
| Utilities | 2 | $33B |
|
||
Price history
1 event — show timeline
- 2025-01-12 Listed $114,210 MLSNOW
Cash-flow waterfall
monthlySold comps — $/sqft
last 12 mo · ≤1 miLoading sold comps…