 Multi-family
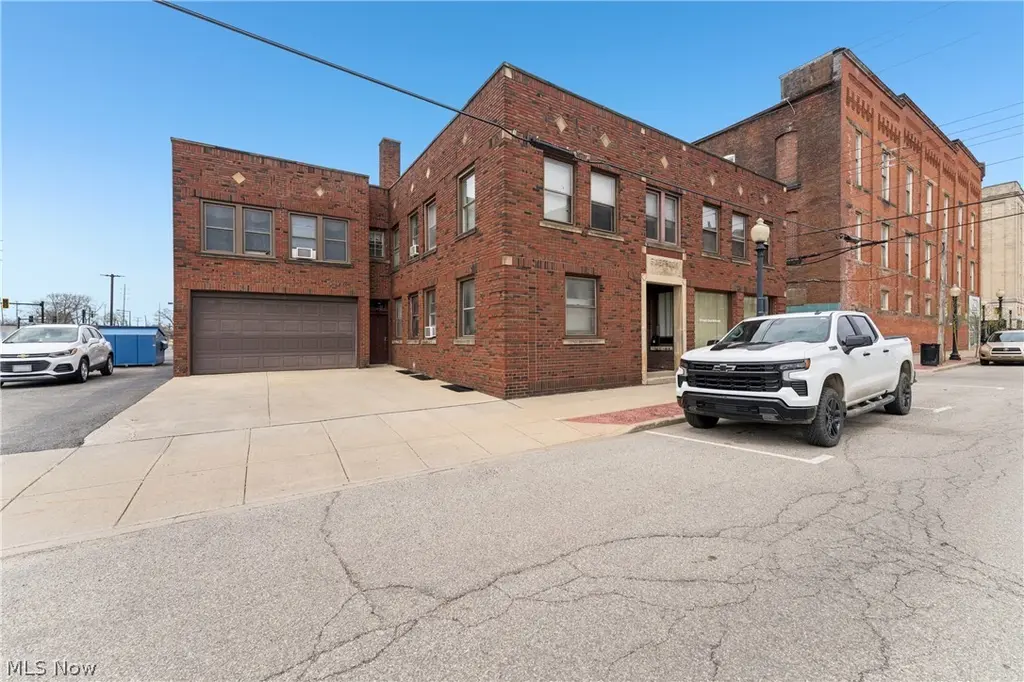
70 4th St NW · Barberton, OH
Flood risk No data
- FEMA flood zone
- —
- Chance of flooding over 30 yrs
- —
- Est. flood insurance / yr
- —
Fire risk No data
- Est. fire insurance / yr
- —
Heat risk No data
- Hot days now (above threshold)
- —
- Hot days in 30 yrs
- —
Wind risk No data
- Chance of severe wind over 30 yrs
- —
Air-quality risk No data
- Unhealthy air days now
- —
- Unhealthy air days in 30 yrs
- —
Risk factors via First Street. Map © Google.
Why this score? — see what drove the B grade
The composite is a weighted blend of 9 inputs, each scored 0–100. Each bar is that input's sub-score; the figure is the points it added to the 100-point composite (weight × sub-score).
- Cash flow +30.0/30.0
- 1% rule +10.0/10.0
- DSCR +10.0/10.0
- ARV discount +7.5/15.0
- Schools +4.1/10.0
- Rent growth +4.0/5.0
- Livability +3.6/5.0
- Condition / age +2.8/5.0
- Appreciation +0.0/10.0
$389,900
🖨 Deal sheet 📄 Offer letter ✓ Due diligence
Multi-family units
County records classify this as Multi-Family (2-4 Unit). Listing-text estimate: 1 unit. estimate disagrees with records
Listing remarks
Welcome to the former Barberton Herald Building—an iconic all-brick 2-story investment opportunity in the heart of downtown Barberton, located on the corner of 4th Street and Tuscarawas Ave. Built in 1927, this 7,415 sq ft property offers a unique blend of historic character and income-producing potential. The building features five apartments and commercial/retail space that currently generates $3,850 per month; the retail space was getting $1,100 a month (now vacant). Approximately 1,200 sq ft of retail/commercial space on the main level, a private office, and a restroom. The first floor also includes one residential unit, while the second level consists of four additional apartment
Key facts
- 6,721 sq ft lot
- 2 garage spots
- Built 1927
Property features AI
Finance
- Financial info: Gross income reported: $57,600; Unit rents reported: Apt. #1 $750, Apt. #2 $650, Apt. #3 $700, 1st Floor Unit $850; Owner pays cable TV, gas, sewer, trash collection, water; tenants pay electricity
- HOA & community: Public transportation access
Exterior
- Parking: Attached 2-car garage; Additional parking; On-street parking; Parking lot
- Utilities: Public water; Public sewer
- Home design: Brick building; 2 stories; Flat roof
- Construction: Brick construction
- Exterior features: Corner lot; City lot
Interior
- Kitchen: Range; Refrigerator
- Bedrooms: Multiple 1-bedroom apartment units (separate units listed as Apt. #1, Apt. #2, Apt. #3, 1st Floor Unit)
- Bathrooms: Five full bathrooms; Two half bathrooms
- Heating & cooling: Gas heating; Hot water heating; Steam heating
- Interior features: Entrance foyer; High ceilings; Storage; Natural woodwork; See remarks
- Laundry & utility: Laundry in basement
Neighborhood map
What this means for you Summary
Snapshot
- This is a 5-bed/6.0-bath multifamily listed at $390k. Condition is rated average.
Deal economics
- At list price, monthly cash flow is $3k ($32k/yr) — positive.
- The deal already cash-flows at list — no discount required.
- Meets the 1% rule at list price ($7k rent vs $390k).
- Recommended offer: $367k (6.0% below list) — sets the bar for market timing.
- Cap rate 14.5% vs local median 6.2% in Barberton — top-decile yield for the area; either an underpriced asset or a hidden risk that comps aren't pricing in. Stress-test before assuming the spread holds.
Location & tenants
- Location reads 71/100 on livability (#428 in OH) — a middle-class / working-renter tenant base. Strengths: cost of living A+, housing A+, health & safety A+; Watch: crime C-, amenities F, commute F.
- Barberton City (suburban): math 47% / reading 51% proficiency, ranked #466 of 656 in OH (top 71%) — families likely to look elsewhere, expect single-tenant / working-renter base with shorter leases; 62% free/reduced lunch — lower-income household profile, screen leases tightly.
- Market conditions: Rents rising fast (+5.9%/yr); 219 active listings in the ZIP; 1,114 units permitted in Summit County in 2024 (397 in 5+ unit buildings).
- At $6,780/mo this rent would consume 128% of the median local household income ($64k/yr) (locally 805% of renters already pay >50% of income on rent) — very limited rent-growth headroom before tenants either downsize or default.
Forward outlook
- Local home prices are declining (-3.0%/yr); year-one equity from $3k of loan paydown is wiped out by about $12k of value loss. Plan a longer hold.
- Summit County population projected to shrink 6% by 2050 — rents likely to lag national; underwrite the cash flow, not the appreciation.
- At projected returns (-3.0% appreciation + 5.9% rent growth), your $109k cash investment doubles in ~4 years — after that, you're playing with house money.
Negotiation context
- It's been on market 78 days — a 6% lower offer ($367k) is reasonable based on typical stale-listing flexibility.
- 2 sale attempts with the ask held roughly flat each time — persistent listings suggest the price (not the market) is what's stuck; bring a comps-based counter.
Risks & watch-outs
- Watch-outs: built in 1927 — expect roof / HVAC / electrical / plumbing capex.
Questions for the listing agent
- It's been on market 78 days. Have you received any prior offers? Is the seller open to a 6% concession, seller financing, or rate buy-down credit?
- Built in 1927 — when were the roof, HVAC, electrical panel, plumbing, and water heater last replaced?
- Why hasn't it sold? Are there any deal-killer items the seller is aware of (foundation, flood, title, zoning, code violations)?
- Is there a deadline driving the sale (1031 exchange, divorce, estate, relocation)? That informs how much negotiation room exists.
- What's the average days-on-market for RENTAL listings here right now (not sales)? A rising rental-DOM trend means longer vacancies and softer asking-rent achievability than the comps imply.
- What's the recent tenant-quality profile in this submarket — average credit score on applications, eviction rate, late-payment / NSF rate, and stable-employment percentage? A property-management company in the area should have these aggregated.
- How much new apartment / multifamily construction is in the pipeline within 1–3 miles? Heavy new supply (>2% of stock underway) typically softens rents 12–24 months out; light construction supports rent growth.
Investment metrics
- 1% rule
- 1.74% ✓
- Cap rate
- 14.48%
- Cash-on-cash
- 29.26%
- DSCR
- 2.30
- GRM
- 4.8
CMA / ARV
No comps found within radius.
Projected returns pro-forma
-3.0% appreciation · 5.86% rent growth · sell at horizon
- IRR
- 26.9%
- Equity multiple
- 2.16×
- Total profit
- $126,514
- Equity at exit
- $58,135
- IRR
- 36.2%
- Equity multiple
- 4.81×
- Total profit
- $416,201
- Equity at exit
- $33,711
Cash invested: $109,172 (down + closing). Projections, not guarantees.
Landlord ↔ Tenant lean methodology
- Overall (STATE)
- 73 Landlord-Friendly
- State Ohio
- 73 Landlord-Friendly · R+6
- County
- — inherits STATE
- City
- — inherits STATE
ZIP-level market 44203
- Rents YoY
- 5.9%
- Active inventory
- 219
- Price-to-rent
- 28.8×
Monthly cashflow live
- Estimated rent
- $6,780 high interval (Pro) →
- Mortgage (P&I)
- −$2,045
- Tax est. 1.5%
- −$487 /mo · $5,848/yr
- Insurance
- −$162
- HOA
- −$0
- Vacancy / Maint / Mgmt
- −$1,424
- Net cashflow
- $2,662
Break-even live
6-unit breakdown (identical units grouped — click to expand)
| Units | Beds | Baths | Est. rent |
|---|---|---|---|
| 6× units | 1 | 1 | $6,780 |
| #1 | 1 | 1 | $1,130 |
| #2 | 1 | 1 | $1,130 |
| #3 | 1 | 1 | $1,130 |
| #4 | 1 | 1 | $1,130 |
| #5 | 1 | 1 | $1,130 |
| #6 | 1 | 1 | $1,130 |
| Total (6 units) | $6,780 | ||
UW: 25.0% down · 7.5% · 30yr · 1.5% tax · 5.0% vac · 8.0% maint · 8.0% mgmt
Financing live
Cash to close
- Down payment
- $97,475
- Closing costs
- $11,697
- Reserves months
- —
- Total cash needed
- —
Loan-product check · same deal, 3 products live
Conventional
25% down · 7.5% · 30yr
- Down + closing
- —
- Monthly P&I
- —
- Monthly cashflow
- —
- DSCR
- —
- Eligible?
- —
Personal DTI + credit; lowest rate.
DSCR
20% down · 8.5% · 30yr
- Down + closing
- —
- Monthly P&I
- —
- Monthly cashflow
- —
- DSCR
- —
- Eligible?
- —
No personal income docs; deal must DSCR.
Hard money
10% down · 12.0% · 12mo
- Down + closing
- —
- Monthly P&I
- —
- Monthly cashflow
- —
- DSCR
- —
- Eligible?
- —
Short-term bridge; refi at stabilization.
Listing history 17 events
-
2026-06-18days on market $389,900 Active 78 DOM
-
2026-06-17days on market $389,900 Active 77 DOM
-
2026-06-16days on market $389,900 Active 76 DOM
-
2026-06-15days on market $389,900 Active 75 DOM
-
2026-06-14days on market $389,900 Active 73 DOM
-
2026-06-10days on market $389,900 Active 70 DOM
-
2026-06-09days on market $389,900 Active 69 DOM
-
2026-06-08days on market $389,900 Active 68 DOM
-
2026-06-07days on market $389,900 Active 67 DOM
-
2026-06-03days on market $389,900 Active 63 DOM
-
2026-06-02days on market $389,900 Active 62 DOM
-
2026-06-01days on market $389,900 Active 61 DOM
-
2026-05-31days on market $389,900 Active 60 DOM
-
2026-05-31days on market $389,900 Active 59 DOM
-
2026-05-23status Active
-
2026-04-10historical Contingent
-
2026-04-02$389,900 Active
ⓘ Source: listings_history table (triggers on properties + properties_extension) + one-shot
backfill from property_details.listing_events for pre-trigger history.
Nearby sold comps map
Loading sold comps map…
Walkable amenities ~0.75 mi
Loading nearby amenities…
Taxation est. · year 1
- Rental income
- $81,360
- − Mortgage interest
- −$21,840
- − Property taxes
- −$5,848
- − Insurance
- −$1,950
- − Repairs & maintenance
- −$6,509
- − Management
- −$6,509
- − Depreciation
- −$11,343
- Taxable income
- $27,361
- Est. tax owed @ 24.0%
- −$6,567
- After-tax cash flow
- $25,374/yr
For passive investors: Depreciation is non-cash, so a rental often shows a tax loss while cash-flowing — sheltering income. Rental losses are passive: they offset passive income freely, and up to $25,000/yr can offset ordinary (W-2) income if you actively participate and your MAGI is under $100k (phasing out to $0 by $150k); unused losses carry forward. On sale, claimed depreciation is recaptured at up to 25%, and gains may owe capital-gains tax (a 1031 exchange can defer both). Figures are a year-1 estimate at your 24.0% rate — not tax advice; consult a CPA.
Condition & rehab AI · 14 photos
This 2-story building in Barberton, Ohio, offers a unique blend of historic character and income-producing potential. While it has some structural and cosmetic issues, it has the potential to be a valuable investment with the right updates.
Repairs flagged
- Major Kitchen cabinets — Old cabinets and outdated countertops need to be replaced.
- Major Bathroom fixtures — Outdated fixtures and possibly outdated plumbing need to be replaced.
- Major Roof — The age of the building suggests it may need a new roof in the next 10 years.
- Major Paint — The entire building needs a fresh coat of paint.
Value-add opportunities
- Both Kitchen renovation — A new kitchen will increase both the resale and rental value of the property.
- Both Bathroom renovation — A new bathroom will increase both the resale and rental value of the property.
- Both Landscaping — Landscaping will improve the curb appeal and increase the property's value.
Renovation cost estimate screening
| Repair item | Severity | Est. cost |
|---|---|---|
| Kitchen cabinets · Old cabinets and outdated countertops need to be replaced. | Major | $15,000–50,000 |
| Bathroom fixtures · Outdated fixtures and possibly outdated plumbing need to be replaced. | Major | $15,000–50,000 |
| Roof · The age of the building suggests it may need a new roof in the next 10 years. | Major | $15,000–50,000 |
| Paint · The entire building needs a fresh coat of paint. | Major | $15,000–50,000 |
| Total estimated repair cost · 4 items | $60,000–200,000 |
Value-add ROI direction
- Both Kitchen renovation — A new kitchen will increase both the resale and rental value of the property. ↑
- Both Bathroom renovation — A new bathroom will increase both the resale and rental value of the property. ↑
- Both Landscaping — Landscaping will improve the curb appeal and increase the property's value. ↑
ⓘ Cost ranges are severity-bucket heuristics (US national rule-of-thumb). Get contractor quotes + a written scope before underwriting a rehab budget.
Schools (NCES district)
- District
- Barberton City
- NCES district ID
- 3904353
- Math proficiency
- 47% ▼ -9.00%
- Reading proficiency
- 51% ▼ -9.00%
- Median HH income
- $37,660
- Composite
- 40.77/100
- National rank
- #3646
- State rank
- #466 of 656 in OH
Livability — Barberton
- Score
- 71/100
- State rank
- #428
- US rank
- #7016
Category grades
Schools grade is shown separately in the Schools card above.
Census & demographics
- Census place
- Barberton, OH
- County
- Summit County · 440,783 people
- City population
- 38,701
- Metro
- Akron, OH
- Population (ZIP)
- 38,701
- Household income
- $63,759
- Rent vs Own
- Severe rent burden
- 805.0
Population outlook (Summit County) Hauer SSP2
- Today (2025)
- 546,583 people
- By 2030
- 544,028 · -0.5%
- By 2040
- 531,363 · -2.8%
- By 2050
- 514,923 · -5.8%
- By 2075
- 481,765 · -11.9%
- By 2100
- 432,265 · -20.9%
Race, ethnicity, and origin ACS 2023
- Neighborhood character
- Predominantly White (86%)
- Race & ethnicity
- White 86% Black 7% Two or more races 5% Hispanic / Latino 1%
- Common ancestry
- Romanian 3% Slovak 2% Italian 1%
- Foreign-born
- 2% · Canada
- Languages at home
- 97% English-only · Russian/Polish/Slavic 1% Spanish 1%
Political lean MEDSL · Summit
- 2024 margin
- Lean D (+7.0) · D 53.0% · R 46.0%
- 2008→2024 swing
- -9.6pp toward R · 2008: 16.6pp · 2024: 7.0pp
- All cycles
- 2024: D+7.0 2020: D+9.6 2016: D+8.2 2012: D+14.8 2008: D+16.6
Not yet ingested
- Civics
- —
Market trends
- HPI YoY
- ▼ -224.82%
- Current HPI
- 199.8143
- Rent YoY
- ▲ 5.86%
- Metro
- Akron, OH
- State GDP YoY
- ▲ 1.98%
- F500 in state
- 48
Industry mix (Fortune 500 HQ in OH)
| Industry | F500 HQs | Revenue |
|---|---|---|
| Insurance | 3 | $145B |
|
||
| Industrial Machinery | 3 | $49B |
|
||
| Financial Services | 3 | $24B |
|
||
| Consumer Goods | 2 | $93B |
|
||
| Aerospace / Defense | 2 | $47B |
|
||
| Utilities | 2 | $33B |
|
||
Price history
3 events — show timeline
- 2026-05-23 Relisted — MLSNOW
- 2026-04-10 Contingent — MLSNOW
- 2026-04-02 Listed $389,900 MLSNOW
Cash-flow waterfall
monthlySold comps — $/sqft
last 12 mo · ≤1 miLoading sold comps…