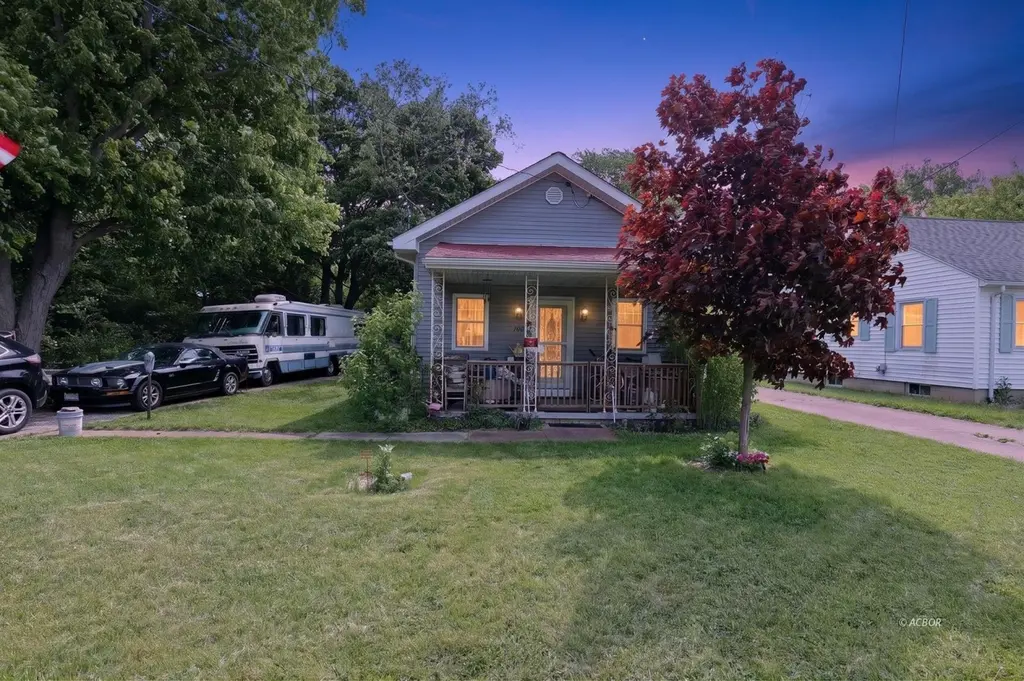
1704 Mills Street St · Sandusky, OH
Flood risk 4/10 · Minor
- FEMA flood zone
- X (unshaded)
- Chance of flooding over 30 yrs
- 0.22%
- Est. flood insurance / yr
- $473 – $860
Fire risk 1/10 · Minimal
- Est. fire insurance / yr
- $713 – $1,323
Heat risk 3/10 · Minor
- Hot days now (above 95°F)
- 7 days/yr
- Hot days in 30 yrs
- 16 days/yr
Wind risk 2/10 · Minimal
- Chance of severe wind over 30 yrs
- —
Air-quality risk 2/10 · Minimal
- Unhealthy air days now
- 1 days/yr
- Unhealthy air days in 30 yrs
- 2 days/yr
Risk factors via First Street. Map © Google.
Why this score? — see what drove the C grade
The composite is a weighted blend of 9 inputs, each scored 0–100. Each bar is that input's sub-score; the figure is the points it added to the 100-point composite (weight × sub-score).
- Cash flow +27.8/30.0
- DSCR +9.8/10.0
- 1% rule +6.9/10.0
- Livability +4.2/5.0
- Rent growth +2.5/5.0
- Schools +2.5/10.0
- Condition / age +2.5/5.0
- ARV discount +0.0/15.0
- Appreciation +0.0/10.0
$124,000
🖨 Deal sheet 📄 Offer letter ✓ Due diligence
Listing remarks
Charming single family home in the heart of Sandusky, full of potential and ready for its next owner. This 1955 two bedroom, one bath home offers 900 square feet of comfortable living space, a partial basement for storage, and both an enclosed and an open front porch to enjoy the seasons. A detached frame garage adds parking and workspace. Situated on a level lot in the established Mills School neighborhood, you are minutes from downtown Sandusky, Lake Erie, schools, and shopping. Bring your vision and make it your own. Investors and owner occupants alike will see the upside here. Property is being sold as is. Schedule your showing today, and see what this Sandusky gem has to offer.
Key facts
- Partial basement
- Level lot
- Open front porch
Tags
Property features AI
Exterior
- Parking: Detached 2-car garage
- Utilities: Public water; Public sewer; Natural gas available
- Home design: Single-family residence; One story
- Construction: Vinyl siding
- Exterior features: Asphalt shingle roof
Interior
- Bedrooms: Total of 4 rooms (bedrooms included)
- Bathrooms: 1 full bathroom
- Heating & cooling: Natural gas heating; Window air-conditioning units
- Interior features: Full, unfinished basement
Neighborhood map
What this means for you Summary
Snapshot
- This is a 2-bed/1.0-bath single-family listed at $124k.
Deal economics
- At list price, monthly cash flow is $378 ($5k/yr) — positive.
- The deal already cash-flows at list — no discount required.
- Meets the 1% rule at list price ($1k rent vs $124k).
- Cap rate 10.0% vs local median 5.4% in Sandusky — top-decile yield for the area; either an underpriced asset or a hidden risk that comps aren't pricing in. Stress-test before assuming the spread holds.
Location & tenants
- Location reads 83/100 on livability (#63 in OH, #929 nationally) — a professional / high-income tenant draw. Strengths: commute A+, cost of living A+, housing A+; Watch: crime D-, employment F.
- Sandusky City (town): math 24% / reading 37% proficiency, ranked #583 of 656 in OH (top 89%) — families likely to look elsewhere, expect single-tenant / working-renter base with shorter leases; 71% free/reduced lunch — lower-income household profile, screen leases tightly.
- Market conditions: 209 active listings in the ZIP; 2 comparable units currently listed for rent nearby; 128 units permitted in Erie County in 2024 (5 in 5+ unit buildings).
Forward outlook
- Local home prices are declining (-3.0%/yr); year-one equity from $857 of loan paydown is wiped out by about $4k of value loss. Plan a longer hold.
- Erie County population projected at -15% by 2050 — secular population decline; favor cash flow + early exit over multi-decade hold.
- At projected returns (-3.0% appreciation + 3.0% rent growth), your $35k cash investment doubles in ~9 years — after that, you're playing with house money.
Negotiation context
- Only 6 days on market — expect competitive offers; lowballing is unlikely to land.
- Current owner paid $35k; list at $124k implies a 254% gain — meaningful room to come down on a strong offer.
Risks & watch-outs
- Watch-outs: built in 1955 — expect roof / HVAC / electrical / plumbing capex.
Questions for the listing agent
- Built in 1955 — when were the roof, HVAC, electrical panel, plumbing, and water heater last replaced?
- Is there a deadline driving the sale (1031 exchange, divorce, estate, relocation)? That informs how much negotiation room exists.
- Crime grade is D in this area — have there been break-ins, vandalism, or insurance claims at this property in the last 3 years? What carrier currently insures it and at what premium?
- What's the average days-on-market for RENTAL listings here right now (not sales)? A rising rental-DOM trend means longer vacancies and softer asking-rent achievability than the comps imply.
- What's the recent tenant-quality profile in this submarket — average credit score on applications, eviction rate, late-payment / NSF rate, and stable-employment percentage? A property-management company in the area should have these aggregated.
- How much new for-sale + rental construction is in the pipeline within 1–3 miles? Heavy new supply typically softens prices + rents 12–24 months out; constrained supply supports both.
Investment metrics
- 1% rule
- 1.19% ✓
- Cap rate
- 9.95%
- Cash-on-cash
- 13.07%
- DSCR
- 1.58
- GRM
- 7.0
CMA / ARV
- ARV (on-the-fly)
- $105,300
- Comps found
- 12
Show comp detail 12 sales within ~0.75 mi
| Address | Dist | Beds/Ba | Sqft | Sold | Price | $/sf | Match |
|---|---|---|---|---|---|---|---|
| 1316 Harrison St | 0.32mi | 2/1.0 | 921 (+2%) | 1mo | $50,000 | $54 | 80 |
| 1535 Camp St | 0.36mi | 2/1.0 | 924 (+3%) | 1mo | $71,000 | $77 | 78 |
| 2023 W Forest Dr | 0.36mi | 3/1.0 (+1) | 925 (+3%) | 3mo | $107,000 | $116 | 71 |
| 2219 Karl Ann Dr | 0.46mi | 2/1.0 | 929 (+3%) | 4mo | $140,000 | $151 | 70 |
| 1826 Clay St | 0.25mi | 3/1.0 (+1) | 960 (+7%) | 4mo | $99,900 | $104 | 69 |
| 2145 W Forest Dr | 0.48mi | 3/1.0 (+1) | 912 (+1%) | 3mo | $97,000 | $106 | 68 |
| 2103 Putnam Street St | 0.37mi | 3/1.0 (+1) | 990 (+10%) | 1mo | $127,900 | $129 | 60 |
| 1214 W Osborne St | 0.49mi | 3/1.0 (+1) | 966 (+7%) | 0mo | $139,000 | $144 | 60 |
| 542 Camp St | 0.62mi | 3/1.0 (+1) | 932 (+4%) | 1mo | $109,000 | $117 | 59 |
| 1308 Vine St | 0.67mi | 2/1.0 | 847 (-6%) | 2mo | $109,900 | $130 | 57 |
| 611 Mills St | 0.46mi | 3/1.0 (+1) | 966 (+7%) | 10mo | $165,000 | $171 | 53 |
| 1309 Stone St | 0.60mi | 2/1.0 | 989 (+10%) | 5mo | $108,000 | $109 | 51 |
Match score weights: distance 35% · size 25% · config 20% · recency 20%. Top-matched comps best support the ARV.
Projected returns pro-forma
-3.0% appreciation · 3.0% rent growth · sell at horizon
- IRR
- 3.0%
- Equity multiple
- 1.11×
- Total profit
- $3,968
- Equity at exit
- $18,489
- IRR
- 12.5%
- Equity multiple
- 1.99×
- Total profit
- $34,376
- Equity at exit
- $10,721
Cash invested: $34,720 (down + closing). Projections, not guarantees.
Landlord ↔ Tenant lean methodology
- Overall (STATE)
- 73 Landlord-Friendly
- State Ohio
- 73 Landlord-Friendly · R+6
- County
- — inherits STATE
- City
- — inherits STATE
ZIP-level market 44870
- Active inventory
- 209
- Price-to-rent
- 7.0×
Monthly cashflow live
- Estimated rent
- $1,471 medium interval (Pro) →
- Mortgage (P&I)
- −$650
- Tax from tax record
- −$82 /mo · $988/yr
- Insurance
- −$52
- HOA
- −$0
- Vacancy / Maint / Mgmt
- −$309
- Net cashflow
- $378
Break-even live
UW: 25.0% down · 7.5% · 30yr · 1.5% tax · 5.0% vac · 8.0% maint · 8.0% mgmt
Financing live
Cash to close
- Down payment
- $31,000
- Closing costs
- $3,720
- Reserves months
- —
- Total cash needed
- —
Loan-product check · same deal, 3 products live
Conventional
25% down · 7.5% · 30yr
- Down + closing
- —
- Monthly P&I
- —
- Monthly cashflow
- —
- DSCR
- —
- Eligible?
- —
Personal DTI + credit; lowest rate.
DSCR
20% down · 8.5% · 30yr
- Down + closing
- —
- Monthly P&I
- —
- Monthly cashflow
- —
- DSCR
- —
- Eligible?
- —
No personal income docs; deal must DSCR.
Hard money
10% down · 12.0% · 12mo
- Down + closing
- —
- Monthly P&I
- —
- Monthly cashflow
- —
- DSCR
- —
- Eligible?
- —
Short-term bridge; refi at stabilization.
Rent comps 2 comps
| Address | Beds | Baths | Sqft | Rent | $/sqft | DOM | Units | Dist |
|---|---|---|---|---|---|---|---|---|
| 1515 W Perkins Ave Sandusky, OH | 2.0 | 1.0 | 925 | $925 | $1.00 | 43d | 1 | 0.59mi |
| 156 E Market St Sandusky, OH | 1.0–2.0 | 1.0–2.5 | 1266 | $3,539 | $2.79 | 43d | 5 | 1.36mi |
Listing history 8 events
-
2026-06-03days on market $124,000 Active 6 DOM
-
2026-06-02days on market $124,000 Active 5 DOM
-
2026-06-01days on market $124,000 Active 4 DOM
-
2026-05-31days on market $124,000 Active 3 DOM
-
2026-05-30days on market $124,000 Active 2 DOM
-
2026-05-28$124,000 Active
-
2002-03-20soldstatus $35,000
-
1993-05-28soldstatus $28,500
ⓘ Source: listings_history table (triggers on properties + properties_extension) + one-shot
backfill from property_details.listing_events for pre-trigger history.
Tax reassessment forecast OH · Partial reset (capped growth)
- Current annual tax
- $988 · $82/mo
- Projected year-2 tax
- $1,461 · $122/mo
- Expected delta
- +$473/yr (+$39/mo · 47.9%)
ⓘ Screening estimate from a state-policy table — verify with the county assessor before closing.
Climate risk First Street
- Flood 4/10 Moderate FEMA zone X (unshaded) · 22% chance over 30 yrs
- Wildfire 1/10 Low
- Heat 3/10 Moderate 7 d/yr ≥95°F today · 16 d/yr by 30 yrs out
- Wind 2/10 Low
- Air quality 2/10 Low 1 unhealthy d/yr today · 2 by 30 yrs out
Nearby sold comps map
Loading sold comps map…
Walkable amenities ~0.75 mi
Loading nearby amenities…
Taxation est. · year 1
- Rental income
- $17,656
- − Mortgage interest
- −$6,946
- − Property taxes
- −$988
- − Insurance
- −$620
- − Repairs & maintenance
- −$1,413
- − Management
- −$1,413
- − Depreciation
- −$3,607
- Taxable income
- $2,671
- Est. tax owed @ 24.0%
- −$641
- After-tax cash flow
- $3,897/yr
For passive investors: Depreciation is non-cash, so a rental often shows a tax loss while cash-flowing — sheltering income. Rental losses are passive: they offset passive income freely, and up to $25,000/yr can offset ordinary (W-2) income if you actively participate and your MAGI is under $100k (phasing out to $0 by $150k); unused losses carry forward. On sale, claimed depreciation is recaptured at up to 25%, and gains may owe capital-gains tax (a 1031 exchange can defer both). Figures are a year-1 estimate at your 24.0% rate — not tax advice; consult a CPA.
Schools (NCES district)
- District
- Sandusky City
- NCES district ID
- 3904474
- Math proficiency
- 24% ▼ -17.00%
- Reading proficiency
- 37% ▼ -9.00%
- Median HH income
- $34,583
- Composite
- 25.1/100
- National rank
- #7532
- State rank
- #583 of 656 in OH
Livability — Sandusky
- Score
- 83/100
- State rank
- #63
- US rank
- #929
Category grades
Schools grade is shown separately in the Schools card above.
Census & demographics
- Census place
- Sandusky, OH
- County
- Erie County · 39,883 people
- City population
- 39,883
- Metro
- Sandusky, OH
- Population (ZIP)
- 39,883
- Household income
- $62,082
- Rent vs Own
- Severe rent burden
- 1602.0
Population outlook (Erie County) Hauer SSP2
- Today (2025)
- 73,204 people
- By 2030
- 71,341 · -2.5%
- By 2040
- 66,771 · -8.8%
- By 2050
- 62,512 · -14.6%
- By 2075
- 56,154 · -23.3%
- By 2100
- 49,045 · -33.0%
Race, ethnicity, and origin ACS 2023
- Neighborhood character
- Predominantly White (72%)
- Race & ethnicity
- White 72% Black 15% Two or more races 8% Hispanic / Latino 5%
- Common ancestry
- Romanian 3% Slovak 2% Subsaharan African 1%
- Foreign-born
- 1% · Canada
- Languages at home
- 96% English-only · Spanish 2%
Political lean MEDSL · Erie
- 2024 margin
- R (+14.1) · D 42.5% · R 56.6%
- 2008→2024 swing
- -28.0pp toward R · 2008: 13.9pp · 2024: -14.1pp
- All cycles
- 2024: R+14.1 2020: R+11.6 2016: R+9.8 2012: D+11.3 2008: D+13.9
Not yet ingested
- Civics
- —
Market trends
- HPI YoY
- ▼ -151.99%
- Current HPI
- 209.6383
- Rent YoY
- —
- Metro
- Sandusky, OH
- State GDP YoY
- ▲ 1.98%
- F500 in state
- 48
Industry mix (Fortune 500 HQ in OH)
| Industry | F500 HQs | Revenue |
|---|---|---|
| Insurance | 3 | $145B |
|
||
| Industrial Machinery | 3 | $49B |
|
||
| Financial Services | 3 | $24B |
|
||
| Consumer Goods | 2 | $93B |
|
||
| Aerospace / Defense | 2 | $47B |
|
||
| Utilities | 2 | $33B |
|
||
Price history
+335.1% since first listed3 events — show timeline
- 2026-05-28 Listed $124,000 ACBOR
- 2002-03-20 Sold (Public Records) $35,000 Public Records
- 1993-05-28 Sold (Public Records) $28,500 Public Records
Property tax history
-0.5%/yrLatest (2025): $988 · -3.2% YoY. Source: county tax records.
Cash-flow waterfall
monthlySold comps — $/sqft
last 12 mo · ≤1 miLoading sold comps…