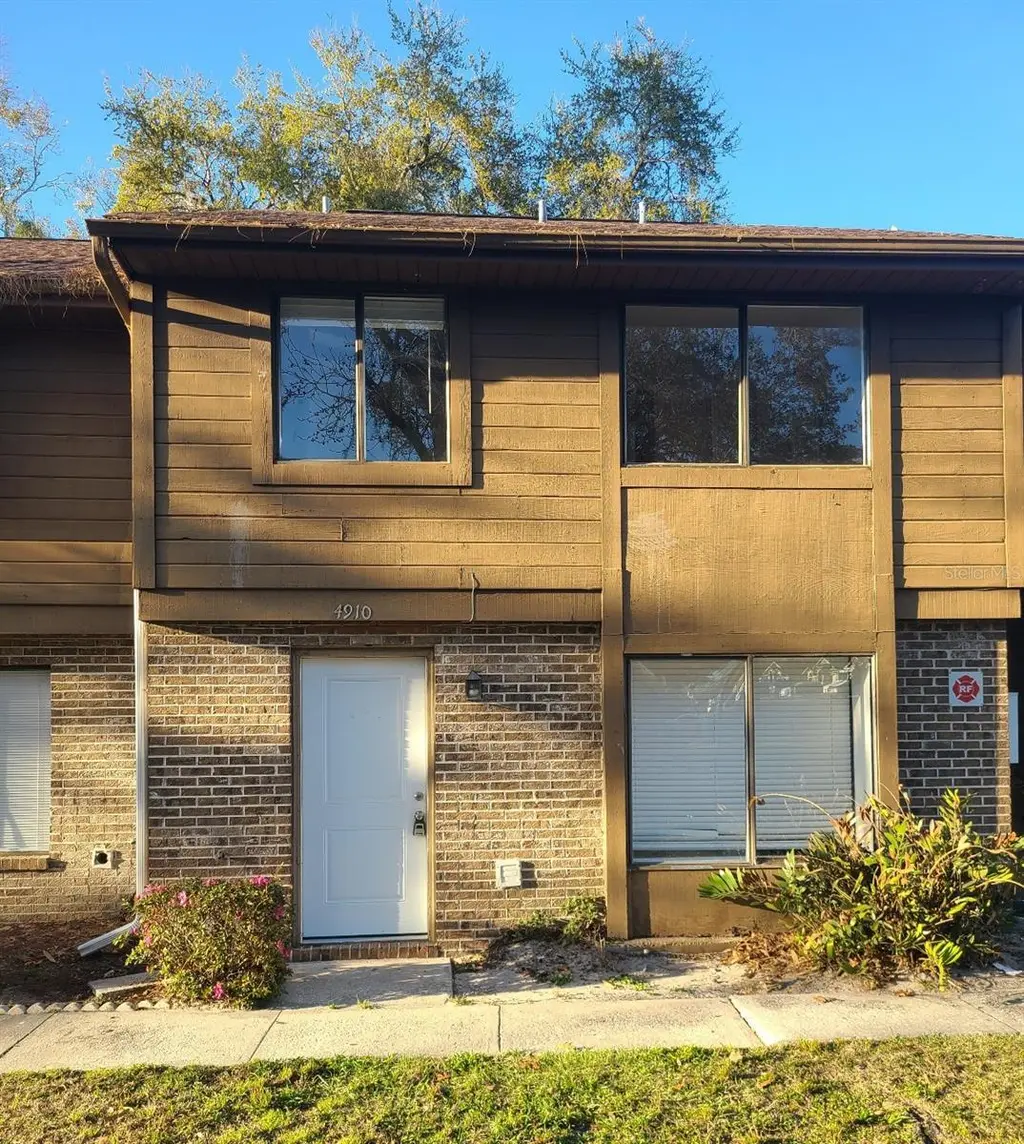
4910 Silver Oaks Vlg Unit B · Orlando, FL
Flood risk No data
- FEMA flood zone
- —
- Chance of flooding over 30 yrs
- —
- Est. flood insurance / yr
- —
Fire risk No data
- Est. fire insurance / yr
- —
Heat risk No data
- Hot days now (above threshold)
- —
- Hot days in 30 yrs
- —
Wind risk No data
- Chance of severe wind over 30 yrs
- —
Air-quality risk No data
- Unhealthy air days now
- —
- Unhealthy air days in 30 yrs
- —
Risk factors via First Street. Map © Google.
Why this score? — see what drove the C grade
The composite is a weighted blend of 9 inputs, each scored 0–100. Each bar is that input's sub-score; the figure is the points it added to the 100-point composite (weight × sub-score).
- Cash flow +20.7/30.0
- 1% rule +8.7/10.0
- ARV discount +7.5/15.0
- DSCR +6.6/10.0
- Livability +4.3/5.0
- Schools +4.1/10.0
- Condition / age +2.5/5.0
- Rent growth +2.4/5.0
- Appreciation +0.0/10.0
$135,000
🖨 Deal sheet 📄 Offer letter ✓ Due diligence
Listing remarks
* * * * Investor or Homeowner * * * * Perfect complex for rental or to live in. Don't hesitate to see!!! 3 bedroom, 2 bathroom two story condo in the heart of Orlando with a fire place. This condominium is conveniently located close to downtown Orlando, major highways and all Theme Parks like Universal & Disney.
Key facts
- Fire place
- Two story
- Theme parks
Tags
Property features AI
Finance
- Other: Total living area reported as 1,260 (per public records); Lot about 0.13 acre (0 to less than 1/4 acre)
- Financial info: Lease restrictions apply
- HOA & community: Monthly condo fee of $353 (association required); Association covers structure and grounds maintenance; Pets allowed (max ~35 lbs); Association name: Natasha Staples/Towers Property Management; Association fee paid monthly
Exterior
- Parking: No parking details provided
- Security: Association approval required
- Utilities: Public water; Public sewer; Electricity connected; Water connected; Sewer connected; Cable available
- Home design: Residential condominium; Two-story building; Unit located on the 2nd floor; Facing west
- Construction: Block and wood siding construction; Shingle roof; Slab foundation; Built as part of Building B
- Exterior features: Paved road access; Deed restrictions; Sidewalks
Interior
- Kitchen: Dishwasher; Range; Refrigerator; Electric water heater
- Bedrooms: 3 bedrooms
- Flooring: Ceramic tile
- Bathrooms: 2 full bathrooms
- Heating & cooling: Central heating (electric); Central air conditioning
- Interior features: Ceiling fans
- Laundry & utility: No laundry in unit
Neighborhood map
What this means for you Summary
Snapshot
- This is a 3-bed/2.0-bath condo listed at $135k.
Deal economics
- At list price, monthly cash flow is $182 ($2k/yr) — positive.
- The deal already cash-flows at list — no discount required.
- Meets the 1% rule at list price ($2k rent vs $135k).
- Recommended offer: $127k (6.0% below list) — sets the bar for market timing.
- Cap rate 7.9% vs local median 3.0% in Orlando — top-decile yield for the area; either an underpriced asset or a hidden risk that comps aren't pricing in. Stress-test before assuming the spread holds.
Location & tenants
- Location reads 86/100 on livability (#12 in FL, #360 nationally) — a professional / high-income tenant draw. Strengths: amenities A+, commute A+, housing A+.
- Orange (suburban): math 46% / reading 51% proficiency, ranked #43 of 73 in FL (top 59%) — families likely to look elsewhere, expect single-tenant / working-renter base with shorter leases.
- Market conditions: Rents soft (-0.3%/yr); 246 active listings in the ZIP; 40 comparable units currently listed for rent nearby; rentals at typical pace (median 22d on market — plan ~3-4 weeks tenant-placement turnaround); 8,053 units permitted in Orange County in 2024 (3,133 in 5+ unit buildings).
- This rent runs 45% of the median local income ($50k/yr) — at the standard rent-burdened threshold; future hikes will face affordability resistance.
Forward outlook
- Local home prices are declining (-3.0%/yr); year-one equity from $933 of loan paydown is wiped out by about $4k of value loss. Plan a longer hold.
- Orange County population projected at +52% by 2050 — long-run rental-demand tailwind backs the buy-and-hold thesis.
Negotiation context
- It's been on market 89 days — a 6% lower offer ($127k) is reasonable based on typical stale-listing flexibility.
- Current owner paid $26k; list at $135k implies a 429% gain — meaningful room to come down on a strong offer.
Questions for the listing agent
- It's been on market 89 days. Have you received any prior offers? Is the seller open to a 6% concession, seller financing, or rate buy-down credit?
- What does the HOA fee cover, when was the last increase, and are there any pending special assessments or reserve-fund shortfalls?
- Any open or pending special assessments — roof, HVAC, plumbing, elevator, façade? What's the per-unit balance and payoff schedule, and is the seller paying it off at close or rolling it to the buyer?
- Why hasn't it sold? Are there any deal-killer items the seller is aware of (foundation, flood, title, zoning, code violations)?
- Is there a deadline driving the sale (1031 exchange, divorce, estate, relocation)? That informs how much negotiation room exists.
- Schools are B-rated — typically a magnet for longer-tenancy family renters. What's the average tenant stay here, and is there a school-zone premium baked into asking?
- What's the average days-on-market for RENTAL listings here right now (not sales)? A rising rental-DOM trend means longer vacancies and softer asking-rent achievability than the comps imply.
- What's the recent tenant-quality profile in this submarket — average credit score on applications, eviction rate, late-payment / NSF rate, and stable-employment percentage? A property-management company in the area should have these aggregated.
- How much new apartment / multifamily construction is in the pipeline within 1–3 miles? Heavy new supply (>2% of stock underway) typically softens rents 12–24 months out; light construction supports rent growth.
Investment metrics
- 1% rule
- 1.37% ✓
- Cap rate
- 7.91%
- Cash-on-cash
- 5.78%
- DSCR
- 1.26
- GRM
- 6.1
CMA / ARV
No comps found within radius.
Projected returns pro-forma
-3.0% appreciation · 0.0% rent growth · sell at horizon
- IRR
- -11.7%
- Equity multiple
- 0.59×
- Total profit
- $-15,456
- Equity at exit
- $20,129
- IRR
- -9.7%
- Equity multiple
- 0.51×
- Total profit
- $-18,499
- Equity at exit
- $11,672
Cash invested: $37,800 (down + closing). Projections, not guarantees.
Landlord ↔ Tenant lean methodology
- Overall (STATE)
- 87 Strongly Landlord-Friendly
- State Florida
- 87 Strongly Landlord-Friendly · R+3
- County
- — inherits STATE
- City
- — inherits STATE
ZIP-level market 32808
- Home prices YoY
- -22.6%
- Rents YoY
- -0.3%
- Active inventory
- 246
- Price-to-rent
- 6.1×
Monthly cashflow live
- Estimated rent
- $1,850 high interval (Pro) →
- Mortgage (P&I)
- −$708
- Tax from tax record
- −$163 /mo · $1,950/yr
- Insurance
- −$56
- HOA
- −$353
- Vacancy / Maint / Mgmt
- −$389
- Net cashflow
- $182
Break-even live
UW: 25.0% down · 7.5% · 30yr · 1.5% tax · 5.0% vac · 8.0% maint · 8.0% mgmt
Financing live
Cash to close
- Down payment
- $33,750
- Closing costs
- $4,050
- Reserves months
- —
- Total cash needed
- —
Loan-product check · same deal, 3 products live
Conventional
25% down · 7.5% · 30yr
- Down + closing
- —
- Monthly P&I
- —
- Monthly cashflow
- —
- DSCR
- —
- Eligible?
- —
Personal DTI + credit; lowest rate.
DSCR
20% down · 8.5% · 30yr
- Down + closing
- —
- Monthly P&I
- —
- Monthly cashflow
- —
- DSCR
- —
- Eligible?
- —
No personal income docs; deal must DSCR.
Hard money
10% down · 12.0% · 12mo
- Down + closing
- —
- Monthly P&I
- —
- Monthly cashflow
- —
- DSCR
- —
- Eligible?
- —
Short-term bridge; refi at stabilization.
Rent comps 40 comps
| Address | Beds | Baths | Sqft | Rent | $/sqft | DOM | Units | Dist |
|---|---|---|---|---|---|---|---|---|
| 4918 Silver Oaks Village Unit F Orlando, FL | 3.0 | 3.0 | 1260 | $1,750 | $1.39 | 23d | 1 | 0.02mi |
| 4966 Sanoma Village Unit D Orlando, FL | 3.0 | 1.5 | 1252 | $1,650 | $1.32 | 7d | 1 | 0.05mi |
| 4974 Sanoma Vlg Orlando, FL | 3.0 | 2.0 | 1182 | $1,699 | $1.44 | 14d | 1 | 0.05mi |
| 4907 Lake Ridge Rd Orlando, FL | 2.0 | 2.0 | 947 | $1,475 | $1.56 | 23d | 1 | 0.07mi |
| 4758 Muir Village Orlando, FL | 3.0 | 2.0 | 1097 | $2,063 | $1.88 | 14d | 1 | 0.16mi |
| 4825 Lighthouse Cir #4825 Orlando, FL | 2.0 | 1.5 | 1169 | $1,800 | $1.54 | 23d | 1 | 0.16mi |
| 5061 Barnegat Point Rd Orlando, FL | 4.0 | 2.0 | 1712 | $2,400 | $1.40 | 21d | 1 | 0.18mi |
| 4793 N Pine Hills Rd Orlando, FL | 2.0 | 2.0 | 890 | $1,554 | $1.75 | 2d | 1 | 0.21mi |
| 4793 N Pine Hills Rd Unit 41-101 Pine Hills, FL | 3.0 | 2.0 | 1019 | $1,649 | $1.62 | 7d | 1 | 0.21mi |
| 4793 N Pine Hills Rd Orlando, FL | 2.0–3.0 | 2.0 | 954 | $1,754 | $1.84 | 16d | 56 | 0.21mi |
| 4587 Lighthouse Cir Orlando, FL | 2.0 | 2.0 | 1210 | $1,525 | $1.26 | 21d | 1 | 0.23mi |
| 4603 Lighthouse Cir Orlando, FL | 2.0 | 2.5 | 1177 | $1,550 | $1.32 | 21d | 1 | 0.27mi |
| 4620 Lighthouse Cir Orlando, FL | 2.0 | 1.5 | 1328 | $1,475 | $1.11 | 21d | 1 | 0.29mi |
| 4638 Lighthouse Cir Unit 1 Orlando, FL | 2.0 | 2.5 | 1330 | $1,500 | $1.13 | 23d | 1 | 0.31mi |
| 4901 Bottlebrush Ln Orlando, FL | 1.0–2.0 | 1.0–2.0 | 833 | $1,775 | $2.13 | 1d | 17 | 0.53mi |
| 4501 Landing Dr Orlando, FL | 1.0–2.0 | 1.0–2.0 | 787 | $1,417 | $1.80 | 2d | 18 | 0.54mi |
| 4751 Beacon St Orlando, FL | 4.0 | 2.0 | 1624 | $2,500 | $1.54 | 7d | 1 | 0.64mi |
| 5224 Long Rd Orlando, FL | 2.0–4.0 | 1.5–2.5 | 1426 | $1,754 | $1.23 | 2d | 17 | 0.70mi |
| 5410 Old Oak Tree Dr Orlando, FL | 3.0 | 2.0 | 1627 | $2,100 | $1.29 | 20d | 1 | 0.71mi |
| 4093 Shannon Brown Dr Orlando, FL | 2.0 | 2.5 | 1272 | $1,800 | $1.42 | 3d | 1 | 0.75mi |
| 3903 Pine Ridge Rd Orlando, FL | 4.0 | 1.5 | 1450 | $1,949 | $1.34 | 23d | 1 | 0.87mi |
| 4176 Versailles Dr Unit D Orlando, FL | 2.0 | 2.0 | 1165 | $1,350 | $1.16 | 23d | 1 | 0.93mi |
| 4414 Cluster Dr #4414 Orlando, FL | 2.0 | 2.5 | 1444 | $1,800 | $1.25 | 23d | 1 | 0.94mi |
| 4170 Versailles Dr Orlando, FL | 2.0 | 2.0 | 1165 | $1,199 | $1.03 | 23d | 1 | 0.94mi |
| 4160 Versailles Dr Unit 4160D Orlando, FL | 2.0 | 2.0 | 1165 | $1,450 | $1.24 | 23d | 1 | 0.94mi |
| 4437 Cluster Dr Orlando, FL | 3.0 | 3.0 | 1518 | $2,495 | $1.64 | 23d | 1 | 0.94mi |
| 4114 Dijon Dr Unit 4114E Orlando, FL | 2.0 | 2.0 | 1165 | $1,400 | $1.20 | 23d | 1 | 0.99mi |
| 4106 Dijon Dr Unit 4106E Orlando, FL | 2.0 | 2.0 | 1165 | $1,395 | $1.20 | 23d | 1 | 0.99mi |
| 5300 Cinderlane Pkwy Orlando, FL | 1.0–2.0 | 1.0–2.0 | 824 | $1,880 | $2.28 | 2d | 2 | 1.00mi |
| 5175 Cinderlane Pkwy Orlando, FL | 1.0–2.0 | 1.0–2.0 | 751 | $1,565 | $2.08 | 2d | 27 | 1.03mi |
| 4022 Versailles Dr Unit C Orlando, FL | 2.0 | 2.0 | 1165 | $1,350 | $1.16 | 17d | 1 | 1.05mi |
| 4023 Versailles Dr Unit 4023F Orlando, FL | 3.0 | 2.0 | 1348 | $1,750 | $1.30 | 14d | 1 | 1.05mi |
| 5536 Cinderlane Pkwy Orlando, FL | 1.0–2.0 | 1.5–2.0 | 1077 | $1,699 | $1.58 | 1d | 7 | 1.05mi |
| 4006 Luan Dr Orlando, FL | 3.0 | 2.0 | 1717 | $2,095 | $1.22 | 23d | 1 | 1.09mi |
| 5419 Stirrup Way Orlando, FL | 3.0 | 2.0 | 1420 | $2,000 | $1.41 | 23d | 1 | 1.09mi |
| 3979 Versailles Dr Orlando, FL | 2.0 | 2.0 | 1183 | $1,450 | $1.23 | 23d | 1 | 1.09mi |
| 5249 Champagne Cir Orlando, FL | 2.0 | 2.0 | 980 | $1,795 | $1.83 | 23d | 1 | 1.12mi |
| 4358 South Lake Orlando Pkwy Unit 3-3 Orlando, FL | 2.0 | 2.0 | 1089 | $1,800 | $1.65 | 7d | 1 | 1.16mi |
| 4148 Player Cir #106 Orlando, FL | 4.0 | 3.0 | 1634 | $2,350 | $1.44 | 23d | 1 | 1.22mi |
| 5717 Fernhill Dr Orlando, FL | 3.0 | 1.0 | 1619 | $1,700 | $1.05 | 3d | 1 | 1.27mi |
HOA detail condo
- Monthly dues
- $353 · $4,236/yr
- Assessments
- None detected in remarks — confirm with the listing agent.
Listing history 20 events
-
2026-06-18days on market $135,000 Active 89 DOM
-
2026-06-17days on market $135,000 Active 88 DOM
-
2026-06-16days on market $135,000 Active 87 DOM
-
2026-06-15days on market $135,000 Active 86 DOM
-
2026-06-13days on market $135,000 Active 84 DOM
-
2026-06-13days on market $135,000 Active 83 DOM
-
2026-06-09days on market $135,000 Active 80 DOM
-
2026-06-08days on market $135,000 Active 79 DOM
-
2026-06-07days on market $135,000 Active 78 DOM
-
2026-06-04days on market $135,000 Active 75 DOM
-
2026-06-03days on market $135,000 Active 74 DOM
-
2026-06-02days on market $135,000 Active 73 DOM
-
2026-06-02days on market $135,000 Active 72 DOM
-
2026-05-31days on market $135,000 Active 71 DOM
-
2026-05-05price $135,000
-
2026-03-21$140,000 Active
-
2013-03-07soldstatus $25,500
-
2005-08-10soldstatus $110,300
-
2001-07-23soldstatus $63,000
-
1998-08-19soldstatus $56,700
ⓘ Source: listings_history table (triggers on properties + properties_extension) + one-shot
backfill from property_details.listing_events for pre-trigger history.
Tax reassessment forecast FL · Resets to sale price
- Current annual tax
- $1,950 · $163/mo
- Projected year-2 tax
- $1,950 · $163/mo
- Expected delta
- $0/yr ($0/mo · 0.0%)
ⓘ Screening estimate from a state-policy table — verify with the county assessor before closing.
Nearby sold comps map
Loading sold comps map…
Walkable amenities ~0.75 mi
Loading nearby amenities…
Taxation est. · year 1
- Rental income
- $22,206
- − Mortgage interest
- −$7,562
- − Property taxes
- −$1,950
- − Insurance
- −$675
- − Repairs & maintenance
- −$1,776
- − Management
- −$1,776
- − HOA
- −$4,236
- − Depreciation
- −$3,927
- Taxable income
- $302
- Est. tax owed @ 24.0%
- −$73
- After-tax cash flow
- $2,113/yr
For passive investors: Depreciation is non-cash, so a rental often shows a tax loss while cash-flowing — sheltering income. Rental losses are passive: they offset passive income freely, and up to $25,000/yr can offset ordinary (W-2) income if you actively participate and your MAGI is under $100k (phasing out to $0 by $150k); unused losses carry forward. On sale, claimed depreciation is recaptured at up to 25%, and gains may owe capital-gains tax (a 1031 exchange can defer both). Figures are a year-1 estimate at your 24.0% rate — not tax advice; consult a CPA.
Schools (NCES district)
- District
- Orange
- NCES district ID
- 1201440
- Math proficiency
- 46% ▼ -9.00%
- Reading proficiency
- 51% ▼ -2.00%
- Median HH income
- $49,350
- Composite
- 41.47/100
- National rank
- #3461
- State rank
- #43 of 73 in FL
Livability — Orlando
- Score
- 86/100
- State rank
- #12
- US rank
- #360
Category grades
Schools grade is shown separately in the Schools card above.
Census & demographics
- Census place
- Orlando, FL
- County
- Orange County · 1,471,359 people
- City population
- 964,969
- Metro
- Orlando-Kissimmee-Sanford, FL
- Population (ZIP)
- 60,203
- Household income
- $49,700
- Rent vs Own
- Severe rent burden
- 4039.0
Population outlook (Orange County) Hauer SSP2
- Today (2025)
- 1,618,226 people
- By 2030
- 1,787,404 · +10.5%
- By 2040
- 2,125,621 · +31.4%
- By 2050
- 2,454,016 · +51.6%
- By 2075
- 3,173,711 · +96.1%
- By 2100
- 3,607,781 · +122.9%
Race, ethnicity, and origin ACS 2023
- Neighborhood character
- Predominantly Black (71%)
- Race & ethnicity
- Black 71% Hispanic / Latino 13% White 10% Two or more races 7% Asian 1%
- Hispanic origin (detail)
- Mexican 2% Puerto Rican 5% Dominican 2%
- Common ancestry
- Hispanic 20% Lithuanian 1% Scandinavian 0%
- Foreign-born
- 25% · Canada, Vietnam, Jamaica
- Languages at home
- 69% English-only · French/Haitian/Cajun 18% Spanish 11% Other Indo-European 1%
Political lean MEDSL · Orange
- 2024 margin
- D (+13.6) · D 56.1% · R 42.5% · Other 1.3%
- 2008→2024 swing
- -5.0pp toward R · 2008: 18.6pp · 2024: 13.6pp
- All cycles
- 2024: D+13.6 2020: D+23.1 2016: D+24.6 2012: D+18.2 2008: D+18.6
Not yet ingested
- Civics
- —
Market trends
- HPI YoY
- ▼ -110.15%
- Current HPI
- 376.3801
- Rent YoY
- ▼ -0.27%
- Metro
- Orlando-Kissimmee-Sanford, FL
- State GDP YoY
- ▲ 3.28%
- F500 in state
- 36
Industry mix (Fortune 500 HQ in FL)
| Industry | F500 HQs | Revenue |
|---|---|---|
| Industrial Technology | 2 | $29B |
|
||
| Insurance | 2 | $17B |
|
||
| Retail | 1 | $60B |
|
||
| Technology Distribution | 1 | $58B |
|
||
| Homebuilding | 1 | $35B |
|
||
| Technology Manufacturing | 1 | $35B |
|
||
Price history
+138.1% since first listed6 events — show timeline
- 2026-05-05 Price Changed $135,000 Stellar MLS as Distributed by MLS Grid
- 2026-03-21 Listed $140,000 Stellar MLS as Distributed by MLS Grid
- 2013-03-07 Sold (Public Records) $25,500 Public Records
- 2005-08-10 Sold (Public Records) $110,300 Public Records
- 2001-07-23 Sold (Public Records) $63,000 Public Records
- 1998-08-19 Sold (Public Records) $56,700 Public Records
Property tax history
+8.8%/yrLatest (2025): $1,950 · +24.1% YoY. Source: county tax records.
Cash-flow waterfall
monthlySold comps — $/sqft
last 12 mo · ≤1 miLoading sold comps…