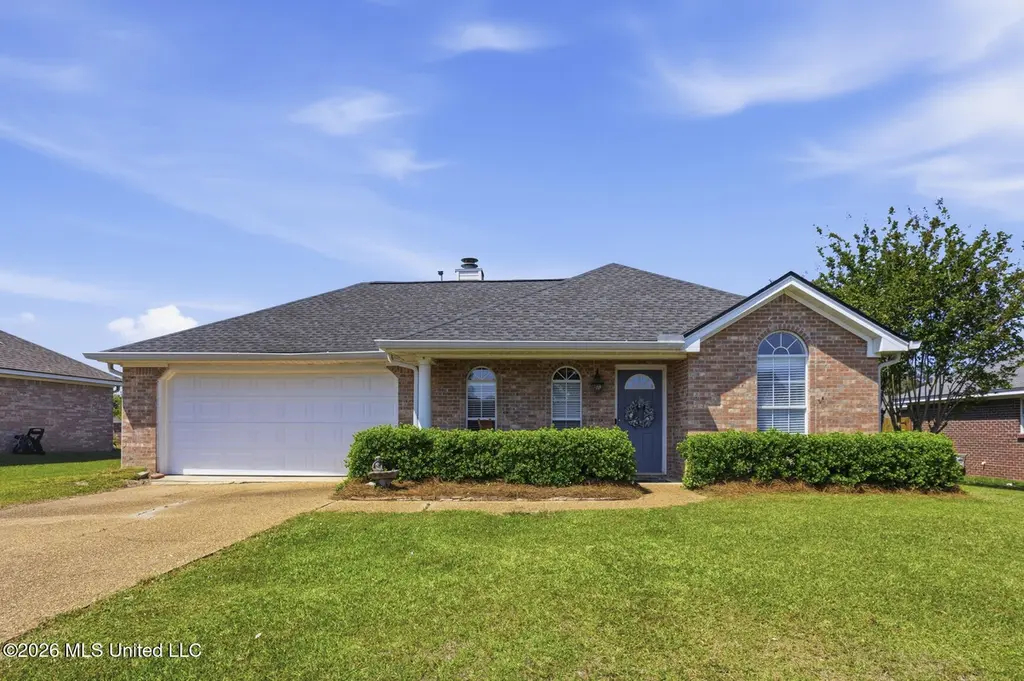
204 White Oak Pl · Pearl, MS
Flood risk 1/10 · Minimal
- FEMA flood zone
- X (unshaded)
- Chance of flooding over 30 yrs
- 0.0%
- Est. flood insurance / yr
- $507 – $1,088
Fire risk 3/10 · Minor
- Est. fire insurance / yr
- $1,241 – $2,305
Heat risk 8/10 · Major
- Hot days now (above 109°F)
- 7 days/yr
- Hot days in 30 yrs
- 21 days/yr
Wind risk 8/10 · Major
- Chance of severe wind over 30 yrs
- 80.0%
Air-quality risk 2/10 · Minimal
- Unhealthy air days now
- 0 days/yr
- Unhealthy air days in 30 yrs
- 1 days/yr
Risk factors via First Street. Map © Google.
Why this score? — see what drove the D grade
The composite is a weighted blend of 9 inputs, each scored 0–100. Each bar is that input's sub-score; the figure is the points it added to the 100-point composite (weight × sub-score).
- Cash flow +10.3/30.0
- ARV discount +10.0/15.0
- Schools +4.6/10.0
- Rent growth +4.1/5.0
- Livability +3.7/5.0
- 1% rule +3.2/10.0
- DSCR +3.0/10.0
- Condition / age +2.5/5.0
- Appreciation +0.0/10.0
$228,000
🖨 Deal sheet (PDF) 📄 Offer letter ✓ Due diligence
Listing remarks
Move-in ready and full of charm, this 3-bedroom, 2-bath home at 204 White Oak Place offers comfortable living in a well-designed 1,300 square feet. The layout makes great use of space with a functional flow between the living, kitchen, and dining areas, ideal for both everyday living and entertaining. The primary suite includes a private bath, while the additional bedrooms offer flexibility for family, guests, or a home office. A great opportunity for first time homeowners, a buyer looking to downsize, or investors. This property is a solid addition to a rental portfolio with its manageable size and broad appeal.
Key facts
- 9,583 sq ft lot
- 2 garage spots
- Built 2002
Property features AI
Finance
- HOA & community: Homeowners association with $240 annual fee covering grounds maintenance and management; Community clubhouse
Exterior
- Parking: Attached 2-car garage; Driveway with concrete surface
- Utilities: Public water; Public sewer; Other utilities
- Home design: Single-family house; One level; Owner-provided living area
- Construction: Brick construction; Asphalt shingle roof; Slab foundation; Built (year from assessor)
- Exterior features: Patio; Back yard with wood fencing; Other exterior features
Interior
- Kitchen: Cooktop; Microwave; Free-standing refrigerator
- Flooring: Luxury vinyl; Tile
- Bathrooms: 2 full bathrooms
- Heating & cooling: Central heating; Fireplace heating; Central air conditioning; Ceiling fans
- Interior features: Tray ceilings; Vaulted ceilings; Fireplace in living room; Patio access
- Laundry & utility: Indoor laundry room
Neighborhood map
What this means for you Summary
Snapshot
- This is a 3-bed/1.0-bath single-family listed at $228k.
Deal economics
- At list price, monthly cash flow is $-123 ($-1k/yr) — negative.
- To cash-flow at today's rent, offer at most $210k (7.8% below list).
- To meet the 1% rule (rent ≥ 1% of price), the offer needs to be $186k (18.3% below list).
- Recommended offer: $186k (18.3% below list) — sets the bar for 1% rule.
Location & tenants
- Location reads 73/100 on livability (#19 in MS) — a middle-class / working-renter tenant base. Strengths: cost of living A+, housing A+, health & safety A+; Watch: amenities F, commute F, employment D-.
- Rankin County School District (rural): math 56% / reading 48% proficiency, ranked #6 of 130 in MS (top 5%) — acceptable for families but not a draw, mixed tenant base, ~2y average lease.
- Zoned schools: Rouse Elementary (797 students, 100% FRL); Brandon Middle School (math 67% / reading 49%, grade B, #11 of 179 statewide, top 6%, 1,193 students, 100% FRL); Brandon High School (math 47% / reading 49%, grade D, #27 of 197 statewide, top 13%, 1,648 students, 100% FRL) — zoned schools average 100% FRL vs 35% district-wide (65 pts higher); higher-poverty schools than district average — tighter screening recommended.
- Market conditions: Rents rising fast (+6.3%/yr); 277 active listings in the ZIP; 2 comparable units currently listed for rent nearby; 343 units permitted in Rankin County in 2024 (0 in 5+ unit buildings).
- This rent runs 34% of the median local income ($65k/yr) — at the standard rent-burdened threshold; future hikes will face affordability resistance.
Forward outlook
- Local home prices are declining (-3.0%/yr); year-one equity from $2k of loan paydown is wiped out by about $7k of value loss. Plan a longer hold.
- Rankin County population projected at +17% by 2050 — long-run rental-demand tailwind backs the buy-and-hold thesis.
Negotiation context
- It's been on market 54 days — a 3% lower offer ($221k) is reasonable based on typical stale-listing flexibility.
Risks & watch-outs
- Climate carrying-cost: severe wind risk, 80% chance of damaging wind over 30y; extreme-heat days projected 7→21/yr by 2055 (HVAC capex compounding) — expect insurance premiums to compound above CPI over the hold.
Questions for the listing agent
- What do current leases actually rent for vs. the listed asking? Can we see a recent rent roll and the last 12 months of T-12 income?
- It's been on market 54 days. Have you received any prior offers? Is the seller open to a 18% concession, seller financing, or rate buy-down credit?
- What does the HOA fee cover, when was the last increase, and are there any pending special assessments or reserve-fund shortfalls?
- Is there a deadline driving the sale (1031 exchange, divorce, estate, relocation)? That informs how much negotiation room exists.
- Schools are D-rated, which usually means shorter tenancies and higher turnover. Who's the typical renter profile here, and what's been the actual vacancy rate?
- The area grade is low — what's the realistic commute time and amenity access for the typical tenant pool here? Any planned neighborhood developments (good or bad) we should know about?
- What's the average days-on-market for RENTAL listings here right now (not sales)? A rising rental-DOM trend means longer vacancies and softer asking-rent achievability than the comps imply.
- What's the recent tenant-quality profile in this submarket — average credit score on applications, eviction rate, late-payment / NSF rate, and stable-employment percentage? A property-management company in the area should have these aggregated.
- How much new for-sale + rental construction is in the pipeline within 1–3 miles? Heavy new supply typically softens prices + rents 12–24 months out; constrained supply supports both.
Investment metrics
- 1% rule
- 0.82% ✗
- Cap rate
- 5.64%
- Cash-on-cash
- -2.32%
- DSCR
- 0.90
- GRM
- 10.2
CMA / ARV
- ARV (median comp)
- $241,150
- List price
- $228,000
- Delta
- -5.45%
- Verdict
- FAIR
- Comps
- 20 within 1.0 mi
Show comp detail 12 sales within ~0.75 mi
| Address | Dist | Beds/Ba | Sqft | Sold | Price | $/sf | Match |
|---|---|---|---|---|---|---|---|
| 217 White Oak Pl | 0.09mi | 3/2.0 | 1,312 (+1%) | 5mo | $232,000 | $177 | 86 |
| 577 Oak Ridge Way | 0.04mi | 3/2.0 | 1,350 (+4%) | 2mo | $240,000 | $178 | 86 |
| 336 Willow Run | 0.12mi | 3/2.0 | 1,343 (+3%) | 0mo | $219,900 | $164 | 85 |
| 220 White Oak Pl | 0.11mi | 3/2.0 | 1,410 (+8%) | 1mo | $242,300 | $172 | 76 |
| 1108 Spanish Oak Dr | 0.28mi | 3/2.0 | 1,356 (+4%) | 2mo | $235,000 | $173 | 74 |
| 408 Oak Lawn Dr | 0.11mi | 3/2.0 | 1,394 (+7%) | 9mo | $243,000 | $174 | 71 |
| 628 Oak Ridge Way | 0.32mi | 3/2.0 | 1,364 (+5%) | 3mo | $249,900 | $183 | 70 |
| 106 Ash Ridge Pl | 0.34mi | 3/2.0 | 1,386 (+7%) | 3mo | $249,900 | $180 | 66 |
| 589 Oak Ridge Way | 0.12mi | 3/2.0 | 1,458 (+12%) | 6mo | $255,000 | $175 | 65 |
| 131 Beechwood Cir | 0.44mi | 3/2.0 | 1,347 (+4%) | 6mo | $222,999 | $166 | 64 |
| 119 Beechwood Cir | 0.43mi | 3/2.0 | 1,373 (+6%) | 6mo | $229,900 | $167 | 62 |
| 907 Oakwood Cv | 0.39mi | 3/2.0 | 1,387 (+7%) | 7mo | $240,000 | $173 | 61 |
Match score weights: distance 35% · size 25% · config 20% · recency 20%. Top-matched comps best support the ARV.
Projected returns pro-forma
-3.0% appreciation · 6.34% rent growth · sell at horizon
- IRR
- -16.4%
- Equity multiple
- 0.40×
- Total profit
- $-38,289
- Equity at exit
- $33,996
- IRR
- -3.0%
- Equity multiple
- 0.77×
- Total profit
- $-14,844
- Equity at exit
- $19,713
Cash invested: $63,840 (down + closing). Projections, not guarantees.
Landlord ↔ Tenant lean methodology
- Overall (STATE)
- 90 Strongly Landlord-Friendly
- State Mississippi
- 90 Strongly Landlord-Friendly · R+11
- County
- — inherits STATE
- City
- — inherits STATE
ZIP-level market 39208
- Home prices YoY
- -20.3%
- Rents YoY
- 6.3%
- Active inventory
- 277
- Price-to-rent
- 10.2×
Monthly cashflow live
- Estimated rent
- $1,864 medium interval (Pro) →
- Mortgage (P&I)
- −$1,196
- Tax est. 1.5%
- −$285 /mo · $3,420/yr
- Insurance
- −$95
- HOA
- −$20
- Vacancy / Maint / Mgmt
- −$391
- Net cashflow
- $-123
Break-even live
Sensitivity live
| Price | -10% $34 | -5% $-45 | +0% $-123 | +5% $-202 | +10% $-281 |
|---|---|---|---|---|---|
| Rent | -10% $-271 | -5% $-197 | +0% $-123 | +5% $-50 | +10% $24 |
| Rate | -1.0pp $-9 | -0.5pp $-65 | base $-123 | +0.5pp $-182 | +1.0pp $-243 |
UW: 25.0% down · 7.5% · 30yr · 1.5% tax · 5.0% vac · 8.0% maint · 8.0% mgmt
Financing live
Cash to close
- Down payment
- $57,000
- Closing costs
- $6,840
- Reserves months
- —
- Total cash needed
- —
Loan-product check · same deal, 3 products live
Conventional
25% down · 7.5% · 30yr
- Down + closing
- —
- Monthly P&I
- —
- Monthly cashflow
- —
- DSCR
- —
- Eligible?
- —
Personal DTI + credit; lowest rate.
DSCR
20% down · 8.5% · 30yr
- Down + closing
- —
- Monthly P&I
- —
- Monthly cashflow
- —
- DSCR
- —
- Eligible?
- —
No personal income docs; deal must DSCR.
Hard money
10% down · 12.0% · 12mo
- Down + closing
- —
- Monthly P&I
- —
- Monthly cashflow
- —
- DSCR
- —
- Eligible?
- —
Short-term bridge; refi at stabilization.
Rent comps 2 comps
| Address | Beds | Baths | Sqft | Rent | $/sqft | DOM | Units | Dist |
|---|---|---|---|---|---|---|---|---|
| 102 Red Oak Cv Pearl, MS | 3.0 | 2.0 | 1414 | $2,031 | $1.44 | 15d | 1 | 0.19mi |
| 103 Cedar Ridge Blvd Pearl, MS | 3.0 | 2.0 | 1792 | $1,000 | $0.56 | 23d | 1 | 0.81mi |
HOA detail
- Monthly dues
- $20 · $240/yr
Listing history 18 events
-
2026-06-22days on market $228,000 Active 54 DOM
-
2026-06-18days on market $228,000 Active 51 DOM
-
2026-06-17days on market $228,000 Active 50 DOM
-
2026-06-16pricedays on market $228,000 Active 49 DOM
-
2026-06-15days on market $230,000 Active 48 DOM
-
2026-06-14days on market $230,000 Active 46 DOM
-
2026-06-13days on market $230,000 Active 45 DOM
-
2026-06-10days on market $230,000 Active 43 DOM
-
2026-06-09days on market $230,000 Active 42 DOM
-
2026-06-08days on market $230,000 Active 41 DOM
-
2026-06-07days on market $230,000 Active 40 DOM
-
2026-06-03days on market $230,000 Active 36 DOM
-
2026-06-02pricedays on market $230,000 Active 35 DOM
-
2026-06-01days on market $234,900 Active 34 DOM
-
2026-05-31days on market $234,900 Active 33 DOM
-
2026-05-30days on market $234,900 Active 32 DOM
-
2026-05-13price $234,900 620-char remark
-
2026-04-28$237,000 Active 620-char remark
ⓘ Source: listings_history table (triggers on properties + properties_extension) + one-shot
backfill from property_details.listing_events for pre-trigger history.
Climate risk First Street
- Flood 1/10 Low FEMA zone X (unshaded) · 0% chance over 30 yrs
- Wildfire 3/10 Moderate
- Heat 8/10 Severe 7 d/yr ≥109°F today · 21 d/yr by 30 yrs out
- Wind 8/10 Severe 80% chance of damaging wind over 30 yrs
- Air quality 2/10 Low 0 unhealthy d/yr today · 1 by 30 yrs out
Nearby sold comps map
Loading sold comps map…
Walkable amenities ~0.75 mi
Loading nearby amenities…
Taxation est. · year 1
- Rental income
- $22,364
- − Mortgage interest
- −$12,772
- − Property taxes
- −$3,420
- − Insurance
- −$1,140
- − Repairs & maintenance
- −$1,789
- − Management
- −$1,789
- − HOA
- −$240
- − Depreciation
- −$6,633
- Taxable loss
- −$5,418
- Est. tax savings @ 24.0%
- +$1,300
- After-tax cash flow
- $-180/yr
For passive investors: Depreciation is non-cash, so a rental often shows a tax loss while cash-flowing — sheltering income. Rental losses are passive: they offset passive income freely, and up to $25,000/yr can offset ordinary (W-2) income if you actively participate and your MAGI is under $100k (phasing out to $0 by $150k); unused losses carry forward. On sale, claimed depreciation is recaptured at up to 25%, and gains may owe capital-gains tax (a 1031 exchange can defer both). Figures are a year-1 estimate at your 24.0% rate — not tax advice; consult a CPA.
Schools (NCES district)
- District
- Rankin County School District
- NCES district ID
- 2803830
- Math proficiency
- 56% ▼ -4.00%
- Reading proficiency
- 48% ▼ -6.00%
- Median HH income
- $61,867
- Composite
- 45.62/100
- National rank
- #2587
- State rank
- #6 of 130 in MS
Livability — Pearl
- Score
- 73/100
- State rank
- #19
- US rank
- #5662
Category grades
Schools grade is shown separately in the Schools card above.
Census & demographics
- County
- Rankin County · 123,614 people
- City population
- 34,442
- Metro
- Jackson, MS
- Population (ZIP)
- 34,442
- Household income
- $65,480
- Rent vs Own
- Severe rent burden
- 1235.0
Population outlook (Rankin County) Hauer SSP2
- Today (2025)
- 164,317 people
- By 2030
- 171,013 · +4.1%
- By 2040
- 182,723 · +11.2%
- By 2050
- 192,376 · +17.1%
- By 2075
- 209,535 · +27.5%
- By 2100
- 209,534 · +27.5%
Race, ethnicity, and origin ACS 2023
- Neighborhood character
- Majority White (60%)
- Race & ethnicity
- White 60% Black 31% Hispanic / Latino 5% Two or more races 3% Asian 2%
- Common ancestry
- Italian 5% Slovak 1% Serbian 1%
- Foreign-born
- 3% · Canada, China
- Languages at home
- 93% English-only · Spanish 4% Other Indo-European 1% Other Asian/Pacific 1%
Political lean MEDSL · Rankin
- 2024 margin
- Solid R (+47.1) · D 25.9% · R 73.0% · Other 1.0%
- 2008→2024 swing
- +6.4pp toward D · 2008: -53.5pp · 2024: -47.1pp
- All cycles
- 2024: R+47.1 2020: R+45.4 2016: R+52.9 2012: R+51.9 2008: R+53.5
Not yet ingested
- Civics
- —
Market trends
- HPI YoY
- ▼ -49.11%
- Current HPI
- 193.0609
- Rent YoY
- ▲ 6.34%
- Metro
- Jackson, MS
- State GDP YoY
- —
- F500 in state
- 0
Price history
-3.8% since first listed4 events — show timeline
- 2026-06-16 Price Changed $228,000 MLSU
- 2026-06-01 Price Changed $230,000 MLSU
- 2026-05-13 Price Changed $234,900 MLSU
- 2026-04-28 Listed $237,000 MLSU
Property tax history
-5.6%/yrLatest (2025): $356 · +1.9% YoY. Source: county tax records.
Cash-flow waterfall
monthlySold comps — $/sqft
last 12 mo · ≤1 miLoading sold comps…