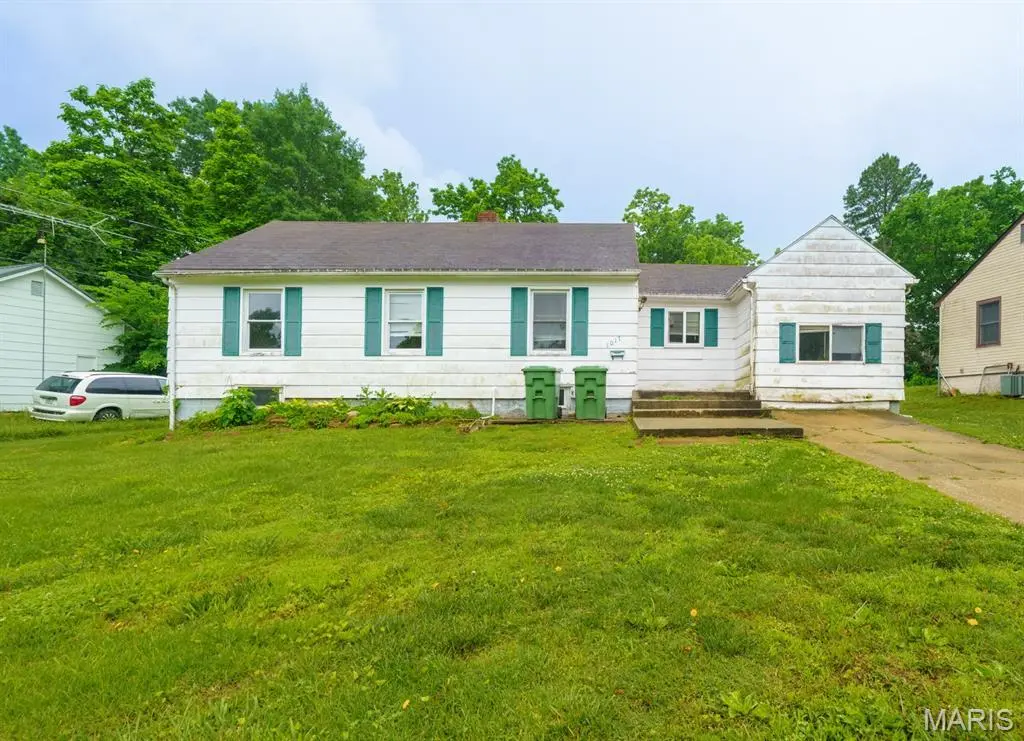
1017 Morrell Ave · Rolla, MO
Flood risk 1/10 · Minimal
- FEMA flood zone
- X (unshaded)
- Chance of flooding over 30 yrs
- 0.0%
- Est. flood insurance / yr
- $473 – $860
Fire risk 5/10 · Moderate
- Est. fire insurance / yr
- $1,054 – $1,958
Heat risk 4/10 · Minor
- Hot days now (above 106°F)
- 7 days/yr
- Hot days in 30 yrs
- 19 days/yr
Wind risk 2/10 · Minimal
- Chance of severe wind over 30 yrs
- —
Air-quality risk 2/10 · Minimal
- Unhealthy air days now
- 0 days/yr
- Unhealthy air days in 30 yrs
- 1 days/yr
Risk factors via First Street. Map © Google.
Why this score? — see what drove the B grade
The composite is a weighted blend of 9 inputs, each scored 0–100. Each bar is that input's sub-score; the figure is the points it added to the 100-point composite (weight × sub-score).
- Cash flow +30.0/30.0
- DSCR +10.0/10.0
- 1% rule +8.0/10.0
- ARV discount +7.5/15.0
- Rent growth +5.0/5.0
- Livability +3.7/5.0
- Schools +3.6/10.0
- Condition / age +2.5/5.0
- Appreciation +0.0/10.0
$74,900
🖨 Deal sheet 📄 Offer letter ✓ Due diligence
Listing remarks MLS
Great Investment Property. This lovely 3 bedroom home has large rooms. Enter into the living room with plenty of natural light, then it has an arched doorway to the dining room. The kitchen has plenty of cabinets and counter space with electric stove/oven and refrigerator. The third bedroom could also be used as a family room or an office. There are two more bedrooms and a bath on the opposite end of the home. Enjoy a large backyard for all your family fun.
Key facts
- Arched doorway
- Nice back yard
- Phone nook
Tags
Property features AI
Finance
- Other: Property type: Residential; Above-grade living area approximately 1,120 (per assessor)
- Financial info: Lease not considered
Exterior
- Utilities: Public water; Public sewer; Electricity connected (single phase); Natural gas connected
- Home design: Single-family residence; One level
- Construction: Frame construction
- Exterior features: Back yard
Interior
- Kitchen: Kitchen on the main level (approx. 12 x 9)
- Bedrooms: 3 bedrooms all on the main level
- Bathrooms: 1 full bathroom on the main level
- Heating & cooling: Forced air heating; Central air conditioning
- Interior features: 6 total rooms; Unfinished basement with sump pump
Neighborhood map
What this means for you Summary
Snapshot
- This is a 2-bed/1.0-bath single-family listed at $75k.
Deal economics
- At list price, monthly cash flow is $297 ($4k/yr) — positive.
- The deal already cash-flows at list — no discount required.
- Meets the 1% rule at list price ($977 rent vs $75k).
- Cap rate 11.0% vs local median 3.5% in Rolla — top-decile yield for the area; either an underpriced asset or a hidden risk that comps aren't pricing in. Stress-test before assuming the spread holds.
Location & tenants
- Location reads 73/100 on livability (#76 in MO) — a middle-class / working-renter tenant base. Strengths: cost of living A+, health & safety A+, housing A-; Watch: crime D, commute F, employment D-.
- Rolla 31 (town): math 38% / reading 48% proficiency, ranked #118 of 324 in MO (top 36%) — families likely to look elsewhere, expect single-tenant / working-renter base with shorter leases.
- Zoned schools: Col. John B. Wyman Elem. (math 52% / reading 52%, grade C-, #231 of 1,115 statewide, top 24%, 482 students, 42% FRL); Rolla Sr. High (math 25% / reading 61%, grade F, #211 of 521 statewide, top 41%, 1,323 students, 34% FRL) — zoned schools at 38% FRL track the district average.
- Market conditions: Rents rising fast (+10.2%/yr); 268 active listings in the ZIP; 2 comparable units currently listed for rent nearby; 162 units permitted in Phelps County in 2024 (83 in 5+ unit buildings).
Forward outlook
- Local home prices are declining (-3.0%/yr); year-one equity from $518 of loan paydown is wiped out by about $2k of value loss. Plan a longer hold.
- Phelps County population projected at -12% by 2050 — secular population decline; favor cash flow + early exit over multi-decade hold.
- At projected returns (-3.0% appreciation + 8.0% rent growth), your $21k cash investment doubles in ~6 years — after that, you're playing with house money.
Negotiation context
- Only 3 days on market — expect competitive offers; lowballing is unlikely to land.
- 2 sale attempts since 10y ago with the ask held roughly flat each time — persistent listings suggest the price (not the market) is what's stuck; bring a comps-based counter.
- Current owner paid $56k; 34% above their basis — modest negotiation headroom, anchor on the comps not their cost.
Risks & watch-outs
- Watch-outs: built in 1942 — expect roof / HVAC / electrical / plumbing capex.
- Climate carrying-cost: moderate wildfire risk — expect insurance premiums to compound above CPI over the hold.
Questions for the listing agent
- Built in 1942 — when were the roof, HVAC, electrical panel, plumbing, and water heater last replaced?
- Is there a deadline driving the sale (1031 exchange, divorce, estate, relocation)? That informs how much negotiation room exists.
- Schools are B-rated — typically a magnet for longer-tenancy family renters. What's the average tenant stay here, and is there a school-zone premium baked into asking?
- Crime grade is D in this area — have there been break-ins, vandalism, or insurance claims at this property in the last 3 years? What carrier currently insures it and at what premium?
- What's the average days-on-market for RENTAL listings here right now (not sales)? A rising rental-DOM trend means longer vacancies and softer asking-rent achievability than the comps imply.
- What's the recent tenant-quality profile in this submarket — average credit score on applications, eviction rate, late-payment / NSF rate, and stable-employment percentage? A property-management company in the area should have these aggregated.
- How much new for-sale + rental construction is in the pipeline within 1–3 miles? Heavy new supply typically softens prices + rents 12–24 months out; constrained supply supports both.
Investment metrics
- 1% rule
- 1.30% ✓
- Cap rate
- 11.05%
- Cash-on-cash
- 16.98%
- DSCR
- 1.76
- GRM
- 6.4
CMA / ARV
- ARV (on-the-fly)
- $157,920
- Comps found
- 7
Show comp detail 7 sales within ~0.75 mi
| Address | Dist | Beds/Ba | Sqft | Sold | Price | $/sf | Match |
|---|---|---|---|---|---|---|---|
| 107 S Walker Ave | 0.16mi | 3/1.0 (+1) | 1,064 (-5%) | 6mo | $165,000 | $155 | 74 |
| 405 S Adrian Ave | 0.28mi | 3/2.0 (+1) | 1,080 (-4%) | 8mo | $179,900 | $167 | 66 |
| 105 S Rolla St | 0.54mi | 2/1.0 | 1,034 (-8%) | 10mo | $125,000 | $121 | 54 |
| 407 Williams Rd | 0.45mi | 3/1.0 (+1) | 1,160 (+4%) | 20mo | $129,900 | $112 | 52 |
| 802 Bray Ave | 0.51mi | 3/2.0 (+1) | 1,224 (+9%) | 8mo | $87,000 | $71 | 45 |
| 508 S Rolla St | 0.61mi | 2/2.0 | 1,025 (-8%) | 10mo | $144,900 | $141 | 45 |
| 618 Houston Rd | 0.64mi | 3/1.0 (+1) | 1,000 (-11%) | 10mo | $147,500 | $148 | 39 |
Match score weights: distance 35% · size 25% · config 20% · recency 20%. Top-matched comps best support the ARV.
Projected returns pro-forma
-3.0% appreciation · 8.0% rent growth · sell at horizon
- IRR
- 13.5%
- Equity multiple
- 1.57×
- Total profit
- $11,914
- Equity at exit
- $11,168
- IRR
- 25.7%
- Equity multiple
- 3.77×
- Total profit
- $58,163
- Equity at exit
- $6,476
Cash invested: $20,972 (down + closing). Projections, not guarantees.
Landlord ↔ Tenant lean methodology
- Overall (STATE)
- 81 Strongly Landlord-Friendly
- State Missouri
- 81 Strongly Landlord-Friendly · R+10
- County
- — inherits STATE
- City
- — inherits STATE
ZIP-level market 65401
- Home prices YoY
- -26.4%
- Rents YoY
- 10.2%
- Active inventory
- 268
- Price-to-rent
- 6.4×
Monthly cashflow live
- Estimated rent
- $977 medium interval (Pro) →
- Mortgage (P&I)
- −$393
- Tax from tax record
- −$51 /mo · $613/yr
- Insurance
- −$31
- HOA
- −$0
- Vacancy / Maint / Mgmt
- −$205
- Net cashflow
- $297
Break-even live
UW: 25.0% down · 7.5% · 30yr · 1.5% tax · 5.0% vac · 8.0% maint · 8.0% mgmt
Financing live
Cash to close
- Down payment
- $18,725
- Closing costs
- $2,247
- Reserves months
- —
- Total cash needed
- —
Loan-product check · same deal, 3 products live
Conventional
25% down · 7.5% · 30yr
- Down + closing
- —
- Monthly P&I
- —
- Monthly cashflow
- —
- DSCR
- —
- Eligible?
- —
Personal DTI + credit; lowest rate.
DSCR
20% down · 8.5% · 30yr
- Down + closing
- —
- Monthly P&I
- —
- Monthly cashflow
- —
- DSCR
- —
- Eligible?
- —
No personal income docs; deal must DSCR.
Hard money
10% down · 12.0% · 12mo
- Down + closing
- —
- Monthly P&I
- —
- Monthly cashflow
- —
- DSCR
- —
- Eligible?
- —
Short-term bridge; refi at stabilization.
Rent comps 2 comps
| Address | Beds | Baths | Sqft | Rent | $/sqft | DOM | Units | Dist |
|---|---|---|---|---|---|---|---|---|
| 701 N State St Unit B Rolla, MO | 3.0 | 2.0 | 1100 | $850 | $0.77 | 44d | 1 | 0.56mi |
| 1853 White Columns Dr Rolla, MO | 3.0 | 3.0 | 1400 | $1,800 | $1.29 | 44d | 1 | 1.26mi |
Listing history 8 events
-
2026-05-31status $74,900 Pending 3 DOM
-
2026-05-30days on market $74,900 Active 3 DOM
-
2026-05-27$74,900 Active
-
2017-01-04status Pending 461-char remark
Show marketing remark (461 chars)
Great Investment Property. This lovely 3 bedroom home has large rooms. Enter into the living room with plenty of natural light, then it has an arched doorway to the dining room. The kitchen has plenty of cabinets and counter space with electric stove/oven and refrigerator. The third bedroom could also be used as a family room or an office. There are two more bedrooms and a bath on the opposite end of the home. Enjoy a large backyard for all your family fun.
-
2017-01-03soldstatus Closed 461-char remark
Show marketing remark (461 chars)
Great Investment Property. This lovely 3 bedroom home has large rooms. Enter into the living room with plenty of natural light, then it has an arched doorway to the dining room. The kitchen has plenty of cabinets and counter space with electric stove/oven and refrigerator. The third bedroom could also be used as a family room or an office. There are two more bedrooms and a bath on the opposite end of the home. Enjoy a large backyard for all your family fun.
-
2017-01-03soldstatus $56,000
Show marketing remark (461 chars)
Great Investment Property. This lovely 3 bedroom home has large rooms. Enter into the living room with plenty of natural light, then it has an arched doorway to the dining room. The kitchen has plenty of cabinets and counter space with electric stove/oven and refrigerator. The third bedroom could also be used as a family room or an office. There are two more bedrooms and a bath on the opposite end of the home. Enjoy a large backyard for all your family fun.
-
2016-12-07$59,900 Active 461-char remark
Show marketing remark (461 chars)
Great Investment Property. This lovely 3 bedroom home has large rooms. Enter into the living room with plenty of natural light, then it has an arched doorway to the dining room. The kitchen has plenty of cabinets and counter space with electric stove/oven and refrigerator. The third bedroom could also be used as a family room or an office. There are two more bedrooms and a bath on the opposite end of the home. Enjoy a large backyard for all your family fun.
-
1998-08-01soldstatus
ⓘ Source: listings_history table (triggers on properties + properties_extension) + one-shot
backfill from property_details.listing_events for pre-trigger history.
Tax reassessment forecast MO · Resets to sale price
- Current annual tax
- $613 · $51/mo
- Projected year-2 tax
- $727 · $61/mo
- Expected delta
- +$114/yr (+$9/mo · 18.6%)
ⓘ Screening estimate from a state-policy table — verify with the county assessor before closing.
Climate risk First Street
- Flood 1/10 Low FEMA zone X (unshaded) · 0% chance over 30 yrs
- Wildfire 5/10 Major
- Heat 4/10 Moderate 7 d/yr ≥106°F today · 19 d/yr by 30 yrs out
- Wind 2/10 Low
- Air quality 2/10 Low 0 unhealthy d/yr today · 1 by 30 yrs out
Nearby sold comps map
Loading sold comps map…
Walkable amenities ~0.75 mi
Loading nearby amenities…
Taxation est. · year 1
- Rental income
- $11,723
- − Mortgage interest
- −$4,196
- − Property taxes
- −$613
- − Insurance
- −$374
- − Repairs & maintenance
- −$938
- − Management
- −$938
- − Depreciation
- −$2,179
- Taxable income
- $2,486
- Est. tax owed @ 24.0%
- −$597
- After-tax cash flow
- $2,964/yr
For passive investors: Depreciation is non-cash, so a rental often shows a tax loss while cash-flowing — sheltering income. Rental losses are passive: they offset passive income freely, and up to $25,000/yr can offset ordinary (W-2) income if you actively participate and your MAGI is under $100k (phasing out to $0 by $150k); unused losses carry forward. On sale, claimed depreciation is recaptured at up to 25%, and gains may owe capital-gains tax (a 1031 exchange can defer both). Figures are a year-1 estimate at your 24.0% rate — not tax advice; consult a CPA.
Schools (NCES district)
- District
- Rolla 31
- NCES district ID
- 2926890
- Math proficiency
- 38% ▼ -9.00%
- Reading proficiency
- 48% ▼ -7.00%
- Median HH income
- $40,057
- Composite
- 36.0/100
- National rank
- #4786
- State rank
- #118 of 324 in MO
Livability — Rolla
- Score
- 73/100
- State rank
- #76
- US rank
- #5115
Category grades
Schools grade is shown separately in the Schools card above.
Census & demographics
- Census place
- Rolla, MO
- County
- Phelps County · 42,017 people
- City population
- 32,714
- Metro
- Rolla, MO
- Population (ZIP)
- 32,714
- Household income
- $56,081
- Rent vs Own
- Severe rent burden
- 1122.0
Population outlook (Phelps County) Hauer SSP2
- Today (2025)
- 44,188 people
- By 2030
- 43,524 · -1.5%
- By 2040
- 41,211 · -6.7%
- By 2050
- 38,977 · -11.8%
- By 2075
- 33,846 · -23.4%
- By 2100
- 27,828 · -37.0%
Race, ethnicity, and origin ACS 2023
- Neighborhood character
- Predominantly White (84%)
- Race & ethnicity
- White 84% Two or more races 6% Asian 4% Hispanic / Latino 3% Black 3%
- Common ancestry
- Lithuanian 4% Italian 2% Slovak 2%
- Foreign-born
- 6% · China, Canada
- Languages at home
- 93% English-only · Chinese 2% Spanish 1% Other Indo-European 1%
Political lean MEDSL · Phelps
- 2024 margin
- Solid R (+42.9) · D 27.9% · R 70.8% · Other 1.3%
- 2008→2024 swing
- -20.7pp toward R · 2008: -22.2pp · 2024: -42.9pp
- All cycles
- 2024: R+42.9 2020: R+40.1 2016: R+42.9 2012: R+33.5 2008: R+22.2
Not yet ingested
- Civics
- —
Market trends
- HPI YoY
- ▼ -61.69%
- Current HPI
- 172.421
- Rent YoY
- ▲ 10.25%
- Metro
- Rolla, MO
- State GDP YoY
- ▲ 1.84%
- F500 in state
- 20
Industry mix (Fortune 500 HQ in MO)
| Industry | F500 HQs | Revenue |
|---|---|---|
| Healthcare | 1 | $163B |
|
||
| Insurance | 1 | $21B |
|
||
| Industrial Technology | 1 | $17B |
|
||
| Retail | 1 | $16B |
|
||
| Industrial Distribution | 1 | $10B |
|
||
| Utilities | 1 | $9B |
|
||
Price history
+25.0% since first listed6 events — show timeline
- 2026-05-27 Listed $74,900 MARIS as Distributed by MLS Grid
- 2017-01-04 Pending — MARIS as Distributed by MLS Grid
- 2017-01-03 Sold (Public Records) $56,000 Public Records
- 2017-01-03 Sold (MLS) — MARIS as Distributed by MLS Grid
- 2016-12-07 Listed $59,900 MARIS as Distributed by MLS Grid
- 1998-08-01 Sold (Public Records) — Public Records
Property tax history
+3.9%/yrLatest (2025): $613 · +11.4% YoY. Source: county tax records.
Cash-flow waterfall
monthlySold comps — $/sqft
last 12 mo · ≤1 miLoading sold comps…