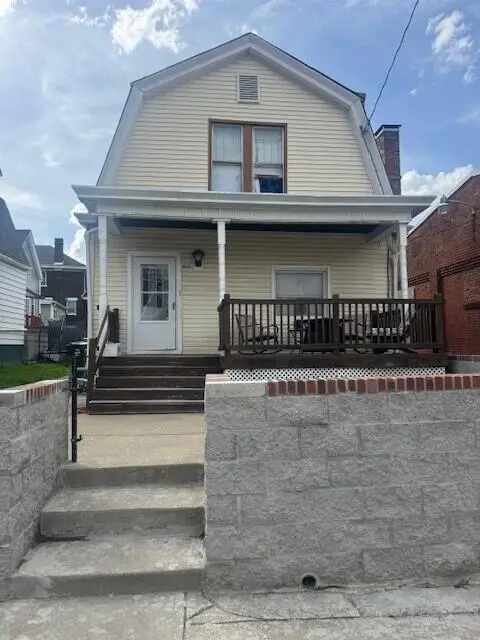
610 Main St · Dayton, KY
Flood risk 8/10 · Major
- FEMA flood zone
- X (unshaded)
- Chance of flooding over 30 yrs
- 0.99%
- Est. flood insurance / yr
- $507 – $1,088
Fire risk 1/10 · Minimal
- Est. fire insurance / yr
- $839 – $1,559
Heat risk 5/10 · Moderate
- Hot days now (above 103°F)
- 7 days/yr
- Hot days in 30 yrs
- 19 days/yr
Wind risk 2/10 · Minimal
- Chance of severe wind over 30 yrs
- 1.0%
Air-quality risk 3/10 · Minor
- Unhealthy air days now
- 2 days/yr
- Unhealthy air days in 30 yrs
- 3 days/yr
Risk factors via First Street. Map © Google.
Why this score? — see what drove the B grade
The composite is a weighted blend of 9 inputs, each scored 0–100. Each bar is that input's sub-score; the figure is the points it added to the 100-point composite (weight × sub-score).
- Cash flow +26.6/30.0
- ARV discount +15.0/15.0
- DSCR +9.1/10.0
- 1% rule +6.5/10.0
- Rent growth +4.3/5.0
- Livability +4.0/5.0
- Condition / age +2.5/5.0
- Schools +2.3/10.0
- Appreciation +0.0/10.0
$169,900
🖨 Deal sheet 📄 Offer letter ✓ Due diligence
Listing remarks
Are you looking for a 2-bedroom, 1 bath, home to invest in or make your own? Look no further with this comfortable home in the heart of Dayton, KY. The neighborhood is expanding with new activities & is in a great walkable location. This home has a new roof, vinyl plank flooring, and a new stone-brick front retaining wall. The basement has a lot of potential with plenty of storage space. This home is just minutes from Cincinnati, parks, shops, & dining. The neighborhood is growing and this home is a great opportunity!
Key facts
- Growing neighborhood
- New roof
- Vinyl plank flooring
Tags
Property features AI
Exterior
- Parking: On-street parking
- Utilities: Public water; Public sewer; Water and sewer available
- Home design: Single family residence; Two levels; Existing structure
- Construction: Built in 1915; Aluminum siding; Vinyl siding; Shingle roof; Block foundation
- Exterior features: Porch; Paved road access
Interior
- Kitchen: Stainless steel appliances; Electric oven; Dishwasher; Refrigerator
- Bedrooms: Primary bedroom (16 x 13); Bedroom 2 (14 x 10)
- Bathrooms: 1 full bathroom
- Heating & cooling: Forced air heating; Window unit(s) for cooling
- Interior features: Ceiling fan(s); Full basement
- Laundry & utility: Laundry on lower level
Neighborhood map
What this means for you Summary
Snapshot
- This is a 2-bed/1.0-bath single-family listed at $170k.
Deal economics
- At list price, monthly cash flow is $388 ($5k/yr) — positive.
- The deal already cash-flows at list — no discount required.
- Meets the 1% rule at list price ($2k rent vs $170k).
- Recommended offer: $165k (3.0% below list) — sets the bar for market timing.
- Cap rate 9.5% vs local median 6.9% in Dayton — top-decile yield for the area; either an underpriced asset or a hidden risk that comps aren't pricing in. Stress-test before assuming the spread holds.
Location & tenants
- Location reads 81/100 on livability (#67 in KY, #1,485 nationally) — a professional / high-income tenant draw. Strengths: commute A+, cost of living A+, housing A+; Watch: employment D+.
- Dayton Independent (suburban): math 23% / reading 32% proficiency, ranked #129 of 165 in KY (top 78%) — low school quality limits family demand, transient renter base, plan for 1-2y turnover; 71% free/reduced lunch — lower-income household profile, screen leases tightly.
- Zoned schools: Lincoln Elementary School (math 20% / reading 29%, grade F, #489 of 676 statewide, top 76%, 487 students, 82% FRL); Dayton High School (math 27% / reading 37%, grade F, #97 of 254 statewide, top 46%, 372 students, 78% FRL).
- Market conditions: Rents rising fast (+7.2%/yr); 53 active listings in the ZIP; 27 comparable units currently listed for rent nearby; rentals leasing fast (median 5d on market — plan ~1-2 weeks tenant-placement turnaround); 247 units permitted in Campbell County in 2024 (77 in 5+ unit buildings).
- This rent runs 35% of the median local income ($66k/yr) — at the standard rent-burdened threshold; future hikes will face affordability resistance.
Forward outlook
- Local home prices are declining (-3.0%/yr); year-one equity from $1k of loan paydown is wiped out by about $5k of value loss. Plan a longer hold.
- At projected returns (-3.0% appreciation + 7.2% rent growth), your $48k cash investment doubles in ~8 years — after that, you're playing with house money.
Negotiation context
- It's been on market 39 days — a 3% lower offer ($165k) is reasonable based on typical stale-listing flexibility.
Risks & watch-outs
- Watch-outs: flood insurance adds $66/mo; built in 1915 — expect roof / HVAC / electrical / plumbing capex.
- Climate carrying-cost: severe flood risk; extreme-heat days projected 7→19/yr by 2055 (HVAC capex compounding) — expect insurance premiums to compound above CPI over the hold.
Questions for the listing agent
- It's been on market 39 days. Have you received any prior offers? Is the seller open to a 3% concession, seller financing, or rate buy-down credit?
- Built in 1915 — when were the roof, HVAC, electrical panel, plumbing, and water heater last replaced?
- What's the actual annual flood-insurance premium (NFIP or private), and is the property in a SFHA with mandatory coverage?
- Is there a deadline driving the sale (1031 exchange, divorce, estate, relocation)? That informs how much negotiation room exists.
- Schools are D-rated, which usually means shorter tenancies and higher turnover. Who's the typical renter profile here, and what's been the actual vacancy rate?
- What's the average days-on-market for RENTAL listings here right now (not sales)? A rising rental-DOM trend means longer vacancies and softer asking-rent achievability than the comps imply.
- What's the recent tenant-quality profile in this submarket — average credit score on applications, eviction rate, late-payment / NSF rate, and stable-employment percentage? A property-management company in the area should have these aggregated.
- How much new for-sale + rental construction is in the pipeline within 1–3 miles? Heavy new supply typically softens prices + rents 12–24 months out; constrained supply supports both.
Investment metrics
- 1% rule
- 1.15% ✓
- Cap rate
- 9.50%
- Cash-on-cash
- 11.46%
- DSCR
- 1.51
- GRM
- 7.3
CMA / ARV
- ARV (on-the-fly)
- $248,160
- Comps found
- 12
Show comp detail 12 sales within ~0.75 mi
| Address | Dist | Beds/Ba | Sqft | Sold | Price | $/sf | Match |
|---|---|---|---|---|---|---|---|
| 1028 5th Ave | 0.19mi | 2/1.0 | 1,320 (0%) | 2mo | $175,000 | $133 | 90 |
| 412 Main St | 0.11mi | 2/1.0 | 1,344 (+2%) | 2mo | $255,000 | $190 | 90 |
| 607 Main St | 0.03mi | 2/1.5 | 1,216 (-8%) | 1mo | $239,000 | $197 | 83 |
| 633 7th Ave | 0.12mi | 3/1.0 (+1) | 1,380 (+4%) | 4mo | $246,000 | $178 | 78 |
| 1121 7th Ave | 0.26mi | 3/1.0 (+1) | 1,183 (-10%) | 1mo | $262,000 | $221 | 65 |
| 300 8th Ave | 0.45mi | 3/1.0 (+1) | 1,408 (+7%) | 1mo | $210,500 | $150 | 62 |
| 73 Harrison Ave | 0.66mi | 3/1.5 (+1) | 1,292 (-2%) | 4mo | $235,000 | $182 | 56 |
| 927 Thornton St | 0.59mi | 3/2.0 (+1) | 1,408 (+7%) | 1mo | $207,500 | $147 | 51 |
| 402 5th Ave | 0.41mi | 3/2.0 (+1) | 1,488 (+13%) | 1mo | $280,000 | $188 | 50 |
| 219 8th Ave | 0.50mi | 2/1.5 | 1,128 (-14%) | 3mo | $225,000 | $199 | 48 |
| 175 Van Voast Ave | 0.72mi | 3/1.5 (+1) | 1,440 (+9%) | 3mo | $220,000 | $153 | 42 |
| 223 4th Ave | 0.55mi | 3/2.5 (+1) | 1,152 (-13%) | 2mo | $275,000 | $239 | 41 |
Match score weights: distance 35% · size 25% · config 20% · recency 20%. Top-matched comps best support the ARV.
Projected returns pro-forma
-3.0% appreciation · 7.15% rent growth · sell at horizon
- IRR
- 3.0%
- Equity multiple
- 1.12×
- Total profit
- $5,656
- Equity at exit
- $25,333
- IRR
- 16.1%
- Equity multiple
- 2.57×
- Total profit
- $74,697
- Equity at exit
- $14,690
Cash invested: $47,572 (down + closing). Projections, not guarantees.
Landlord ↔ Tenant lean methodology
- Overall (STATE)
- 83 Strongly Landlord-Friendly
- State Kentucky
- 83 Strongly Landlord-Friendly · R+16
- County
- — inherits STATE
- City
- — inherits STATE
ZIP-level market 41074
- Rents YoY
- 7.2%
- Active inventory
- 53
- Price-to-rent
- 7.3×
Monthly cashflow live
- Estimated rent
- $1,950 high interval (Pro) →
- Mortgage (P&I)
- −$891
- Tax from tax record
- −$124 /mo · $1,492/yr
- Insurance
- −$71
- Flood insurance flood zone
- −$66 /mo · $798/yr
- HOA
- −$0
- Vacancy / Maint / Mgmt
- −$409
- Net cashflow
- $388
Break-even live
UW: 25.0% down · 7.5% · 30yr · 1.5% tax · 5.0% vac · 8.0% maint · 8.0% mgmt
Financing live
Cash to close
- Down payment
- $42,475
- Closing costs
- $5,097
- Reserves months
- —
- Total cash needed
- —
Loan-product check · same deal, 3 products live
Conventional
25% down · 7.5% · 30yr
- Down + closing
- —
- Monthly P&I
- —
- Monthly cashflow
- —
- DSCR
- —
- Eligible?
- —
Personal DTI + credit; lowest rate.
DSCR
20% down · 8.5% · 30yr
- Down + closing
- —
- Monthly P&I
- —
- Monthly cashflow
- —
- DSCR
- —
- Eligible?
- —
No personal income docs; deal must DSCR.
Hard money
10% down · 12.0% · 12mo
- Down + closing
- —
- Monthly P&I
- —
- Monthly cashflow
- —
- DSCR
- —
- Eligible?
- —
Short-term bridge; refi at stabilization.
Rent comps 27 comps
| Address | Beds | Baths | Sqft | Rent | $/sqft | DOM | Units | Dist |
|---|---|---|---|---|---|---|---|---|
| 1065 Manhattan Blvd Dayton, KY | 1.0–3.0 | 1.0–2.0 | 1038 | $2,152 | $2.07 | 1d | 19 | 0.42mi |
| 1181 Manhattan Blvd Dayton, KY | 2.0 | 2.0 | 1124 | $2,712 | $2.41 | 1d | 10 | 0.57mi |
| 236 Ward Ave Bellevue, KY | 3.0 | 2.0 | 1500 | $2,585 | $1.72 | 12d | 1 | 0.75mi |
| 324 Fairfield Ave Unit 4 Bellevue, KY | 2.0 | 1.0 | 1095 | $1,545 | $1.41 | 21d | 1 | 0.89mi |
| 324 Fairfield Ave Unit 1 Bellevue, KY | 2.0 | 1.0 | 1080 | $1,685 | $1.56 | 3d | 1 | 0.89mi |
| 2401 Salutaris Ave Cincinnati, OH | 1.0–2.0 | 1.0 | 800 | $1,300 | $1.62 | 23d | 1 | 0.93mi |
| 2015 Edgecliff Pt Unit 4 Cincinnati, OH | 2.0 | 2.0 | 1200 | $1,595 | $1.33 | 4d | 1 | 0.96mi |
| 327 Covert Run Pike Unit 1 Bellevue, KY | 2.0 | 2.0 | 1580 | $1,850 | $1.17 | 23d | 1 | 0.96mi |
| 1404-1406 E McMillan St Cincinnati, OH | 1.0–2.0 | 1.0–1.5 | 1200 | $1,695 | $1.41 | 23d | 1 | 1.03mi |
| 239 Grandview Ave Bellevue, KY | 2.0 | 2.0 | 1093 | $1,645 | $1.50 | 4d | 2 | 1.04mi |
| 2533 Woodburn Ave Cincinnati, OH | 3.0 | 1.0–3.0 | 912 | $2,668 | $2.93 | 1d | 39 | 1.10mi |
| 2330 Victory Pkwy Cincinnati, OH | 1.0–2.0 | 1.0–2.0 | 693 | $1,999 | $2.88 | 2d | 6 | 1.11mi |
| 2705 Hackberry St Unit 1 Cincinnati, OH | 2.0 | 1.0 | 1000 | $1,395 | $1.40 | 23d | 1 | 1.12mi |
| 2705 Hackberry St Unit 1 Cincinnati, OH | 2.0 | 1.0 | 1200 | $1,395 | $1.16 | 3d | 1 | 1.12mi |
| 2716 Woodburn Ave Unit 2 Cincinnati, OH | 2.0 | 1.0 | 900 | $1,350 | $1.50 | 23d | 1 | 1.15mi |
| 1228 E McMillan St Cincinnati, OH | 1.0–2.0 | 1.0–2.0 | 1340 | $2,327 | $1.74 | 1d | 14 | 1.17mi |
| 2118 Saint James Ave Cincinnati, OH | 2.0 | 1.0 | 1005 | $1,650 | $1.64 | 23d | 1 | 1.21mi |
| 960 Francisco St Unit 107 Cincinnati, OH | 2.0 | 2.0 | 912 | $1,649 | $1.81 | 23d | 1 | 1.29mi |
| 2624 Victory Pkwy Unit 206 Cincinnati, OH | 2.0 | 1.0 | 975 | $1,499 | $1.54 | 10d | 1 | 1.30mi |
| 1243 Martin Dr Unit 1056135P Cincinnati, OH | 2.0 | 1.0 | 1184 | $3,099 | $2.62 | 1d | 1 | 1.31mi |
| 3001-A Woodburn Ave Cincinnati, OH | 1.0–2.0 | 1.0–2.0 | 947 | $2,252 | $2.38 | 1d | 12 | 1.31mi |
| 975 E McMillan St Unit 201 Cincinnati, OH | 2.0 | 1.0 | 978 | $1,695 | $1.73 | 20d | 1 | 1.35mi |
| 975 E McMillan St Cincinnati, OH | 2.0 | 1.0 | 978 | $1,695 | $1.73 | 20d | 1 | 1.35mi |
| 2101 Grandin Rd Cincinnati, OH | 1.0–2.0 | 1.0–2.0 | 1042 | $2,099 | $2.01 | 1d | 12 | 1.37mi |
| 2132 Gilbert Ave Unit A Cincinnati, OH | 2.0 | 2.5 | 1450 | $2,250 | $1.55 | 4d | 1 | 1.47mi |
| 118 Beech St Newport, KY | 3.0 | 2.0 | 1610 | $2,400 | $1.49 | 1d | 1 | 1.47mi |
| 1137 Fuller St Unit 1056121P Cincinnati, OH | 1.0–2.0 | 1.0 | 1135 | $3,653 | $3.22 | 1d | 2 | 1.49mi |
Listing history 4 events
-
2026-05-18status Pending
-
2026-05-11price $169,900
-
2026-04-14price $189,900
-
2026-04-09$229,900 Active
ⓘ Source: listings_history table (triggers on properties + properties_extension) + one-shot
backfill from property_details.listing_events for pre-trigger history.
Tax reassessment forecast KY · Resets to sale price
- Current annual tax
- $1,492 · $124/mo
- Projected year-2 tax
- $1,492 · $124/mo
- Expected delta
- $0/yr ($0/mo · 0.0%)
ⓘ Screening estimate from a state-policy table — verify with the county assessor before closing.
Climate risk First Street
- Flood 8/10 Severe FEMA zone X (unshaded) · 99% chance over 30 yrs
- Wildfire 1/10 Low
- Heat 5/10 Major 7 d/yr ≥103°F today · 19 d/yr by 30 yrs out
- Wind 2/10 Low 100% chance of damaging wind over 30 yrs
- Air quality 3/10 Moderate 2 unhealthy d/yr today · 3 by 30 yrs out
Nearby sold comps map
Loading sold comps map…
Walkable amenities ~0.75 mi
Loading nearby amenities…
Taxation est. · year 1
- Rental income
- $23,396
- − Mortgage interest
- −$9,517
- − Property taxes
- −$1,492
- − Insurance
- −$1,647
- − Repairs & maintenance
- −$1,872
- − Management
- −$1,872
- − Depreciation
- −$4,943
- Taxable income
- $2,054
- Est. tax owed @ 24.0%
- −$493
- After-tax cash flow
- $4,159/yr
For passive investors: Depreciation is non-cash, so a rental often shows a tax loss while cash-flowing — sheltering income. Rental losses are passive: they offset passive income freely, and up to $25,000/yr can offset ordinary (W-2) income if you actively participate and your MAGI is under $100k (phasing out to $0 by $150k); unused losses carry forward. On sale, claimed depreciation is recaptured at up to 25%, and gains may owe capital-gains tax (a 1031 exchange can defer both). Figures are a year-1 estimate at your 24.0% rate — not tax advice; consult a CPA.
Schools (NCES district)
- District
- Dayton Independent
- NCES district ID
- 2101530
- Math proficiency
- 23% ▼ -13.00%
- Reading proficiency
- 32% ▼ -12.00%
- Median HH income
- $38,533
- Composite
- 23.0/100
- National rank
- #7978
- State rank
- #129 of 165 in KY
Livability — Dayton
- Score
- 81/100
- State rank
- #67
- US rank
- #1485
Category grades
Schools grade is shown separately in the Schools card above.
Census & demographics
- Census place
- Dayton, KY
- County
- Campbell County · 84,793 people
- City population
- 5,756
- Metro
- Cincinnati, OH-KY-IN
- Population (ZIP)
- 5,756
- Household income
- $66,087
- Rent vs Own
- Severe rent burden
- 215.0
Population outlook (Campbell County) Hauer SSP2
- Today (2025)
- 95,668 people
- By 2030
- 96,886 · +1.3%
- By 2040
- 97,734 · +2.2%
- By 2050
- 96,413 · +0.8%
- By 2075
- 90,211 · -5.7%
- By 2100
- 79,434 · -17.0%
Race, ethnicity, and origin ACS 2023
- Neighborhood character
- Predominantly White (89%)
- Race & ethnicity
- White 89% Two or more races 7% Hispanic / Latino 3% Black 1%
- Common ancestry
- Slovak 5% Italian 3% Lithuanian 2%
- Foreign-born
- 2% · Canada
- Languages at home
- 98% English-only · Spanish 1%
Political lean MEDSL · Campbell
- 2024 margin
- R (+19.7) · D 39.2% · R 58.9% · Other 1.9%
- 2008→2024 swing
- +1.2pp toward D · 2008: -20.9pp · 2024: -19.7pp
- All cycles
- 2024: R+19.7 2020: R+18.6 2016: R+24.5 2012: R+22.8 2008: R+20.9
Not yet ingested
- Civics
- —
Market trends
- HPI YoY
- ▼ -171.48%
- Current HPI
- 235.1437
- Rent YoY
- ▲ 7.15%
- Metro
- Cincinnati, OH-KY-IN
- State GDP YoY
- ▲ 1.81%
- F500 in state
- 4
Industry mix (Fortune 500 HQ in KY)
| Industry | F500 HQs | Revenue |
|---|---|---|
| Healthcare | 1 | $118B |
|
||
| Food / Beverage | 1 | $7B |
|
||
Price history
-26.1% since first listed4 events — show timeline
- 2026-05-18 Pending — NKMLS
- 2026-05-11 Price Changed $169,900 NKMLS
- 2026-04-14 Price Changed $189,900 NKMLS
- 2026-04-09 Listed $229,900 NKMLS
Property tax history
+3.5%/yrLatest (2025): $1,492 · +0.5% YoY. Source: county tax records.
Cash-flow waterfall
monthlySold comps — $/sqft
last 12 mo · ≤1 miLoading sold comps…