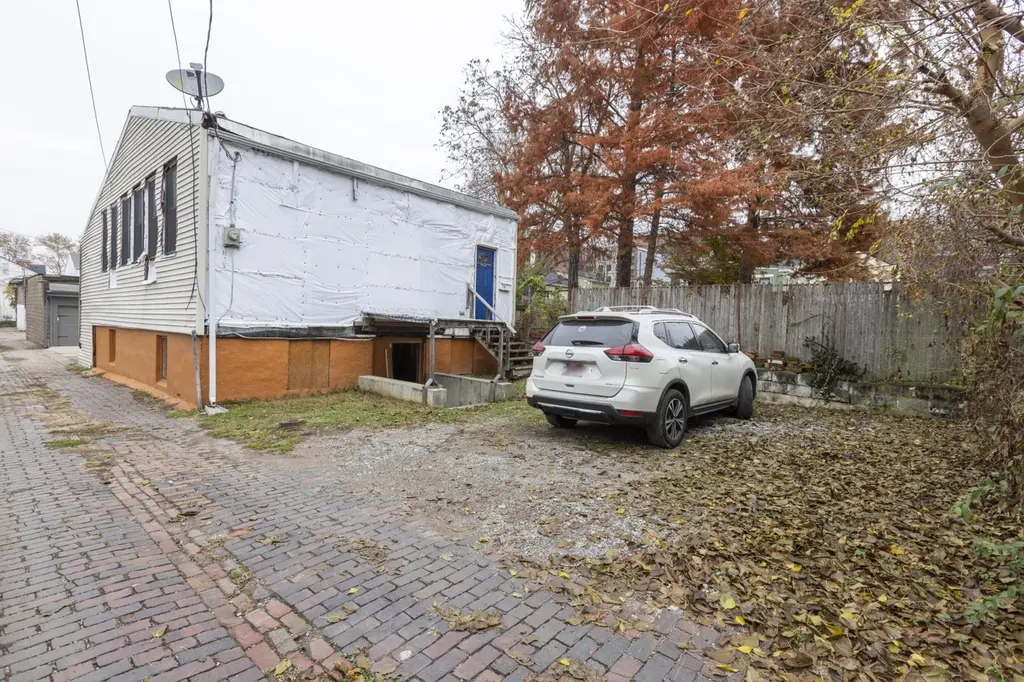
518 W 7th St · Covington, KY
Flood risk 1/10 · Minimal
- FEMA flood zone
- X (unshaded)
- Chance of flooding over 30 yrs
- 0.0%
- Est. flood insurance / yr
- $507 – $1,088
Fire risk 1/10 · Minimal
- Est. fire insurance / yr
- $839 – $1,559
Heat risk 5/10 · Moderate
- Hot days now (above 103°F)
- 7 days/yr
- Hot days in 30 yrs
- 20 days/yr
Wind risk 2/10 · Minimal
- Chance of severe wind over 30 yrs
- 1.0%
Air-quality risk 3/10 · Minor
- Unhealthy air days now
- 2 days/yr
- Unhealthy air days in 30 yrs
- 3 days/yr
Risk factors via First Street. Map © Google.
Why this score? — see what drove the B+ grade
The composite is a weighted blend of 9 inputs, each scored 0–100. Each bar is that input's sub-score; the figure is the points it added to the 100-point composite (weight × sub-score).
- Cash flow +30.0/30.0
- ARV discount +15.0/15.0
- DSCR +10.0/10.0
- 1% rule +9.3/10.0
- Livability +4.3/5.0
- Rent growth +2.9/5.0
- Condition / age +2.5/5.0
- Schools +1.5/10.0
- Appreciation +0.0/10.0
$155,000
🖨 Deal sheet 📄 Offer letter ✓ Due diligence
Listing remarks MLS
Lots of potential in this home conveniently located within walking distance to Mainstrasse! Spacious rooms and high ceilings. Bonus room can be a huge walk-in closet, or a first floor laundry room off the master bedroom. Private parking in your own driveway. This home is ready for your imagination & some TLC. Priced to sell and being sold as is.
Key facts
- Private entrances
- Full basement
- 1,737 sq ft lot
Tags
Property features AI
Exterior
- Parking: Off-street parking
- Utilities: Public water; Public sewer; Cable available; Water service available
- Home design: Single-family residence; One level; Residential property
- Construction: Aluminum siding; Block foundation; Approximately 1,400 building area
- Exterior features: Double-hung and vinyl-clad windows; Shingle roof; Existing structure
Interior
- Kitchen: Kitchen (10 x 9)
- Bedrooms: Primary bedroom (12 x 14); Second bedroom (12 x 12)
- Bathrooms: 2 full bathrooms
- Heating & cooling: Central air conditioning; Forced air heating
- Interior features: Full basement
Neighborhood map
What this means for you Summary
Snapshot
- This is a 3-bed/1.0-bath single-family listed at $155k.
Deal economics
- At list price, monthly cash flow is $784 ($9k/yr) — positive.
- The deal already cash-flows at list — no discount required.
- Meets the 1% rule at list price ($2k rent vs $155k).
- Recommended offer: $153k (1.5% below list) — sets the bar for market timing.
- Cap rate 12.4% vs local median 5.3% in Covington — top-decile yield for the area; either an underpriced asset or a hidden risk that comps aren't pricing in. Stress-test before assuming the spread holds.
Location & tenants
- Location reads 86/100 on livability (#40 in KY, #376 nationally) — a professional / high-income tenant draw. Strengths: amenities A+, commute A+, cost of living A+; Watch: employment D+.
- Covington Independent (suburban): math 10% / reading 27% proficiency, ranked #162 of 165 in KY (top 98%) — low school quality limits family demand, transient renter base, plan for 1-2y turnover; 78% free/reduced lunch — lower-income household profile, screen leases tightly.
- Zoned schools: John G Carlisle Elementary (math 2% / reading 27%, grade F, #620 of 676 statewide, top 93%, 304 students, 81% FRL); Holmes Middle School (math 8% / reading 26%, grade F, #211 of 217 statewide, top 97%, 656 students, 84% FRL); Holmes High School (math 12% / reading 17%, grade F, #227 of 254 statewide, top 89%, 878 students, 80% FRL) — zoned schools at 82% FRL track the district average.
- Market conditions: Rents rising (+1.6%/yr); 214 active listings in the ZIP; 27 comparable units currently listed for rent nearby; rentals leasing fast (median 2d on market — plan ~1-2 weeks tenant-placement turnaround); 699 units permitted in Kenton County in 2024 (287 in 5+ unit buildings).
- This rent runs 38% of the median local income ($70k/yr) — at the standard rent-burdened threshold; future hikes will face affordability resistance.
Forward outlook
- Local home prices are declining (-3.0%/yr); year-one equity from $1k of loan paydown is wiped out by about $5k of value loss. Plan a longer hold.
- Kenton County population projected at +5% by 2050 — modest demand growth; plan on rents tracking national, not racing it.
- At projected returns (-3.0% appreciation + 1.6% rent growth), your $43k cash investment doubles in ~7 years — after that, you're playing with house money.
Negotiation context
- It's been on market 26 days — a 2% lower offer ($153k) is reasonable based on typical stale-listing flexibility.
- 3 sale attempts since 11y ago with the ask held roughly flat each time — persistent listings suggest the price (not the market) is what's stuck; bring a comps-based counter.
- Current owner paid $42k; list at $155k implies a 273% gain — meaningful room to come down on a strong offer.
Risks & watch-outs
- Climate carrying-cost: extreme-heat days projected 7→20/yr by 2055 (HVAC capex compounding) — expect insurance premiums to compound above CPI over the hold.
Questions for the listing agent
- Is there a deadline driving the sale (1031 exchange, divorce, estate, relocation)? That informs how much negotiation room exists.
- What's the average days-on-market for RENTAL listings here right now (not sales)? A rising rental-DOM trend means longer vacancies and softer asking-rent achievability than the comps imply.
- What's the recent tenant-quality profile in this submarket — average credit score on applications, eviction rate, late-payment / NSF rate, and stable-employment percentage? A property-management company in the area should have these aggregated.
- How much new for-sale + rental construction is in the pipeline within 1–3 miles? Heavy new supply typically softens prices + rents 12–24 months out; constrained supply supports both.
Investment metrics
- 1% rule
- 1.43% ✓
- Cap rate
- 12.36%
- Cash-on-cash
- 21.67%
- DSCR
- 1.96
- GRM
- 5.8
CMA / ARV
- ARV (on-the-fly)
- $206,275
- Comps found
- 11
Show comp detail 11 sales within ~0.75 mi
| Address | Dist | Beds/Ba | Sqft | Sold | Price | $/sf | Match |
|---|---|---|---|---|---|---|---|
| 511 Pershing Ave | 0.02mi | 2/1.0 (-1) | 908 (-2%) | 22mo | $272,000 | $300 | 73 |
| 944 Philadelphia St | 0.32mi | 2/1.0 (-1) | 935 (+1%) | 10mo | $117,500 | $126 | 70 |
| 1319 Holman Ave | 0.65mi | 2/1.0 (-1) | 928 (+0%) | 7mo | $168,000 | $181 | 59 |
| 630 Western Ave | 0.25mi | 2/1.5 (-1) | 1,024 (+11%) | 15mo | $199,500 | $195 | 51 |
| 1034 Banklick St | 0.45mi | 3/1.5 | 1,040 (+12%) | 10mo | $270,000 | $260 | 48 |
| 1020 Winding Way | 0.64mi | 3/1.5 | 1,015 (+10%) | 7mo | $360,000 | $355 | 46 |
| 644 W 12th St | 0.54mi | 3/2.5 | 1,056 (+14%) | 1mo | $235,000 | $223 | 44 |
| 216 Covington Ave | 0.33mi | 2/1.0 (-1) | 1,037 (+12%) | 21mo | $235,000 | $227 | 42 |
| 1312 Russell St | 0.68mi | 2/1.0 (-1) | 1,031 (+12%) | 8mo | $200,000 | $194 | 38 |
| 1321 Russell St | 0.69mi | 2/1.0 (-1) | 878 (-5%) | 22mo | $66,000 | $75 | 36 |
| 1016 John St | 0.73mi | 3/2.0 | 816 (-12%) | 19mo | $195,000 | $239 | 26 |
Match score weights: distance 35% · size 25% · config 20% · recency 20%. Top-matched comps best support the ARV.
Projected returns pro-forma
-3.0% appreciation · 1.55% rent growth · sell at horizon
- IRR
- 12.7%
- Equity multiple
- 1.50×
- Total profit
- $21,585
- Equity at exit
- $23,111
- IRR
- 20.5%
- Equity multiple
- 2.62×
- Total profit
- $70,257
- Equity at exit
- $13,402
Cash invested: $43,400 (down + closing). Projections, not guarantees.
Landlord ↔ Tenant lean methodology
- Overall (STATE)
- 83 Strongly Landlord-Friendly
- State Kentucky
- 83 Strongly Landlord-Friendly · R+16
- County
- — inherits STATE
- City
- — inherits STATE
ZIP-level market 41011
- Rents YoY
- 1.6%
- Active inventory
- 214
- Price-to-rent
- 5.8×
Monthly cashflow live
- Estimated rent
- $2,212 high interval (Pro) →
- Mortgage (P&I)
- −$813
- Tax from tax record
- −$87 /mo · $1,040/yr
- Insurance
- −$65
- HOA
- −$0
- Vacancy / Maint / Mgmt
- −$465
- Net cashflow
- $784
Break-even live
UW: 25.0% down · 7.5% · 30yr · 1.5% tax · 5.0% vac · 8.0% maint · 8.0% mgmt
Financing live
Cash to close
- Down payment
- $38,750
- Closing costs
- $4,650
- Reserves months
- —
- Total cash needed
- —
Loan-product check · same deal, 3 products live
Conventional
25% down · 7.5% · 30yr
- Down + closing
- —
- Monthly P&I
- —
- Monthly cashflow
- —
- DSCR
- —
- Eligible?
- —
Personal DTI + credit; lowest rate.
DSCR
20% down · 8.5% · 30yr
- Down + closing
- —
- Monthly P&I
- —
- Monthly cashflow
- —
- DSCR
- —
- Eligible?
- —
No personal income docs; deal must DSCR.
Hard money
10% down · 12.0% · 12mo
- Down + closing
- —
- Monthly P&I
- —
- Monthly cashflow
- —
- DSCR
- —
- Eligible?
- —
Short-term bridge; refi at stabilization.
Rent comps 27 comps
| Address | Beds | Baths | Sqft | Rent | $/sqft | DOM | Units | Dist |
|---|---|---|---|---|---|---|---|---|
| 515 Main St Covington, KY | 1.0–2.0 | 1.0–2.0 | 934 | $2,215 | $2.37 | 2d | 8 | 0.18mi |
| 50 W Rivercenter Blvd Covington, KY | 1.0–2.0 | 1.0–2.5 | 1273 | $3,640 | $2.86 | 2d | 9 | 0.62mi |
| 1025 Scott St Unit 2 Covington, KY | 2.0 | 2.0 | 1100 | $1,800 | $1.64 | 3d | 1 | 0.69mi |
| 1000 Parkvale Ct Park Hills, KY | 2.0 | 1.0 | 850 | $1,495 | $1.76 | 44d | 1 | 0.80mi |
| 1002 Parkvale Ct Unit 1004 1 Park Hills, KY | 2.0 | 1.0 | 850 | $995 | $1.17 | 44d | 1 | 0.81mi |
| 22 Swain Ct Covington, KY | 1.0–3.0 | 1.0–2.0 | 951 | $2,295 | $2.41 | 2d | 3 | 0.88mi |
| 1431 Dixie Hwy Park Hills, KY | 1.0–2.0 | 1.0–2.0 | 920 | $2,553 | $2.77 | 2d | 10 | 0.93mi |
| 1261 Parkway Ave Covington, KY | 1.0–2.0 | 1.0 | 850 | $1,375 | $1.62 | 4d | 3 | 0.99mi |
| 44 W Freedom Way Cincinnati, OH | 2.0 | 1.0–2.0 | 943 | $2,859 | $3.03 | 2d | 28 | 1.03mi |
| 344 E 13th St Unit 1 Covington, KY | 2.0 | 1.0 | 1000 | $1,275 | $1.27 | 23d | 1 | 1.05mi |
| 121 E Freedom Way Cincinnati, OH | 2.0 | 1.0–2.0 | 988 | $2,999 | $3.03 | 2d | 27 | 1.11mi |
| 205 W 4th St Cincinnati, OH | 2.0 | 1.0–2.0 | 648 | $2,162 | $3.33 | 2d | 44 | 1.14mi |
| 151 W 4th St Cincinnati, OH | 2.0 | 1.0 | 726 | $2,399 | $3.30 | 2d | 102 | 1.15mi |
| 309 Vine St Cincinnati, OH | 1.0–3.0 | 1.0–2.0 | 955 | $3,334 | $3.49 | 2d | 15 | 1.17mi |
| 1 W 4th St Cincinnati, OH | 3.0 | 1.0–3.5 | 1675 | $9,200 | $5.49 | 3d | 96 | 1.21mi |
| 210 W 5th St Newport, KY | 1.0–2.0 | 1.0–2.0 | 845 | $1,800 | $2.13 | 3d | 15 | 1.24mi |
| 309 Sycamore St #201 Cincinnati, OH | 2.0 | 2.0 | 850 | $1,600 | $1.88 | 23d | 1 | 1.32mi |
| 151 Seventh St W Cincinnati, OH | 2.0 | 1.0–2.0 | 1191 | $2,129 | $1.79 | 2d | 4 | 1.41mi |
| 128 W 9th St Newport, KY | 2.0 | 1.0 | 1012 | $1,650 | $1.63 | 2d | 1 | 1.42mi |
| 580 Walnut St Cincinnati, OH | 2.0 | 1.0–2.5 | 1101 | $4,822 | $4.38 | 1d | 19 | 1.43mi |
| 1215 Elberta Cir Park Hills, KY | 2.0 | 1.0 | 825 | $1,050 | $1.27 | 3d | 1 | 1.43mi |
| 7 W 7th St Cincinnati, OH | 1.0–2.0 | 1.0–2.0 | 976 | $3,420 | $3.50 | 2d | 65 | 1.44mi |
| 630 Vine St Cincinnati, OH | 2.0 | 1.0–2.0 | 741 | $2,239 | $3.02 | 3d | 18 | 1.45mi |
| 621 E Mehring Way Cincinnati, OH | 1.0–2.0 | 1.0–2.0 | 938 | $2,249 | $2.40 | 2d | 12 | 1.47mi |
| 211 W 9th St Unit 5 Cincinnati, OH | 2.0 | 1.5 | 900 | $1,300 | $1.44 | 3d | 1 | 1.49mi |
| 19 Garfield Pl Cincinnati, OH | 1.0–2.0 | 1.0–2.0 | 1680 | $2,260 | $1.34 | 2d | 11 | 1.49mi |
| 19 Garfield Pl Cincinnati, OH | 1.0–2.0 | 1.0–2.0 | 1054 | $2,300 | $2.18 | 44d | 20 | 1.49mi |
Listing history 17 events
-
2026-06-18days on market $155,000 Active 26 DOM
-
2026-06-17days on market $155,000 Active 25 DOM
-
2026-06-16days on market $155,000 Active 24 DOM
-
2026-06-15remarks 673-char remark
-
2026-06-15days on market $155,000 Active 23 DOM
-
2026-06-09days on market $155,000 Active 17 DOM
-
2026-06-08days on market $155,000 Active 16 DOM
-
2026-06-07days on market $155,000 Active 15 DOM
-
2026-06-03days on market $155,000 Active 11 DOM
-
2026-06-02days on market $155,000 Active 10 DOM
-
2026-06-01days on market $155,000 Active 9 DOM
-
2026-05-31days on market $155,000 Active 8 DOM
-
2026-05-23$155,000 Active
-
2017-05-31soldstatus $41,500 351-char remark
Show marketing remark (351 chars)
Lots of potential in this home conveniently located within walking distance to Mainstrasse! Spacious rooms and high ceilings. Bonus room can be a huge walk-in closet, or a first floor laundry room off the master bedroom. Private parking in your own driveway. This home is ready for your imagination & some TLC. Priced to sell and being sold as is.
-
2016-12-15$52,900 351-char remark
Show marketing remark (351 chars)
Lots of potential in this home conveniently located within walking distance to Mainstrasse! Spacious rooms and high ceilings. Bonus room can be a huge walk-in closet, or a first floor laundry room off the master bedroom. Private parking in your own driveway. This home is ready for your imagination & some TLC. Priced to sell and being sold as is.
-
2016-02-17soldstatus $30,000 125-char remark
Show marketing remark (125 chars)
Great location, great space, needs quiite a bit of work but bring your ideas and it can make a great rental or rehab project.
-
2015-12-30$32,500 125-char remark
Show marketing remark (125 chars)
Great location, great space, needs quiite a bit of work but bring your ideas and it can make a great rental or rehab project.
ⓘ Source: listings_history table (triggers on properties + properties_extension) + one-shot
backfill from property_details.listing_events for pre-trigger history.
Tax reassessment forecast KY · Resets to sale price
- Current annual tax
- $1,040 · $87/mo
- Projected year-2 tax
- $1,333 · $111/mo
- Expected delta
- +$293/yr (+$24/mo · 28.2%)
ⓘ Screening estimate from a state-policy table — verify with the county assessor before closing.
Climate risk First Street
- Flood 1/10 Low FEMA zone X (unshaded) · 0% chance over 30 yrs
- Wildfire 1/10 Low
- Heat 5/10 Major 7 d/yr ≥103°F today · 20 d/yr by 30 yrs out
- Wind 2/10 Low 100% chance of damaging wind over 30 yrs
- Air quality 3/10 Moderate 2 unhealthy d/yr today · 3 by 30 yrs out
Nearby sold comps map
Loading sold comps map…
Walkable amenities ~0.75 mi
Loading nearby amenities…
Taxation est. · year 1
- Rental income
- $26,549
- − Mortgage interest
- −$8,682
- − Property taxes
- −$1,040
- − Insurance
- −$775
- − Repairs & maintenance
- −$2,124
- − Management
- −$2,124
- − Depreciation
- −$4,509
- Taxable income
- $7,295
- Est. tax owed @ 24.0%
- −$1,751
- After-tax cash flow
- $7,654/yr
For passive investors: Depreciation is non-cash, so a rental often shows a tax loss while cash-flowing — sheltering income. Rental losses are passive: they offset passive income freely, and up to $25,000/yr can offset ordinary (W-2) income if you actively participate and your MAGI is under $100k (phasing out to $0 by $150k); unused losses carry forward. On sale, claimed depreciation is recaptured at up to 25%, and gains may owe capital-gains tax (a 1031 exchange can defer both). Figures are a year-1 estimate at your 24.0% rate — not tax advice; consult a CPA.
Schools (NCES district)
- District
- Covington Independent
- NCES district ID
- 2101350
- Math proficiency
- 10% ▼ -20.00%
- Reading proficiency
- 27% ▼ -14.00%
- Median HH income
- $33,681
- Composite
- 15.04/100
- National rank
- #9353
- State rank
- #162 of 165 in KY
Livability — Covington
- Score
- 86/100
- State rank
- #40
- US rank
- #376
Category grades
Schools grade is shown separately in the Schools card above.
Census & demographics
- Census place
- Covington, KY
- County
- Kenton County · 142,881 people
- City population
- 34,373
- Metro
- Cincinnati, OH-KY-IN
- Population (ZIP)
- 26,981
- Household income
- $69,970
- Rent vs Own
- Severe rent burden
- 1488.0
Population outlook (Kenton County) Hauer SSP2
- Today (2025)
- 174,205 people
- By 2030
- 177,897 · +2.1%
- By 2040
- 182,671 · +4.9%
- By 2050
- 183,543 · +5.4%
- By 2075
- 178,977 · +2.7%
- By 2100
- 159,920 · -8.2%
Race, ethnicity, and origin ACS 2023
- Neighborhood character
- Predominantly White (72%)
- Race & ethnicity
- White 72% Hispanic / Latino 12% Black 10% Two or more races 7% Asian 1%
- Hispanic origin (detail)
- Mexican 2%
- Common ancestry
- Lithuanian 2% Italian 1% Slovak 1%
- Foreign-born
- 7% · Canada
- Languages at home
- 90% English-only · Spanish 6% Other Indo-European 1%
Political lean MEDSL · Kenton
- 2024 margin
- Strong R (+21.7) · D 38.2% · R 59.9% · Other 1.9%
- 2008→2024 swing
- -0.9pp no change · 2008: -20.9pp · 2024: -21.7pp
- All cycles
- 2024: R+21.7 2020: R+19.3 2016: R+26.1 2012: R+24.3 2008: R+20.9
Not yet ingested
- Civics
- —
Market trends
- HPI YoY
- ▼ -215.20%
- Current HPI
- 237.0869
- Rent YoY
- ▲ 1.55%
- Metro
- Cincinnati, OH-KY-IN
- State GDP YoY
- ▲ 1.81%
- F500 in state
- 4
Industry mix (Fortune 500 HQ in KY)
| Industry | F500 HQs | Revenue |
|---|---|---|
| Healthcare | 1 | $118B |
|
||
| Food / Beverage | 1 | $7B |
|
||
Price history
+376.9% since first listed5 events — show timeline
- 2026-05-23 Listed $155,000 NKMLS
- 2017-05-31 Sold (MLS) $41,500 NKMLS
- 2016-12-15 Listed $52,900 NKMLS
- 2016-02-17 Sold (MLS) $30,000 NKMLS
- 2015-12-30 Listed $32,500 NKMLS
Property tax history
+15.3%/yrLatest (2025): $1,040 · +0.7% YoY. Source: county tax records.
Cash-flow waterfall
monthlySold comps — $/sqft
last 12 mo · ≤1 miLoading sold comps…