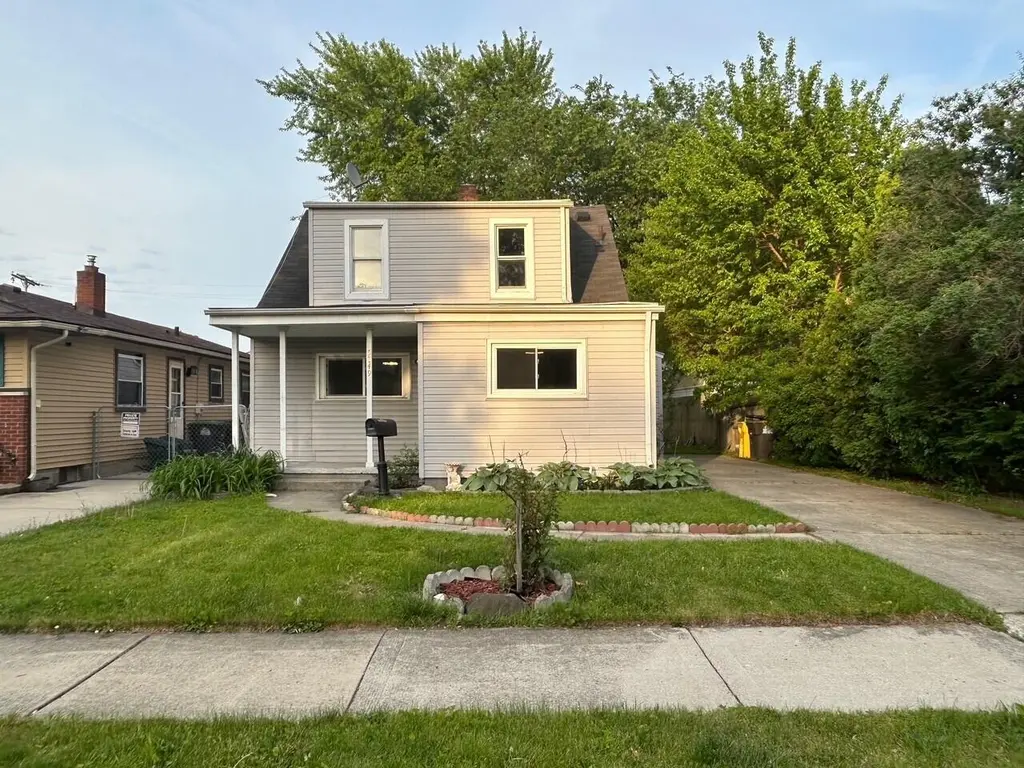
5849 Jackson St · Taylor, MI
Flood risk 1/10 · Minimal
- FEMA flood zone
- AE
- Chance of flooding over 30 yrs
- 0.0%
- Est. flood insurance / yr
- $1,737 – $8,500
Fire risk 1/10 · Minimal
- Est. fire insurance / yr
- $784 – $1,456
Heat risk 3/10 · Minor
- Hot days now (above 97°F)
- 7 days/yr
- Hot days in 30 yrs
- 15 days/yr
Wind risk 2/10 · Minimal
- Chance of severe wind over 30 yrs
- —
Air-quality risk 3/10 · Minor
- Unhealthy air days now
- 2 days/yr
- Unhealthy air days in 30 yrs
- 4 days/yr
Risk factors via First Street. Map © Google.
Why this score? — see what drove the B- grade
The composite is a weighted blend of 9 inputs, each scored 0–100. Each bar is that input's sub-score; the figure is the points it added to the 100-point composite (weight × sub-score).
- Cash flow +25.7/30.0
- ARV discount +14.6/15.0
- DSCR +8.5/10.0
- 1% rule +6.3/10.0
- Livability +3.8/5.0
- Rent growth +3.7/5.0
- Condition / age +2.5/5.0
- Schools +1.8/10.0
- Appreciation +0.0/10.0
$164,999
🖨 Deal sheet 📄 Offer letter ✓ Due diligence
Listing remarks MLS
Welcome to this beautifully updated 4-bedroom home offering space, and style! Featuring a convenient first-floor bedroom plus 3 additional bedrooms upstairs, this home offers a functional layout perfect for families, guests, or added flexibility. Since 2018, the property has seen extensive upgrades including updated kitchen cabinetry, renovated bathrooms, elegant marble flooring, and newer windows, creating a clean and modern feel throughout. With tasteful updates, generous living space, and move-in-ready condition, this vacant home is just waiting for its next family to make it their own. Priced at $179,000, this is a fantastic opportunity to own a beautifully improved home with immediate occupancy--schedule your showing today! all measurements approximate. BATVAI.
Key facts
- 5,227 sq ft lot
- Built 1939
- Listed 21 days
Property features AI
Exterior
- Home design: Colonial style; Single-family residence; Residential property
- Construction: Vinyl siding; Shingle roof; Built in 1939
- Exterior features: Public water
Interior
- Bathrooms: 2 full bathrooms
- Heating & cooling: Forced air heating
- Interior features: 7 total rooms; Crawl space basement
Neighborhood map
What this means for you Summary
Snapshot
- This is a 4-bed/2.0-bath single-family listed at $165k.
Deal economics
- At list price, monthly cash flow is $-34 ($-402/yr) — negative.
- To cash-flow at today's rent, offer at most $159k (3.6% below list).
- Meets the 1% rule at list price ($2k rent vs $165k).
- Recommended offer: $159k (3.6% below list) — sets the bar for cash-flow.
- Cap rate 9.2% vs local median 5.4% in Taylor — top-decile yield for the area; either an underpriced asset or a hidden risk that comps aren't pricing in. Stress-test before assuming the spread holds.
Location & tenants
- Location reads 76/100 on livability (#144 in MI, #3,684 nationally) — a middle-class / working-renter tenant base. Strengths: commute A+, cost of living A+, housing A+; Watch: employment D+, schools F, crime F.
- Taylor School District (urban): math 14% / reading 27% proficiency, ranked #462 of 540 in MI (top 86%) — low school quality limits family demand, transient renter base, plan for 1-2y turnover; 68% free/reduced lunch — lower-income household profile, screen leases tightly.
- Market conditions: Rents rising fast (+4.9%/yr); 281 active listings in the ZIP; 8 comparable units currently listed for rent nearby; rentals leasing fast (median 10d on market — plan ~1-2 weeks tenant-placement turnaround); 2,639 units permitted in Wayne County in 2024 (1,216 in 5+ unit buildings).
- This rent runs 37% of the median local income ($61k/yr) — at the standard rent-burdened threshold; future hikes will face affordability resistance.
Forward outlook
- Local home prices are declining (-3.0%/yr); year-one equity from $1k of loan paydown is wiped out by about $5k of value loss. Plan a longer hold.
- Wayne County population projected at -17% by 2050 — secular population decline; favor cash flow + early exit over multi-decade hold.
Negotiation context
- It's been on market 21 days — a 2% lower offer ($163k) is reasonable based on typical stale-listing flexibility.
- 7 sale attempts since 24y ago; this cycle's ask has dropped $14k (8%) from the opening price — seller is motivated, your offer sets the floor, not the list.
- Current owner paid $38k; list at $165k implies a 334% gain — meaningful room to come down on a strong offer.
Risks & watch-outs
- Watch-outs: flood insurance adds $427/mo; built in 1939 — expect roof / HVAC / electrical / plumbing capex.
- Climate carrying-cost: in FEMA flood zone AE (mandatory federal flood insurance) — expect insurance premiums to compound above CPI over the hold.
Questions for the listing agent
- What do current leases actually rent for vs. the listed asking? Can we see a recent rent roll and the last 12 months of T-12 income?
- Built in 1939 — when were the roof, HVAC, electrical panel, plumbing, and water heater last replaced?
- What's the actual annual flood-insurance premium (NFIP or private), and is the property in a SFHA with mandatory coverage?
- Is there a deadline driving the sale (1031 exchange, divorce, estate, relocation)? That informs how much negotiation room exists.
- Schools are F-rated, which usually means shorter tenancies and higher turnover. Who's the typical renter profile here, and what's been the actual vacancy rate?
- Crime grade is F in this area — have there been break-ins, vandalism, or insurance claims at this property in the last 3 years? What carrier currently insures it and at what premium?
- What's the average days-on-market for RENTAL listings here right now (not sales)? A rising rental-DOM trend means longer vacancies and softer asking-rent achievability than the comps imply.
- What's the recent tenant-quality profile in this submarket — average credit score on applications, eviction rate, late-payment / NSF rate, and stable-employment percentage? A property-management company in the area should have these aggregated.
- How much new for-sale + rental construction is in the pipeline within 1–3 miles? Heavy new supply typically softens prices + rents 12–24 months out; constrained supply supports both.
Investment metrics
- 1% rule
- 1.13% ✓
- Cap rate
- 9.15%
- Cash-on-cash
- 10.21%
- DSCR
- 1.45
- GRM
- 7.4
CMA / ARV
- ARV (on-the-fly)
- $195,750
- Comps found
- 12
Show comp detail 12 sales within ~0.75 mi
| Address | Dist | Beds/Ba | Sqft | Sold | Price | $/sf | Match |
|---|---|---|---|---|---|---|---|
| 5894 Balfour Ave | 0.27mi | 4/2.0 | 1,464 (-6%) | 2mo | $206,000 | $141 | 75 |
| 5375 Mayfair St | 0.27mi | 3/1.0 (-1) | 1,508 (-4%) | 0mo | $170,000 | $113 | 72 |
| 4833 Harding St | 0.62mi | 4/2.0 | 1,540 (-2%) | 2mo | $315,000 | $205 | 66 |
| 5416 Jackson St | 0.20mi | 3/1.5 (-1) | 1,770 (+13%) | 2mo | $221,450 | $125 | 60 |
| 6345 Kolb Ave | 0.53mi | 3/1.5 (-1) | 1,529 (-2%) | 5mo | $267,500 | $175 | 60 |
| 4641 Weddell St | 0.53mi | 3/2.0 (-1) | 1,652 (+6%) | 4mo | $125,000 | $76 | 58 |
| 5315 Edgewood St | 0.46mi | 3/1.0 (-1) | 1,651 (+5%) | 4mo | $145,000 | $88 | 57 |
| 4493 Culver St | 0.72mi | 3/1.0 (-1) | 1,543 (-2%) | 1mo | $187,000 | $121 | 54 |
| 4433 Mayfair St | 0.66mi | 3/1.5 (-1) | 1,475 (-6%) | 1mo | $196,000 | $133 | 52 |
| 4928 Culver St | 0.56mi | 3/2.0 (-1) | 1,407 (-10%) | 2mo | $205,000 | $146 | 51 |
| 4994 Campbell St | 0.66mi | 3/1.0 (-1) | 1,422 (-9%) | 1mo | $167,000 | $117 | 44 |
| 4701 Croissant St | 0.71mi | 3/1.0 (-1) | 1,768 (+13%) | 1mo | $180,000 | $102 | 35 |
Match score weights: distance 35% · size 25% · config 20% · recency 20%. Top-matched comps best support the ARV.
Projected returns pro-forma
-3.0% appreciation · 4.9% rent growth · sell at horizon
- IRR
- -14.8%
- Equity multiple
- 0.46×
- Total profit
- $-24,987
- Equity at exit
- $24,602
- IRR
- -2.3%
- Equity multiple
- 0.83×
- Total profit
- $-7,981
- Equity at exit
- $14,266
Cash invested: $46,200 (down + closing). Projections, not guarantees.
Landlord ↔ Tenant lean methodology
- Overall (STATE)
- 62 Landlord-Friendly
- State Michigan
- 62 Landlord-Friendly · EVEN
- County
- — inherits STATE
- City
- — inherits STATE
ZIP-level market 48180
- Rents YoY
- 4.9%
- Active inventory
- 281
- Price-to-rent
- 7.4×
Monthly cashflow live
- Estimated rent
- $1,865 high interval (Pro) →
- Mortgage (P&I)
- −$865
- Tax from tax record
- −$146 /mo · $1,755/yr
- Insurance
- −$69
- Flood insurance flood zone
- −$427 /mo · $5,118/yr
- HOA
- −$0
- Vacancy / Maint / Mgmt
- −$392
- Net cashflow
- $-34
Break-even live
UW: 25.0% down · 7.5% · 30yr · 1.5% tax · 5.0% vac · 8.0% maint · 8.0% mgmt
Financing live
Cash to close
- Down payment
- $41,250
- Closing costs
- $4,950
- Reserves months
- —
- Total cash needed
- —
Loan-product check · same deal, 3 products live
Conventional
25% down · 7.5% · 30yr
- Down + closing
- —
- Monthly P&I
- —
- Monthly cashflow
- —
- DSCR
- —
- Eligible?
- —
Personal DTI + credit; lowest rate.
DSCR
20% down · 8.5% · 30yr
- Down + closing
- —
- Monthly P&I
- —
- Monthly cashflow
- —
- DSCR
- —
- Eligible?
- —
No personal income docs; deal must DSCR.
Hard money
10% down · 12.0% · 12mo
- Down + closing
- —
- Monthly P&I
- —
- Monthly cashflow
- —
- DSCR
- —
- Eligible?
- —
Short-term bridge; refi at stabilization.
Rent comps 8 comps
| Address | Beds | Baths | Sqft | Rent | $/sqft | DOM | Units | Dist |
|---|---|---|---|---|---|---|---|---|
| 4631 Ziegler St Dearborn Heights, MI | 3.0 | 1.0 | 1050 | $1,650 | $1.57 | 43d | 1 | 0.53mi |
| 4565 Fleming St Dearborn Heights, MI | 3.0 | 1.0 | 1200 | $1,600 | $1.33 | 10d | 1 | 0.87mi |
| 18535 Audette St Dearborn, MI | 3.0 | 2.0 | 1957 | $2,000 | $1.02 | 1d | 1 | 1.02mi |
| 4934 McKinley St Dearborn Heights, MI | 3.0 | 1.0 | 1051 | $1,700 | $1.62 | 1d | 1 | 1.07mi |
| 20728 Carlysle St Dearborn, MI | 3.0 | 1.0 | 1087 | $1,850 | $1.70 | 1d | 1 | 1.12mi |
| 5503 Cranbrook St Dearborn Heights, MI | 3.0 | 2.5 | 2143 | $1,750 | $0.82 | 17d | 1 | 1.40mi |
| 3620 Monroe St Dearborn, MI | 3.0 | 2.0 | 1100 | $1,800 | $1.64 | 10d | 1 | 1.41mi |
| 15806 Meyer Ave Allen Park, MI | 3.0 | 2.0 | 1100 | $1,650 | $1.50 | 1d | 1 | 1.41mi |
Listing history 28 events
-
2026-06-13statusdays on market $164,999 Pending 21 DOM
-
2026-06-09days on market $164,999 Active 18 DOM
-
2026-06-08days on market $164,999 Active 17 DOM
-
2026-06-07days on market $164,999 Active 16 DOM
-
2026-06-04pricedays on market $164,999 Active 13 DOM
-
2026-06-03days on market $169,000 Active 12 DOM
-
2026-06-02days on market $169,000 Active 11 DOM
-
2026-06-01days on market $169,000 Active 10 DOM
-
2026-05-31days on market $169,000 Active 9 DOM
-
2026-05-22$179,000 Active
Show marketing remark (776 chars)
Welcome to this beautifully updated 4-bedroom home offering space, and style! Featuring a convenient first-floor bedroom plus 3 additional bedrooms upstairs, this home offers a functional layout perfect for families, guests, or added flexibility. Since 2018, the property has seen extensive upgrades including updated kitchen cabinetry, renovated bathrooms, elegant marble flooring, and newer windows, creating a clean and modern feel throughout. With tasteful updates, generous living space, and move-in-ready condition, this vacant home is just waiting for its next family to make it their own. Priced at $179,000, this is a fantastic opportunity to own a beautifully improved home with immediate occupancy--schedule your showing today! all measurements approximate. BATVAI.
-
2026-05-22$179,000 Active 776-char remark
Show marketing remark (776 chars)
Welcome to this beautifully updated 4-bedroom home offering space, and style! Featuring a convenient first-floor bedroom plus 3 additional bedrooms upstairs, this home offers a functional layout perfect for families, guests, or added flexibility. Since 2018, the property has seen extensive upgrades including updated kitchen cabinetry, renovated bathrooms, elegant marble flooring, and newer windows, creating a clean and modern feel throughout. With tasteful updates, generous living space, and move-in-ready condition, this vacant home is just waiting for its next family to make it their own. Priced at $179,000, this is a fantastic opportunity to own a beautifully improved home with immediate occupancy--schedule your showing today! all measurements approximate. BATVAI.
-
2018-09-11soldstatus $38,000 Sold
-
2018-09-11soldstatus $38,000 Closed
-
2018-08-29status Pending
-
2018-08-29status Pending
-
2018-08-28price $44,900
-
2018-08-27price $44,900
-
2018-08-06$49,900 Active
-
2018-08-06$49,900 Active
-
2018-08-06soldstatus $22,500
-
2002-06-18soldstatus $85,000
-
2002-06-15historical
-
2002-05-10soldstatus $85,000
-
2002-03-25historical
-
2002-02-17$89,900
-
2002-02-15$89,900
-
1997-07-10soldstatus $51,000
ⓘ Source: listings_history table (triggers on properties + properties_extension) + one-shot
backfill from property_details.listing_events for pre-trigger history.
Tax reassessment forecast MI · Partial reset (capped growth)
- Current annual tax
- $1,755 · $146/mo
- Projected year-2 tax
- $2,148 · $179/mo
- Expected delta
- +$393/yr (+$33/mo · 22.4%)
ⓘ Screening estimate from a state-policy table — verify with the county assessor before closing.
Climate risk First Street
- Flood 1/10 Low FEMA zone AE · 0% chance over 30 yrs
- Wildfire 1/10 Low
- Heat 3/10 Moderate 7 d/yr ≥97°F today · 15 d/yr by 30 yrs out
- Wind 2/10 Low
- Air quality 3/10 Moderate 2 unhealthy d/yr today · 4 by 30 yrs out
Nearby sold comps map
Loading sold comps map…
Walkable amenities ~0.75 mi
Loading nearby amenities…
Taxation est. · year 1
- Rental income
- $22,380
- − Mortgage interest
- −$9,243
- − Property taxes
- −$1,755
- − Insurance
- −$5,943
- − Repairs & maintenance
- −$1,790
- − Management
- −$1,790
- − Depreciation
- −$4,800
- Taxable loss
- −$2,943
- Est. tax savings @ 24.0%
- +$706
- After-tax cash flow
- $304/yr
For passive investors: Depreciation is non-cash, so a rental often shows a tax loss while cash-flowing — sheltering income. Rental losses are passive: they offset passive income freely, and up to $25,000/yr can offset ordinary (W-2) income if you actively participate and your MAGI is under $100k (phasing out to $0 by $150k); unused losses carry forward. On sale, claimed depreciation is recaptured at up to 25%, and gains may owe capital-gains tax (a 1031 exchange can defer both). Figures are a year-1 estimate at your 24.0% rate — not tax advice; consult a CPA.
Schools (NCES district)
- District
- Taylor School District
- NCES district ID
- 2633540
- Math proficiency
- 14% ▼ -7.00%
- Reading proficiency
- 27% ▼ -4.00%
- Median HH income
- $43,062
- Composite
- 17.62/100
- National rank
- #9034
- State rank
- #462 of 540 in MI
Livability — Taylor
- Score
- 76/100
- State rank
- #144
- US rank
- #3684
Category grades
Schools grade is shown separately in the Schools card above.
Census & demographics
- Census place
- Taylor, MI
- County
- Wayne County · 1,562,939 people
- City population
- 62,081
- Metro
- Detroit-Warren-Dearborn, MI
- Population (ZIP)
- 62,081
- Household income
- $61,081
- Rent vs Own
- Severe rent burden
- 1957.0
Population outlook (Wayne County) Hauer SSP2
- Today (2025)
- 1,675,273 people
- By 2030
- 1,620,300 · -3.3%
- By 2040
- 1,502,341 · -10.3%
- By 2050
- 1,384,039 · -17.4%
- By 2075
- 1,124,592 · -32.9%
- By 2100
- 881,193 · -47.4%
Race, ethnicity, and origin ACS 2023
- Neighborhood character
- Majority White (65%)
- Race & ethnicity
- White 65% Black 19% Two or more races 9% Hispanic / Latino 9% Asian 2%
- Hispanic origin (detail)
- Mexican 6% Puerto Rican 2%
- Common ancestry
- Romanian 8% Lithuanian 3% Slovak 2%
- Foreign-born
- 7% · Canada
- Languages at home
- 89% English-only · Spanish 4% Arabic 3% Other Indo-European 3%
Political lean MEDSL · Wayne
- 2024 margin
- Strong D (+29.0) · D 62.7% · R 33.7% · Other 3.6%
- 2008→2024 swing
- -20.5pp toward R · 2008: 49.5pp · 2024: 29.0pp
- All cycles
- 2024: D+29.0 2020: D+38.1 2016: D+37.3 2012: D+46.9 2008: D+49.5
Not yet ingested
- Civics
- —
Market trends
- HPI YoY
- ▼ -212.33%
- Current HPI
- 228.921
- Rent YoY
- ▲ 4.90%
- Metro
- Detroit-Warren-Dearborn, MI
- State GDP YoY
- ▲ 1.37%
- F500 in state
- 28
Industry mix (Fortune 500 HQ in MI)
| Industry | F500 HQs | Revenue |
|---|---|---|
| Automotive Parts | 3 | $48B |
|
||
| Automotive | 2 | $372B |
|
||
| Chemicals | 1 | $45B |
|
||
| Automotive Retail | 1 | $29B |
|
||
| Healthcare / Medical Devices | 1 | $23B |
|
||
| Automotive Technology | 1 | $20B |
|
||
Price history
+251.0% since first listed19 events — show timeline
- 2026-05-22 Listed $179,000 REALCOMP
- 2026-05-22 Listed $179,000 MiRealSource-MiMLS
- 2026-05-22 Listed $179,000 SW Michigan MLS
- 2018-09-11 Sold (MLS) $38,000 MiRealSource-MiMLS
- 2018-09-11 Sold (MLS) $38,000 REALCOMP
- 2018-08-29 Pending — MiRealSource-MiMLS
- 2018-08-29 Pending — REALCOMP
- 2018-08-28 Price Changed $44,900 MiRealSource-MiMLS
- 2018-08-27 Price Changed $44,900 REALCOMP
- 2018-08-06 Sold (Public Records) $22,500 Public Records
- 2018-08-06 Listed $49,900 MiRealSource-MiMLS
- 2018-08-06 Listed $49,900 REALCOMP
- 2002-06-18 Sold (Public Records) $85,000 Public Records
- 2002-06-15 Listing Removed — MiRealSource-MiMLS
- 2002-05-10 Sold (MLS) $85,000 MiRealSource-MiMLS
- 2002-03-25 Listing Removed — MiRealSource-MiMLS
- 2002-02-17 Listed $89,900 MiRealSource-MiMLS
- 2002-02-15 Listed $89,900 MiRealSource-MiMLS
- 1997-07-10 Sold (Public Records) $51,000 Public Records
Property tax history
-2.2%/yrLatest (2025): $1,755 · -35.2% YoY. Source: county tax records.
Cash-flow waterfall
monthlySold comps — $/sqft
last 12 mo · ≤1 miLoading sold comps…