433 Sylvan #120 · Mountain View, CA
Flood risk 1/10 · Minimal
- FEMA flood zone
- X
- Chance of flooding over 30 yrs
- 0.0%
- Est. flood insurance / yr
- $507 – $1,088
Fire risk 1/10 · Minimal
- Est. fire insurance / yr
- $659 – $1,223
Heat risk 4/10 · Minor
- Hot days now (above 92°F)
- 7 days/yr
- Hot days in 30 yrs
- 14 days/yr
Wind risk 1/10 · Minimal
- Chance of severe wind over 30 yrs
- —
Air-quality risk 7/10 · Major
- Unhealthy air days now
- 13 days/yr
- Unhealthy air days in 30 yrs
- 13 days/yr
Risk factors via First Street. Map © Google.
Why this score? — see what drove the A grade
The composite is a weighted blend of 9 inputs, each scored 0–100. Each bar is that input's sub-score; the figure is the points it added to the 100-point composite (weight × sub-score).
- Cash flow +30.0/30.0
- ARV discount +13.8/15.0
- DSCR +10.0/10.0
- 1% rule +8.9/10.0
- Schools +8.0/10.0
- Appreciation +4.5/10.0
- Livability +4.2/5.0
- Rent growth +3.4/5.0
- Condition / age +2.5/5.0
$279,000
🖨 Deal sheet 📄 Offer letter ✓ Due diligence
Listing remarks MLS
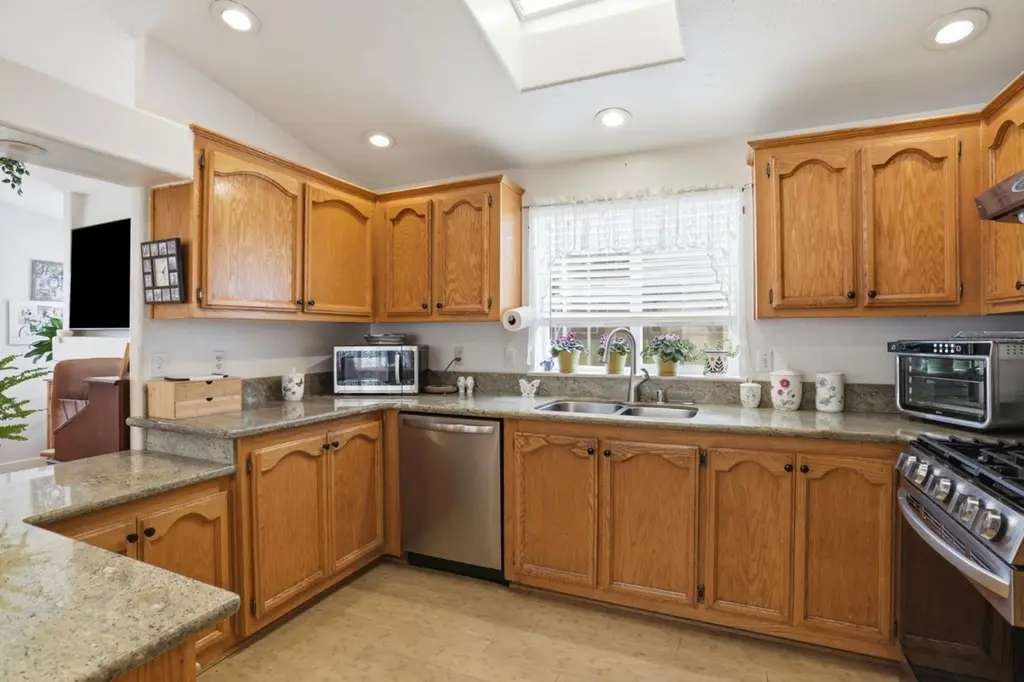
Super sweet home in the center of Mountain View! Enjoy the cool air of Mt. View on the porch. Then walk through the front door to beautiful open floor plan, Light floors updated granite counter tops and newer stainless steel appliances round out the front of this home, New paint interior 2 nice sized bedrooms 2 Baths and a laundry room with washer and dryer . Long driveway and beautiful landscaping, 1999 Silvercrest 7306952A/B
Key facts
- Open floor plan
- Built 1999
- Listed 36 days
Tags
Property features AI
Finance
- Other: Lot size source: Assessor; Tax type: Local property tax (LPT)
- HOA & community: Community pool; Clubhouse; Recreation room; Billiard room; Barbecue area; Car wash area; Common utility room; Organized activities; HOA rental restrictions and board approval required; Pets allowed; Senior community (one resident 55+)
Exterior
- Parking: Carport with tandem parking; 3-car carport (minimum); Assigned space number 120
- Utilities: Public sewer; Public water with individual water meter; Individual electric meters; Individual gas meters; Primary meter; Public utilities
- Home design: Manufactured home; Living area approximately 1,100
- Construction: Section serial numbers: 7306952A and 7306952B
- Exterior features: Composition roof; Leased land (park home site), unit will remain; Park entry directions available
Interior
- Kitchen: Granite countertops; Dishwasher; Garbage disposal; Microwave; Gas range/oven; Pantry cabinet; Refrigerator(s)
- Bedrooms: 2 bedrooms
- Flooring: Hardwood floors
- Bathrooms: 2 full bathrooms; Granite surfaces; Updated baths; Shower and tub
- Heating & cooling: Central forced air heating; Ceiling fan
- Interior features: High/vaulted ceilings; Skylight(s); Laundry room; Storage
- Laundry & utility: Washer and dryer included
Neighborhood map
What this means for you Summary
Snapshot
- This is a 2-bed/2.0-bath manufactured listed at $279k.
Deal economics
- At list price, monthly cash flow is $1k ($14k/yr) — positive.
- The deal already cash-flows at list — no discount required.
- Meets the 1% rule at list price ($4k rent vs $279k).
- Recommended offer: $271k (3.0% below list) — sets the bar for market timing.
- Cap rate 11.2% vs local median 1.4% in Mountain View — top-decile yield for the area; either an underpriced asset or a hidden risk that comps aren't pricing in. Stress-test before assuming the spread holds.
Location & tenants
- Location reads 84/100 on livability (#14 in CA, #671 nationally) — a professional / high-income tenant draw. Strengths: schools A+, amenities A+, commute A+; Watch: crime D+, cost of living F.
- Mountain View-Los Altos Union High (urban): math 77% / reading 86% proficiency, ranked #11 of 517 in CA (top 2%) — strong family-tenant draw, lease renewals of 3-5y typical.
- Market conditions: Rents rising (+3.4%/yr); 22 active listings in the ZIP; 40 comparable units currently listed for rent nearby; rentals leasing fast (median 2d on market — plan ~1-2 weeks tenant-placement turnaround); high-income renter base; 3,838 units permitted in Santa Clara County in 2024 (1,886 in 5+ unit buildings).
Forward outlook
- Local home prices are declining (-1.1%/yr); year-one equity from $2k of loan paydown is wiped out by about $3k of value loss. Plan a longer hold.
- Santa Clara County population projected at +24% by 2050 — long-run rental-demand tailwind backs the buy-and-hold thesis.
- At projected returns (-1.1% appreciation + 3.4% rent growth), your $78k cash investment doubles in ~6 years — after that, you're playing with house money.
Negotiation context
- It's been on market 36 days — a 3% lower offer ($271k) is reasonable based on typical stale-listing flexibility.
- 5 sale attempts since 20y ago with the ask held roughly flat each time — persistent listings suggest the price (not the market) is what's stuck; bring a comps-based counter.
- Current owner paid $169k; list at $279k implies a 65% gain — meaningful room to come down on a strong offer.
Questions for the listing agent
- It's been on market 36 days. Have you received any prior offers? Is the seller open to a 3% concession, seller financing, or rate buy-down credit?
- Is there a deadline driving the sale (1031 exchange, divorce, estate, relocation)? That informs how much negotiation room exists.
- Schools are A-rated — typically a magnet for longer-tenancy family renters. What's the average tenant stay here, and is there a school-zone premium baked into asking?
- Crime grade is D in this area — have there been break-ins, vandalism, or insurance claims at this property in the last 3 years? What carrier currently insures it and at what premium?
- What's the average days-on-market for RENTAL listings here right now (not sales)? A rising rental-DOM trend means longer vacancies and softer asking-rent achievability than the comps imply.
- What's the recent tenant-quality profile in this submarket — average credit score on applications, eviction rate, late-payment / NSF rate, and stable-employment percentage? A property-management company in the area should have these aggregated.
- How much new for-sale + rental construction is in the pipeline within 1–3 miles? Heavy new supply typically softens prices + rents 12–24 months out; constrained supply supports both.
Investment metrics
- 1% rule
- 1.39% ✓
- Cap rate
- 11.20%
- Cash-on-cash
- 17.51%
- DSCR
- 1.78
- GRM
- 6.0
CMA / ARV
- ARV (on-the-fly)
- $324,500
- Comps found
- 12
Show comp detail 12 sales within ~0.75 mi
| Address | Dist | Beds/Ba | Sqft | Sold | Price | $/sf | Match |
|---|---|---|---|---|---|---|---|
| 433 Sylvan Ave #112 | 0.00mi | 2/2.0 | 1,100 (0%) | 13mo | $311,500 | $283 | 89 |
| 325 Sylvan Ave #39 | 0.13mi | 2/2.0 | 1,100 (0%) | 9mo | $304,000 | $276 | 86 |
| 325 Sylvan Ave #23 | 0.13mi | 2/2.0 | 1,035 (-6%) | 1mo | $305,000 | $295 | 84 |
| 433 Sylvan Ave #105 | 0.05mi | 2/2.0 | 1,120 (+2%) | 20mo | $307,900 | $275 | 78 |
| 325 Sylvan Ave #89 | 0.13mi | 2/2.0 | 1,040 (-6%) | 13mo | $285,000 | $274 | 74 |
| 325 Sylvan Dr #78 | 0.13mi | 2/2.0 | 1,040 (-6%) | 20mo | $300,000 | $288 | 68 |
| 501 Moorpark Way #45 | 0.37mi | 2/2.0 | 1,040 (-6%) | 8mo | $399,000 | $384 | 67 |
| 325 Sylvan Ave #74 | 0.11mi | 3/2.0 (+1) | 1,050 (-4%) | 19mo | $310,000 | $295 | 66 |
| 191 E El Camino Real #213 | 0.70mi | 2/2.0 | 1,020 (-7%) | 1mo | $305,000 | $299 | 55 |
| 191 E El Camino Real #113 | 0.66mi | 2/2.0 | 1,100 (0%) | 20mo | $240,000 | $218 | 53 |
| 501 Moorpark Way #83 | 0.35mi | 3/2.0 (+1) | 1,212 (+10%) | 15mo | $400,000 | $330 | 49 |
| 191 E El Camino Real #200 | 0.66mi | 3/2.0 (+1) | 997 (-9%) | 16mo | $305,000 | $306 | 35 |
Match score weights: distance 35% · size 25% · config 20% · recency 20%. Top-matched comps best support the ARV.
Projected returns pro-forma
-1.06% appreciation · 3.44% rent growth · sell at horizon
- IRR
- 14.9%
- Equity multiple
- 1.67×
- Total profit
- $52,672
- Equity at exit
- $66,594
- IRR
- 21.1%
- Equity multiple
- 3.16×
- Total profit
- $168,737
- Equity at exit
- $69,288
Cash invested: $78,120 (down + closing). Projections, not guarantees.
Landlord ↔ Tenant lean methodology
- Overall (CITY)
- 0 Strongly Tenant-Friendly
- State California
- 18 Strongly Tenant-Friendly · D+13
- County
- — inherits STATE
- City Mountain View
- 0 Strongly Tenant-Friendly · D+34
ZIP-level market 94041
- Home prices YoY
- -0.3%
- Rents YoY
- 3.4%
- Active inventory
- 22
- Price-to-rent
- 6.0×
Monthly cashflow live
- Estimated rent
- $3,884 high interval (Pro) →
- Mortgage (P&I)
- −$1,463
- Tax est. 1.5%
- −$349 /mo · $4,185/yr
- Insurance
- −$116
- HOA
- −$0
- Vacancy / Maint / Mgmt
- −$816
- Net cashflow
- $1,140
Break-even live
UW: 25.0% down · 7.5% · 30yr · 1.5% tax · 5.0% vac · 8.0% maint · 8.0% mgmt
Financing live
Cash to close
- Down payment
- $69,750
- Closing costs
- $8,370
- Reserves months
- —
- Total cash needed
- —
Loan-product check · same deal, 3 products live
Conventional
25% down · 7.5% · 30yr
- Down + closing
- —
- Monthly P&I
- —
- Monthly cashflow
- —
- DSCR
- —
- Eligible?
- —
Personal DTI + credit; lowest rate.
DSCR
20% down · 8.5% · 30yr
- Down + closing
- —
- Monthly P&I
- —
- Monthly cashflow
- —
- DSCR
- —
- Eligible?
- —
No personal income docs; deal must DSCR.
Hard money
10% down · 12.0% · 12mo
- Down + closing
- —
- Monthly P&I
- —
- Monthly cashflow
- —
- DSCR
- —
- Eligible?
- —
Short-term bridge; refi at stabilization.
Rent comps 40 comps
| Address | Beds | Baths | Sqft | Rent | $/sqft | DOM | Units | Dist |
|---|---|---|---|---|---|---|---|---|
| 187 Acalanes Dr Sunnyvale, CA | 1.0 | 1.0 | 750 | $2,350 | $3.13 | 1d | 1 | 0.10mi |
| 817 E Dana St Unit 819 Mountain View, CA | 2.0 | 2.0 | 1200 | $4,395 | $3.66 | 1d | 1 | 0.13mi |
| 1260 Cortez Dr Unit 4 Sunnyvale, CA | 2.0 | 1.5 | 850 | $2,650 | $3.12 | 22d | 1 | 0.17mi |
| 1281 Ayala Dr Unit 04 Mountain View, CA | 1.0 | 1.0 | 700 | $2,300 | $3.29 | 22d | 1 | 0.20mi |
| 235 S Bernardo Ave Sunnyvale, CA | 1.0–2.0 | 1.0–2.0 | 782 | $4,417 | $5.64 | 1d | 8 | 0.27mi |
| 251 Arriba Dr #450 Sunnyvale, CA | 3.0 | 2.0 | 1300 | $4,970 | $3.82 | 1d | 1 | 0.27mi |
| 151 S Bernardo Ave Sunnyvale, CA | 1.0 | 1.0 | 800 | $3,195 | $3.99 | 1d | 1 | 0.29mi |
| 415 Acalanes Dr Sunnyvale, CA | 1.0 | 1.0 | 775 | $2,365 | $3.05 | 1d | 1 | 0.31mi |
| 555 E Evelyn Ave Mountain View, CA | 3.0 | 1.0–2.0 | 903 | $6,015 | $6.66 | 1d | 18 | 0.32mi |
| 1223 W McKinley Ave Unit 3 Sunnyvale, CA | 2.0 | 1.0 | 1100 | $3,099 | $2.82 | 1d | 1 | 0.33mi |
| 435 Acalanes Dr Unit 435-22 Sunnyvale, CA | 2.0 | 1.0 | 875 | $2,595 | $2.97 | 3d | 1 | 0.35mi |
| 870 E El Camino Real Mountain View, CA | 1.0–2.0 | 1.0–2.0 | 784 | $3,325 | $4.24 | 1d | 4 | 0.39mi |
| 600 Rainbow Dr Mountain View, CA | 1.0–2.0 | 1.0–2.0 | 880 | $4,848 | $5.51 | 1d | 4 | 0.41mi |
| 415 S Bernardo Ave Sunnyvale, CA | 2.0 | 2.0 | 1000 | $3,195 | $3.19 | 1d | 1 | 0.44mi |
| 471 Acalanes Dr Sunnyvale, CA | 1.0 | 1.0 | 830 | $2,595 | $3.13 | 7d | 1 | 0.44mi |
| 150 Paseo Ct Mountain View, CA | 3.0 | 2.0 | 1288 | $4,550 | $3.53 | 10d | 1 | 0.49mi |
| 179 Georgetown Ct Mountain View, CA | 3.0 | 3.0 | 1288 | $5,000 | $3.88 | 3d | 1 | 0.53mi |
| 881 E El Camino Real Mountain View, CA | 2.0 | 2.0 | 1079 | $6,042 | $5.60 | 1d | 1 | 0.55mi |
| 451 Carneros Ave Apt B Sunnyvale, CA | 2.0 | 1.0 | 800 | $3,395 | $4.24 | 2d | 1 | 0.57mi |
| 1025 Williams Way Unit 4 Mountain View, CA | 2.0 | 1.0 | 920 | $2,900 | $3.15 | 1d | 1 | 0.64mi |
| 1050 Crestview Dr Mountain View, CA | 1.0–2.0 | 1.0–2.0 | 1004 | $4,850 | $4.83 | 1d | 6 | 0.66mi |
| 1033 Crestview Dr #303 Mountain View, CA | 2.0 | 2.0 | 1140 | $3,550 | $3.11 | 23d | 1 | 0.70mi |
| 243 Buena Vista Ave Sunnyvale, CA | 1.0–2.0 | 1.0–2.0 | 785 | $4,368 | $5.56 | 1d | 6 | 0.72mi |
| 100 N Whisman Rd Mountain View, CA | 1.0–2.0 | 1.0–1.5 | 909 | $4,248 | $4.67 | 1d | 6 | 0.73mi |
| 1000 Escalon Ave Sunnyvale, CA | 1.0–2.0 | 1.0–2.0 | 815 | $4,350 | $5.34 | 1d | 1 | 0.75mi |
| 707 Continental Cir Mountain View, CA | 1.0–2.0 | 1.0–2.0 | 810 | $4,771 | $5.89 | 1d | 25 | 0.76mi |
| 151 Calderon Ave Mountain View, CA | 2.0 | 1.0 | 589 | $4,355 | $7.39 | 1d | 1 | 0.76mi |
| 695 S Knickerbocker Dr #15 Sunnyvale, CA | 2.0 | 2.5 | 1257 | $4,200 | $3.34 | 10d | 1 | 0.77mi |
| 110 Paul Ave Mountain View, CA | 2.0 | 1.0 | 838 | $4,100 | $4.89 | 3d | 1 | 0.78mi |
| 1200 Dale Ave Mountain View, CA | 2.0 | 2.0 | 940 | $4,795 | $5.10 | 1d | 1 | 0.80mi |
| 745 S Bernardo Ave Sunnyvale, CA | 1.0 | 1.0 | 767 | $3,644 | $4.75 | 1d | 5 | 0.80mi |
| 465 Calderon Ave #1640 Mountain View, CA | 2.0 | 1.0 | 850 | $4,580 | $5.39 | 20d | 1 | 0.84mi |
| 217 Ada Ave #37 Mountain View, CA | 3.0 | 2.5 | 1484 | $5,400 | $3.64 | 1d | 1 | 0.86mi |
| 991 Belmont Ter #3 Sunnyvale, CA | 2.0 | 2.5 | 1483 | $4,650 | $3.14 | 1d | 1 | 0.89mi |
| 955 Escalon Ave Sunnyvale, CA | 1.0–2.0 | 1.0–2.0 | 780 | $3,350 | $4.29 | 1d | 1 | 0.91mi |
| 395 Ano Nuevo Ave Sunnyvale, CA | 1.0 | 1.0 | 710 | $2,700 | $3.80 | 1d | 1 | 0.93mi |
| 15 Cassandra Way #1607 Mountain View, CA | 2.0 | 2.0 | 992 | $6,770 | $6.82 | 1d | 1 | 0.97mi |
| 437 Costa Mesa Ter Unit F Sunnyvale, CA | 2.0 | 2.0 | 1012 | $3,875 | $3.83 | 14d | 1 | 0.98mi |
| 935 La Mesa Ter Unit 1 Sunnyvale, CA | 2.0 | 1.0 | 854 | $4,000 | $4.68 | 1d | 1 | 1.01mi |
| 225 Pamela Dr Mountain View, CA | 2.0 | 1.0–2.0 | 733 | $4,800 | $6.55 | 1d | 1 | 1.01mi |
Listing history 30 events
-
2026-06-18days on market $279,000 Active 36 DOM
-
2026-06-17days on market $279,000 Active 35 DOM
-
2026-06-16days on market $279,000 Active 34 DOM
-
2026-06-15days on market $279,000 Active 33 DOM
-
2026-06-13days on market $279,000 Active 31 DOM
-
2026-06-13days on market $279,000 Active 30 DOM
-
2026-06-09days on market $279,000 Active 27 DOM
-
2026-06-08days on market $279,000 Active 26 DOM
-
2026-06-07days on market $279,000 Active 25 DOM
-
2026-06-05days on market $279,000 Active 22 DOM
-
2026-06-03days on market $279,000 Active 21 DOM
-
2026-06-02days on market $279,000 Active 20 DOM
-
2026-06-01days on market $279,000 Active 19 DOM
-
2026-05-31days on market $279,000 Active 18 DOM
-
2026-05-13$279,000 Active 430-char remark
Show marketing remark (430 chars)
Super sweet home in the center of Mountain View! Enjoy the cool air of Mt. View on the porch. Then walk through the front door to beautiful open floor plan, Light floors updated granite counter tops and newer stainless steel appliances round out the front of this home, New paint interior 2 nice sized bedrooms 2 Baths and a laundry room with washer and dryer . Long driveway and beautiful landscaping, 1999 Silvercrest 7306952A/B
-
2014-12-10historical 269-char remark
Show marketing remark (269 chars)
Walk in to this home, It has NEW PAINT INSIDE AND OUT, NEW CARPET, NEW TILE, NEWER APPLIANCES. Get a new home for an old price. 1999 Silvercrest SN# 17306952 A/B Open house 11/1 & 11/2 1:00- 4:00 We will be going over all offers on 11/9/14 Don't miss out.
-
2014-11-12historical Contingent 269-char remark
Show marketing remark (269 chars)
Walk in to this home, It has NEW PAINT INSIDE AND OUT, NEW CARPET, NEW TILE, NEWER APPLIANCES. Get a new home for an old price. 1999 Silvercrest SN# 17306952 A/B Open house 11/1 & 11/2 1:00- 4:00 We will be going over all offers on 11/9/14 Don't miss out.
-
2014-11-12soldstatus $169,000 Sold 269-char remark
Show marketing remark (269 chars)
Walk in to this home, It has NEW PAINT INSIDE AND OUT, NEW CARPET, NEW TILE, NEWER APPLIANCES. Get a new home for an old price. 1999 Silvercrest SN# 17306952 A/B Open house 11/1 & 11/2 1:00- 4:00 We will be going over all offers on 11/9/14 Don't miss out.
-
2014-10-31$149,000 Active 269-char remark
Show marketing remark (269 chars)
Walk in to this home, It has NEW PAINT INSIDE AND OUT, NEW CARPET, NEW TILE, NEWER APPLIANCES. Get a new home for an old price. 1999 Silvercrest SN# 17306952 A/B Open house 11/1 & 11/2 1:00- 4:00 We will be going over all offers on 11/9/14 Don't miss out.
-
2009-04-23historical
-
2009-04-22soldstatus $65,000 Sold
-
2009-03-26historical
-
2009-03-03price $82,500
-
2009-02-13price $89,950
-
2009-01-16price $88,000
-
2008-09-02$94,950
-
2006-07-24historical
-
2006-07-02soldstatus $109,900
-
2006-02-06$109,900
ⓘ Source: listings_history table (triggers on properties + properties_extension) + one-shot
backfill from property_details.listing_events for pre-trigger history.
Climate risk First Street
- Flood 1/10 Low FEMA zone X · 0% chance over 30 yrs
- Wildfire 1/10 Low
- Heat 4/10 Moderate 7 d/yr ≥92°F today · 14 d/yr by 30 yrs out
- Wind 1/10 Low
- Air quality 7/10 Severe 13 unhealthy d/yr today · 13 by 30 yrs out
Nearby sold comps map
Loading sold comps map…
Walkable amenities ~0.75 mi
Loading nearby amenities…
Taxation est. · year 1
- Rental income
- $46,603
- − Mortgage interest
- −$15,628
- − Property taxes
- −$4,185
- − Insurance
- −$1,395
- − Repairs & maintenance
- −$3,728
- − Management
- −$3,728
- − Depreciation
- −$8,116
- Taxable income
- $9,822
- Est. tax owed @ 24.0%
- −$2,357
- After-tax cash flow
- $11,322/yr
For passive investors: Depreciation is non-cash, so a rental often shows a tax loss while cash-flowing — sheltering income. Rental losses are passive: they offset passive income freely, and up to $25,000/yr can offset ordinary (W-2) income if you actively participate and your MAGI is under $100k (phasing out to $0 by $150k); unused losses carry forward. On sale, claimed depreciation is recaptured at up to 25%, and gains may owe capital-gains tax (a 1031 exchange can defer both). Figures are a year-1 estimate at your 24.0% rate — not tax advice; consult a CPA.
Schools (NCES district)
- District
- Mountain View-Los Altos Union High
- NCES district ID
- 0626310
- Math proficiency
- 77% ▲ 9.00%
- Reading proficiency
- 86% ▲ 4.00%
- Median HH income
- $161,233
- Composite
- 79.5/100
- National rank
- #59
- State rank
- #11 of 517 in CA
Livability — Mountain View
- Score
- 84/100
- State rank
- #14
- US rank
- #671
Category grades
Schools grade is shown separately in the Schools card above.
Census & demographics
- Census place
- Mountain View, CA
- County
- Santa Clara County · 1,806,974 people
- City population
- 84,858
- Metro
- San Jose-Sunnyvale-Santa Clara, CA
- Population (ZIP)
- 16,050
- Household income
- $178,558
- Rent vs Own
- Severe rent burden
- 981.0
Population outlook (Santa Clara County) Hauer SSP2
- Today (2025)
- 2,179,074 people
- By 2030
- 2,301,297 · +5.6%
- By 2040
- 2,528,195 · +16.0%
- By 2050
- 2,712,135 · +24.5%
- By 2075
- 2,998,701 · +37.6%
- By 2100
- 2,931,429 · +34.5%
Race, ethnicity, and origin ACS 2023
- Neighborhood character
- Highly diverse neighborhood (Simpson 0.71)
- Race & ethnicity
- White 37% Hispanic / Latino 28% Asian 27% Two or more races 13% Black 2% Native American 1%
- Hispanic origin (detail)
- Mexican 17%
- Common ancestry
- Italian 3% Romanian 2% Lithuanian 2%
- Foreign-born
- 39% · Canada, China, Jamaica
- Languages at home
- 50% English-only · Spanish 20% Chinese 11% Other Indo-European 7%
Political lean MEDSL · Santa Clara
- 2024 margin
- Solid D (+40.0) · D 68.1% · R 28.1% · Other 3.8%
- 2008→2024 swing
- -0.9pp no change · 2008: 40.9pp · 2024: 40.0pp
- All cycles
- 2024: D+40.0 2020: D+47.4 2016: D+52.5 2012: D+42.1 2008: D+40.9
Not yet ingested
- Civics
- —
Market trends
- HPI YoY
- ▼ -1.06%
- Current HPI
- 399.4625
- Rent YoY
- ▲ 3.44%
- Metro
- San Jose-Sunnyvale-Santa Clara, CA
- State GDP YoY
- ▲ 3.21%
- F500 in state
- 116
Industry mix (Fortune 500 HQ in CA)
| Industry | F500 HQs | Revenue |
|---|---|---|
| Technology | 27 | $1,492B |
|
||
| Financial Services | 3 | $174B |
|
||
| Retail | 3 | $44B |
|
||
| Insurance | 3 | $26B |
|
||
| Media / Entertainment | 2 | $115B |
|
||
| Pharmaceuticals / Biotech | 2 | $62B |
|
||
Price history
+153.9% since first listed16 events — show timeline
- 2026-05-13 Listed $279,000 MLSListings
- 2026-05-13 Listed $279,000 bridgeMLS, Bay East AOR, or Contra Costa AOR
- 2014-12-10 Listing Removed — MLSListings
- 2014-11-12 Contingent — MLSListings
- 2014-11-12 Sold (MLS) $169,000 MLSListings
- 2014-10-31 Listed $149,000 MLSListings
- 2009-04-23 Listing Removed — MLSListings
- 2009-04-22 Sold (MLS) $65,000 MLSListings
- 2009-03-26 Contingent — MLSListings
- 2009-03-03 Price Changed $82,500 MLSListings
- 2009-02-13 Price Changed $89,950 MLSListings
- 2009-01-16 Price Changed $88,000 MLSListings
- 2008-09-02 Listed $94,950 MLSListings
- 2006-07-24 Listing Removed — MLSListings
- 2006-07-02 Sold (MLS) $109,900 MLSListings
- 2006-02-06 Listed $109,900 MLSListings
Cash-flow waterfall
monthlySold comps — $/sqft
last 12 mo · ≤1 miLoading sold comps…