25320 Clubside Dr · North Olmsted, OH
Flood risk No data
- FEMA flood zone
- —
- Chance of flooding over 30 yrs
- —
- Est. flood insurance / yr
- —
Fire risk No data
- Est. fire insurance / yr
- —
Heat risk No data
- Hot days now (above threshold)
- —
- Hot days in 30 yrs
- —
Wind risk No data
- Chance of severe wind over 30 yrs
- —
Air-quality risk No data
- Unhealthy air days now
- —
- Unhealthy air days in 30 yrs
- —
Risk factors via First Street. Map © Google.
Why this score? — see what drove the B+ grade
The composite is a weighted blend of 9 inputs, each scored 0–100. Each bar is that input's sub-score; the figure is the points it added to the 100-point composite (weight × sub-score).
- Cash flow +30.0/30.0
- ARV discount +15.0/15.0
- DSCR +10.0/10.0
- 1% rule +8.8/10.0
- Schools +4.7/10.0
- Livability +4.3/5.0
- Rent growth +3.0/5.0
- Condition / age +2.8/5.0
- Appreciation +0.0/10.0
$165,000
🖨 Deal sheet 📄 Offer letter ✓ Due diligence
Key facts
- Built 1968
- Listed 4 days
Neighborhood map
What this means for you Summary
Snapshot
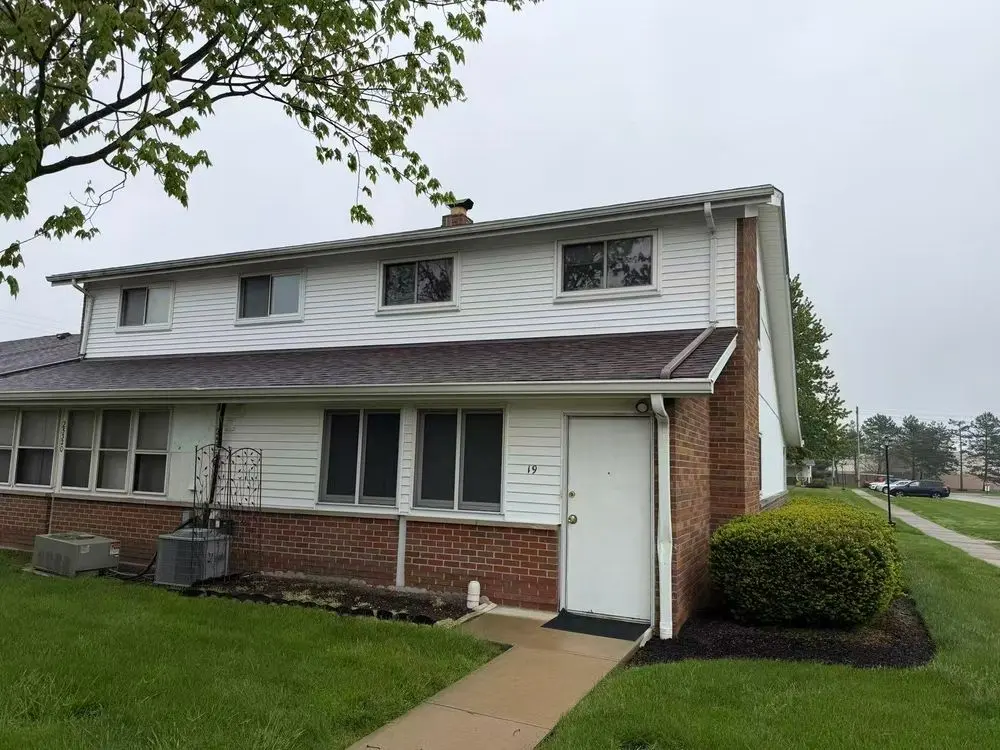
- This is a 3-bed/2.0-bath townhouse listed at $165k. Condition is rated average.
Deal economics
- At list price, monthly cash flow is $660 ($8k/yr) — positive.
- The deal already cash-flows at list — no discount required.
- Meets the 1% rule at list price ($2k rent vs $165k).
- Cap rate 11.1% vs local median 4.0% in North Olmsted — top-decile yield for the area; either an underpriced asset or a hidden risk that comps aren't pricing in. Stress-test before assuming the spread holds.
Location & tenants
- Location reads 86/100 on livability (#38 in OH, #372 nationally) — a professional / high-income tenant draw. Strengths: crime A+, amenities A+, employment A+; Watch: commute F.
- North Olmsted City (suburban): math 51% / reading 57% proficiency, ranked #368 of 656 in OH (top 56%) — acceptable for families but not a draw, mixed tenant base, ~2y average lease.
- Market conditions: Rents rising (+1.9%/yr); 159 active listings in the ZIP; 4 comparable units currently listed for rent nearby; rentals lingering (median 44d on market — plan ~5-8 weeks vacancy on turnover, expect pricing pressure); 75% of comp listings sitting > 30 days — soft ceiling on asking rent; solid renter incomes; 1,441 units permitted in Cuyahoga County in 2024 (700 in 5+ unit buildings).
- This rent runs 32% of the median local income ($84k/yr) — at the standard rent-burdened threshold; future hikes will face affordability resistance.
Forward outlook
- Local home prices are declining (-3.0%/yr); year-one equity from $1k of loan paydown is wiped out by about $5k of value loss. Plan a longer hold.
- Cuyahoga County population projected to shrink 8% by 2050 — rents likely to lag national; underwrite the cash flow, not the appreciation.
- At projected returns (-3.0% appreciation + 1.9% rent growth), your $46k cash investment doubles in ~8 years — after that, you're playing with house money.
Negotiation context
- Only 4 days on market — expect competitive offers; lowballing is unlikely to land.
- 3 sale attempts since 21y ago with the ask held roughly flat each time — persistent listings suggest the price (not the market) is what's stuck; bring a comps-based counter.
Questions for the listing agent
- Built in 1968 — when were the roof, HVAC, electrical panel, plumbing, and water heater last replaced?
- Is there a deadline driving the sale (1031 exchange, divorce, estate, relocation)? That informs how much negotiation room exists.
- Schools are B-rated — typically a magnet for longer-tenancy family renters. What's the average tenant stay here, and is there a school-zone premium baked into asking?
- What's the average days-on-market for RENTAL listings here right now (not sales)? A rising rental-DOM trend means longer vacancies and softer asking-rent achievability than the comps imply.
- What's the recent tenant-quality profile in this submarket — average credit score on applications, eviction rate, late-payment / NSF rate, and stable-employment percentage? A property-management company in the area should have these aggregated.
- How much new for-sale + rental construction is in the pipeline within 1–3 miles? Heavy new supply typically softens prices + rents 12–24 months out; constrained supply supports both.
Investment metrics
- 1% rule
- 1.38% ✓
- Cap rate
- 11.09%
- Cash-on-cash
- 17.15%
- DSCR
- 1.76
- GRM
- 6.0
CMA / ARV
- ARV (on-the-fly)
- $211,200
- Comps found
- 12
Show comp detail 12 sales within ~0.75 mi
| Address | Dist | Beds/Ba | Sqft | Sold | Price | $/sf | Match |
|---|---|---|---|---|---|---|---|
| 25515 Clubside Blvd #0012 | 0.17mi | 3/2.0 | 1,480 (-8%) | 1mo | $173,000 | $117 | 78 |
| 25400 Country Club Blvd #2 | 0.11mi | 3/1.5 | 1,480 (-8%) | 5mo | $170,000 | $115 | 77 |
| 25555 Country Club Blvd | 0.22mi | 3/2.0 | 1,430 (-11%) | 2mo | $170,000 | $119 | 71 |
| 25315 Country Club Blvd #9 | 0.11mi | 3/1.5 | 1,480 (-8%) | 16mo | $152,000 | $103 | 68 |
| 25305 Country Club Blvd #2 | 0.15mi | 3/1.5 | 1,480 (-8%) | 14mo | $168,000 | $114 | 67 |
| 25395 Country Club Blvd #12 | 0.15mi | 3/1.5 | 1,480 (-8%) | 16mo | $160,000 | $108 | 65 |
| 332 Vista Cir Unit 50A | 0.59mi | 2/2.0 (-1) | 1,588 (-1%) | 19mo | $210,000 | $132 | 50 |
| 54 Vista Cir | 0.54mi | 2/2.0 (-1) | 1,379 (-14%) | 1mo | $258,000 | $187 | 46 |
| 254 Vista Cir | 0.56mi | 2/2.0 (-1) | 1,438 (-10%) | 10mo | $230,000 | $160 | 44 |
| 375 Vista Cir Unit 23C | 0.62mi | 2/2.0 (-1) | 1,425 (-11%) | 10mo | $254,000 | $178 | 40 |
| 244 Vista Cir | 0.55mi | 2/2.0 (-1) | 1,438 (-10%) | 21mo | $238,000 | $166 | 35 |
| 353 Vista Cir Unit 25B | 0.62mi | 2/2.0 (-1) | 1,379 (-14%) | 13mo | $237,500 | $172 | 32 |
Match score weights: distance 35% · size 25% · config 20% · recency 20%. Top-matched comps best support the ARV.
Projected returns pro-forma
-3.0% appreciation · 1.85% rent growth · sell at horizon
- IRR
- 7.2%
- Equity multiple
- 1.28×
- Total profit
- $12,734
- Equity at exit
- $24,602
- IRR
- 15.4%
- Equity multiple
- 2.19×
- Total profit
- $54,912
- Equity at exit
- $14,266
Cash invested: $46,200 (down + closing). Projections, not guarantees.
Landlord ↔ Tenant lean methodology
- Overall (STATE)
- 73 Landlord-Friendly
- State Ohio
- 73 Landlord-Friendly · R+6
- County
- — inherits STATE
- City
- — inherits STATE
ZIP-level market 44070
- Rents YoY
- 1.9%
- Active inventory
- 159
- Price-to-rent
- 6.0×
Monthly cashflow live
- Estimated rent
- $2,279 medium interval (Pro) →
- Mortgage (P&I)
- −$865
- Tax est. 1.5%
- −$206 /mo · $2,475/yr
- Insurance
- −$69
- HOA
- −$0
- Vacancy / Maint / Mgmt
- −$479
- Net cashflow
- $660
Break-even live
UW: 25.0% down · 7.5% · 30yr · 1.5% tax · 5.0% vac · 8.0% maint · 8.0% mgmt
Financing live
Cash to close
- Down payment
- $41,250
- Closing costs
- $4,950
- Reserves months
- —
- Total cash needed
- —
Loan-product check · same deal, 3 products live
Conventional
25% down · 7.5% · 30yr
- Down + closing
- —
- Monthly P&I
- —
- Monthly cashflow
- —
- DSCR
- —
- Eligible?
- —
Personal DTI + credit; lowest rate.
DSCR
20% down · 8.5% · 30yr
- Down + closing
- —
- Monthly P&I
- —
- Monthly cashflow
- —
- DSCR
- —
- Eligible?
- —
No personal income docs; deal must DSCR.
Hard money
10% down · 12.0% · 12mo
- Down + closing
- —
- Monthly P&I
- —
- Monthly cashflow
- —
- DSCR
- —
- Eligible?
- —
Short-term bridge; refi at stabilization.
Rent comps 4 comps
| Address | Beds | Baths | Sqft | Rent | $/sqft | DOM | Units | Dist |
|---|---|---|---|---|---|---|---|---|
| 5785 Fitch Rd North Olmsted, OH | 2.0 | 1.0 | 1080 | $1,650 | $1.53 | 43d | 1 | 0.72mi |
| 25151 Brookpark Rd North Olmsted, OH | 1.0–2.0 | 1.0 | 945 | $1,617 | $1.71 | 1d | 1 | 0.73mi |
| 5334 Sunset Oval North Olmsted, OH | 4.0 | 2.5 | 1924 | $3,500 | $1.82 | 43d | 1 | 0.74mi |
| 4238 Porter Rd North Olmsted, OH | 3.0 | 1.0 | 1240 | $1,980 | $1.60 | 43d | 1 | 1.40mi |
Listing history 3 events
-
2026-06-08days on market $165,000 Active 4 DOM
-
2026-06-07days on market $165,000 Active 3 DOM
-
2026-06-05$165,000 Active 1 DOM
ⓘ Source: listings_history table (triggers on properties + properties_extension) + one-shot
backfill from property_details.listing_events for pre-trigger history.
Nearby sold comps map
Loading sold comps map…
Walkable amenities ~0.75 mi
Loading nearby amenities…
Taxation est. · year 1
- Rental income
- $27,348
- − Mortgage interest
- −$9,243
- − Property taxes
- −$2,475
- − Insurance
- −$825
- − Repairs & maintenance
- −$2,188
- − Management
- −$2,188
- − Depreciation
- −$4,800
- Taxable income
- $5,630
- Est. tax owed @ 24.0%
- −$1,351
- After-tax cash flow
- $6,570/yr
For passive investors: Depreciation is non-cash, so a rental often shows a tax loss while cash-flowing — sheltering income. Rental losses are passive: they offset passive income freely, and up to $25,000/yr can offset ordinary (W-2) income if you actively participate and your MAGI is under $100k (phasing out to $0 by $150k); unused losses carry forward. On sale, claimed depreciation is recaptured at up to 25%, and gains may owe capital-gains tax (a 1031 exchange can defer both). Figures are a year-1 estimate at your 24.0% rate — not tax advice; consult a CPA.
Condition & rehab AI · 5 photos
This townhouse is in good condition with a good exterior and roof. It has potential for a fresh coat of paint and landscaping improvements to boost its value.
Value-add opportunities
- Both Paint the exterior siding — Fresh paint can enhance curb appeal and property value
- Both Landscaping improvements — A well-maintained garden can increase both resale and rental value
Renovation cost estimate screening
Value-add ROI direction
- Both Paint the exterior siding — Fresh paint can enhance curb appeal and property value ↑
- Both Landscaping improvements — A well-maintained garden can increase both resale and rental value ↑
ⓘ Cost ranges are severity-bucket heuristics (US national rule-of-thumb). Get contractor quotes + a written scope before underwriting a rehab budget.
Schools (NCES district)
- District
- North Olmsted City
- NCES district ID
- 3904452
- Math proficiency
- 51% ▼ -17.00%
- Reading proficiency
- 57% ▼ -7.00%
- Median HH income
- $59,338
- Composite
- 46.98/100
- National rank
- #2353
- State rank
- #368 of 656 in OH
Livability — North Olmsted
- Score
- 86/100
- State rank
- #38
- US rank
- #372
Category grades
Schools grade is shown separately in the Schools card above.
Census & demographics
- Census place
- North Olmsted, OH
- County
- Cuyahoga County · 1,090,369 people
- City population
- 31,924
- Metro
- Cleveland-Elyria, OH
- Population (ZIP)
- 31,924
- Household income
- $84,363
- Rent vs Own
- Severe rent burden
- 667.0
Population outlook (Cuyahoga County) Hauer SSP2
- Today (2025)
- 1,244,621 people
- By 2030
- 1,230,093 · -1.2%
- By 2040
- 1,189,108 · -4.5%
- By 2050
- 1,145,706 · -7.9%
- By 2075
- 1,076,557 · -13.5%
- By 2100
- 978,987 · -21.3%
Race, ethnicity, and origin ACS 2023
- Neighborhood character
- Predominantly White (85%)
- Race & ethnicity
- White 85% Hispanic / Latino 7% Two or more races 6% Asian 3% Black 2%
- Hispanic origin (detail)
- Mexican 3% Puerto Rican 3%
- Common ancestry
- Romanian 9% Slovak 2% Lithuanian 1%
- Foreign-born
- 8% · Canada
- Languages at home
- 88% English-only · Spanish 3% Other Indo-European 3% Arabic 3%
Political lean MEDSL · Cuyahoga
- 2024 margin
- Solid D (+31.5) · D 65.4% · R 33.9%
- 2008→2024 swing
- -7.4pp toward R · 2008: 38.9pp · 2024: 31.5pp
- All cycles
- 2024: D+31.5 2020: D+34.1 2016: D+35.0 2012: D+38.7 2008: D+38.9
Not yet ingested
- Civics
- —
Market trends
- HPI YoY
- ▼ -243.21%
- Current HPI
- 214.2257
- Rent YoY
- ▲ 1.85%
- Metro
- Cleveland-Elyria, OH
- State GDP YoY
- ▲ 1.98%
- F500 in state
- 48
Industry mix (Fortune 500 HQ in OH)
| Industry | F500 HQs | Revenue |
|---|---|---|
| Insurance | 3 | $145B |
|
||
| Industrial Machinery | 3 | $49B |
|
||
| Financial Services | 3 | $24B |
|
||
| Consumer Goods | 2 | $93B |
|
||
| Aerospace / Defense | 2 | $47B |
|
||
| Utilities | 2 | $33B |
|
||
Price history
+65.2% since first listed5 events — show timeline
- 2026-06-04 Listed $165,000 ForSaleByOwner.com
- 2012-03-30 Listing Removed — MLSNOW
- 2011-04-05 Listed $65,000 MLSNOW
- 2005-07-23 Listing Removed — MLSNOW
- 2005-01-23 Listed $99,900 MLSNOW
Cash-flow waterfall
monthlySold comps — $/sqft
last 12 mo · ≤1 miLoading sold comps…