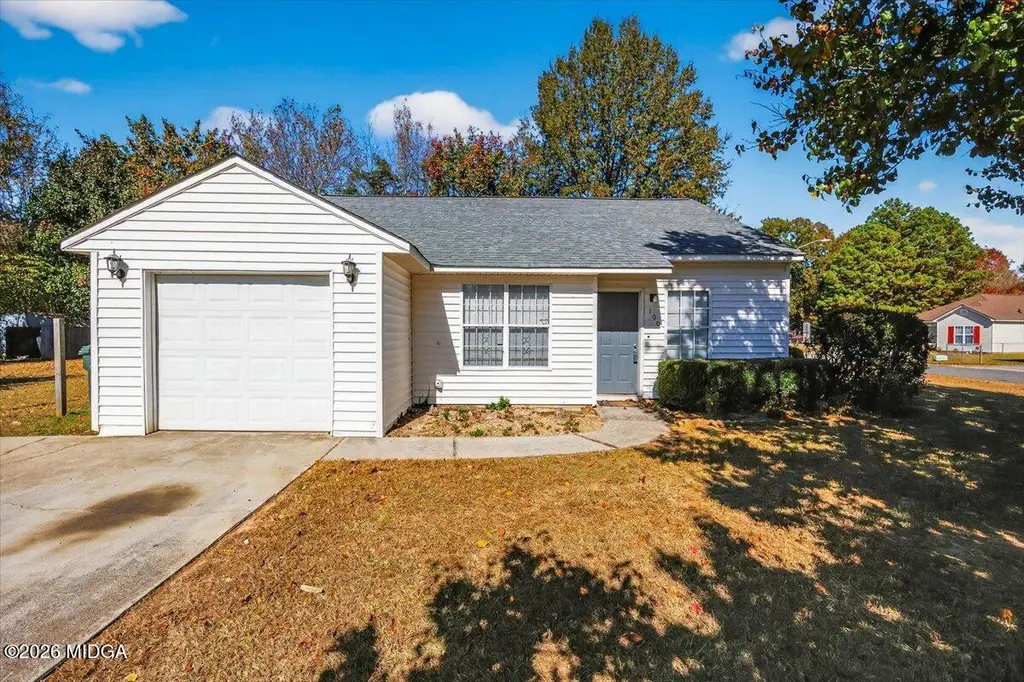
100 Mauldon Ct · Warner Robins, GA
Flood risk 1/10 · Minimal
- FEMA flood zone
- X (unshaded)
- Chance of flooding over 30 yrs
- 0.0%
- Est. flood insurance / yr
- $507 – $1,088
Fire risk 3/10 · Minor
- Est. fire insurance / yr
- $963 – $1,789
Heat risk 7/10 · Major
- Hot days now (above 108°F)
- 7 days/yr
- Hot days in 30 yrs
- 19 days/yr
Wind risk 6/10 · Moderate
- Chance of severe wind over 30 yrs
- 73.0%
Air-quality risk 3/10 · Minor
- Unhealthy air days now
- 2 days/yr
- Unhealthy air days in 30 yrs
- 4 days/yr
Risk factors via First Street. Map © Google.
Why this score? — see what drove the D grade
The composite is a weighted blend of 9 inputs, each scored 0–100. Each bar is that input's sub-score; the figure is the points it added to the 100-point composite (weight × sub-score).
- Cash flow +19.0/30.0
- DSCR +6.0/10.0
- 1% rule +4.2/10.0
- Schools +3.9/10.0
- Rent growth +3.2/5.0
- Livability +3.2/5.0
- Condition / age +2.5/5.0
- ARV discount +0.0/15.0
- Appreciation +0.0/10.0
$149,999
🖨 Deal sheet (PDF) 📄 Offer letter ✓ Due diligence
Listing remarks MLS
This sweet 3-bedroom, 2-bathroom home sits on a spacious corner lot and offers a fantastic opportunity—whether you're looking for an investment property or your next home! Recent updates include a roof, flooring, and paint throughout—all less than a couple years old. Don't miss out on this well-maintained property with great potential!
Key facts
- 0.29 acre lot
- Garage
- Built 1991
Property features AI
Finance
- Other: Located in Honey Ridge subdivision; Address: 100 Mauldon Ct, Warner Robins, GA 31093
- HOA & community: No homeowners association; No community amenities listed
Exterior
- Parking: Attached garage (1 parking space)
- Utilities: Public water; Public sewer (connected); Electricity available; Cable available
- Home design: Single-family house; One story; Resale property
- Construction: Built in 1991; Vinyl siding; Composition roof; Slab foundation
- Exterior features: Corner, level lot; Grassed yard; Outbuilding; Has view
Interior
- Kitchen: Dishwasher; Refrigerator
- Bedrooms: 3 bedrooms on the main level
- Flooring: Other
- Bathrooms: 2 full bathrooms, both on the main level
- Heating & cooling: Electric heating; Electric cooling
- Interior features: Soaking tub; Family room
- Laundry & utility: Laundry closet
Neighborhood map
What this means for you Summary
Snapshot
- This is a 3-bed/2.0-bath single-family listed at $150k.
Deal economics
- At list price, monthly cash flow is $156 ($2k/yr) — positive.
- The deal already cash-flows at list — no discount required.
- To meet the 1% rule (rent ≥ 1% of price), the offer needs to be $137k (8.5% below list).
- Recommended offer: $137k (8.5% below list) — sets the bar for 1% rule.
- Cap rate 7.5% vs local median 4.9% in Warner Robins — top-decile yield for the area; either an underpriced asset or a hidden risk that comps aren't pricing in. Stress-test before assuming the spread holds.
Location & tenants
- Location reads 65/100 on livability (#227 in GA) — a middle-class / working-renter tenant base. Strengths: cost of living A+, housing A+, health & safety A+; Watch: employment D+, crime F, amenities F.
- Houston County (urban): math 43% / reading 46% proficiency, ranked #23 of 174 in GA (top 13%) — families likely to look elsewhere, expect single-tenant / working-renter base with shorter leases.
- Zoned schools: Parkwood Elementary School (math 21% / reading 18%, grade F, #878 of 1,228 statewide, top 75%, 671 students, 84% FRL); Northside Middle School (math 29% / reading 31%, grade F, #243 of 470 statewide, top 53%, 844 students, 84% FRL); Northside High School (math 5% / reading 21%, grade F, #331 of 424 statewide, top 78%, 1,959 students, 84% FRL) — zoned schools average 84% FRL vs 46% district-wide (38 pts higher); higher-poverty schools than district average — tighter screening recommended.
- Zoned-school proficiency averages 21% at this address vs 44% district-wide (-24 pts) — the specific schools serving this property underperform the Houston County average; the district grade overstates school quality for this exact location.
- Market conditions: Rents rising (+2.8%/yr); 166 active listings in the ZIP; 37 comparable units currently listed for rent nearby; rentals at typical pace (median 23d on market — plan ~3-4 weeks tenant-placement turnaround); 46% of comp listings sitting > 30 days — soft ceiling on asking rent; 1,545 units permitted in Houston County in 2024 (336 in 5+ unit buildings).
- This rent runs 36% of the median local income ($46k/yr) — at the standard rent-burdened threshold; future hikes will face affordability resistance.
Forward outlook
- Local home prices are declining (-3.0%/yr); year-one equity from $1k of loan paydown is wiped out by about $4k of value loss. Plan a longer hold.
- Houston County population projected at +22% by 2050 — long-run rental-demand tailwind backs the buy-and-hold thesis.
Negotiation context
- It's been on market 23 days — a 2% lower offer ($148k) is reasonable based on typical stale-listing flexibility.
- 11 sale attempts since 13y ago with the ask held roughly flat each time — persistent listings suggest the price (not the market) is what's stuck; bring a comps-based counter.
- Current owner paid $120k; 25% above their basis — modest negotiation headroom, anchor on the comps not their cost.
Risks & watch-outs
- Climate carrying-cost: major wind risk, 73% chance of damaging wind over 30y; extreme-heat days projected 7→19/yr by 2055 (HVAC capex compounding) — expect insurance premiums to compound above CPI over the hold.
Questions for the listing agent
- Is there a deadline driving the sale (1031 exchange, divorce, estate, relocation)? That informs how much negotiation room exists.
- Schools are D-rated, which usually means shorter tenancies and higher turnover. Who's the typical renter profile here, and what's been the actual vacancy rate?
- Crime grade is F in this area — have there been break-ins, vandalism, or insurance claims at this property in the last 3 years? What carrier currently insures it and at what premium?
- The area grade is low — what's the realistic commute time and amenity access for the typical tenant pool here? Any planned neighborhood developments (good or bad) we should know about?
- What's the average days-on-market for RENTAL listings here right now (not sales)? A rising rental-DOM trend means longer vacancies and softer asking-rent achievability than the comps imply.
- What's the recent tenant-quality profile in this submarket — average credit score on applications, eviction rate, late-payment / NSF rate, and stable-employment percentage? A property-management company in the area should have these aggregated.
- How much new for-sale + rental construction is in the pipeline within 1–3 miles? Heavy new supply typically softens prices + rents 12–24 months out; constrained supply supports both.
Investment metrics
- 1% rule
- 0.92% ✗
- Cap rate
- 7.54%
- Cash-on-cash
- 4.46%
- DSCR
- 1.20
- GRM
- 9.1
CMA / ARV
- ARV (on-the-fly)
- $105,534
- Comps found
- 12
Show comp detail 12 sales within ~0.75 mi
| Address | Dist | Beds/Ba | Sqft | Sold | Price | $/sf | Match |
|---|---|---|---|---|---|---|---|
| 210 Crescent Dr | 0.36mi | 3/1.0 | 1,032 (-3%) | 5mo | $60,000 | $58 | 70 |
| 105 Angela Ave | 0.59mi | 3/2.0 | 1,075 (+1%) | 4mo | $107,000 | $100 | 68 |
| 105 Flanders Dr | 0.50mi | 3/1.0 | 1,096 (+3%) | 1mo | $122,500 | $112 | 67 |
| 104 Dudley St | 0.54mi | 3/1.5 | 1,096 (+3%) | 2mo | $155,000 | $141 | 67 |
| 239 Ward St | 0.26mi | 3/1.0 | 1,176 (+10%) | 3mo | $95,000 | $81 | 64 |
| 505 American Blvd | 0.57mi | 3/2.0 | 1,122 (+5%) | 1mo | $170,000 | $152 | 64 |
| 406 Ward St | 0.41mi | 3/1.0 | 984 (-8%) | 1mo | $84,000 | $85 | 63 |
| 300 Ward St | 0.31mi | 3/1.0 | 962 (-10%) | 3mo | $55,000 | $57 | 63 |
| 113 Briarwood Dr | 0.59mi | 3/2.0 | 1,126 (+6%) | 4mo | $95,000 | $84 | 60 |
| 102 Camellia Cir | 0.66mi | 3/1.0 | 991 (-7%) | 1mo | $98,000 | $99 | 52 |
| 213 Oklahoma Ave | 0.57mi | 3/1.5 | 1,196 (+12%) | 3mo | $137,700 | $115 | 49 |
| 202 Elmwood St | 0.72mi | 2/1.0 (-1) | 1,115 (+5%) | 3mo | $45,000 | $40 | 48 |
Match score weights: distance 35% · size 25% · config 20% · recency 20%. Top-matched comps best support the ARV.
Projected returns pro-forma
-3.0% appreciation · 2.78% rent growth · sell at horizon
- IRR
- -9.6%
- Equity multiple
- 0.65×
- Total profit
- $-14,715
- Equity at exit
- $22,365
- IRR
- -0.5%
- Equity multiple
- 0.97×
- Total profit
- $-1,438
- Equity at exit
- $12,969
Cash invested: $42,000 (down + closing). Projections, not guarantees.
Landlord ↔ Tenant lean methodology
- Overall (STATE)
- 90 Strongly Landlord-Friendly
- State Georgia
- 90 Strongly Landlord-Friendly · R+3
- County
- — inherits STATE
- City
- — inherits STATE
ZIP-level market 31093
- Rents YoY
- 2.8%
- Active inventory
- 166
- Price-to-rent
- 9.1×
Monthly cashflow live
- Estimated rent
- $1,373 high interval (Pro) →
- Mortgage (P&I)
- −$787
- Tax from tax record
- −$79 /mo · $950/yr
- Insurance
- −$62
- HOA
- −$0
- Vacancy / Maint / Mgmt
- −$288
- Net cashflow
- $156
Break-even live
Sensitivity live
| Price | -10% $241 | -5% $199 | +0% $156 | +5% $114 | +10% $71 |
|---|---|---|---|---|---|
| Rent | -10% $48 | -5% $102 | +0% $156 | +5% $210 | +10% $265 |
| Rate | -1.0pp $232 | -0.5pp $194 | base $156 | +0.5pp $117 | +1.0pp $78 |
UW: 25.0% down · 7.5% · 30yr · 1.5% tax · 5.0% vac · 8.0% maint · 8.0% mgmt
Financing live
Cash to close
- Down payment
- $37,500
- Closing costs
- $4,500
- Reserves months
- —
- Total cash needed
- —
Loan-product check · same deal, 3 products live
Conventional
25% down · 7.5% · 30yr
- Down + closing
- —
- Monthly P&I
- —
- Monthly cashflow
- —
- DSCR
- —
- Eligible?
- —
Personal DTI + credit; lowest rate.
DSCR
20% down · 8.5% · 30yr
- Down + closing
- —
- Monthly P&I
- —
- Monthly cashflow
- —
- DSCR
- —
- Eligible?
- —
No personal income docs; deal must DSCR.
Hard money
10% down · 12.0% · 12mo
- Down + closing
- —
- Monthly P&I
- —
- Monthly cashflow
- —
- DSCR
- —
- Eligible?
- —
Short-term bridge; refi at stabilization.
Rent comps 37 comps
| Address | Beds | Baths | Sqft | Rent | $/sqft | DOM | Units | Dist |
|---|---|---|---|---|---|---|---|---|
| 404 Dunmurry Pl Warner Robins, GA | 3.0 | 2.0 | 1293 | $1,575 | $1.22 | 15d | 1 | 0.06mi |
| 705 American Blvd Warner Robins, GA | 3.0 | 2.0 | 1100 | $1,275 | $1.16 | 15d | 1 | 0.11mi |
| 650 American Blvd Warner Robins, GA | 3.0 | 1.0 | 925 | $1,200 | $1.30 | 23d | 1 | 0.15mi |
| 716 American Blvd Warner Robins, GA | 3.0 | 1.5 | 1235 | $1,400 | $1.13 | 23d | 1 | 0.16mi |
| 213 Johns Rd Warner Robins, GA | 2.0 | 1.0 | 888 | $1,175 | $1.32 | 15d | 1 | 0.19mi |
| 302 Hawaii Ave Unit D Warner Robins, GA | 3.0 | 2.0 | 1190 | $1,500 | $1.26 | 15d | 1 | 0.27mi |
| 302 Hawaii Ave Unit C Warner Robins, GA | 2.0 | 1.0 | 981 | $1,200 | $1.22 | 15d | 1 | 0.27mi |
| 316 Oklahoma Ave Warner Robins, GA | 3.0 | 1.5 | 1196 | $1,200 | $1.00 | 23d | 1 | 0.38mi |
| 316 Oklahoma Ave Warner Robins, GA | 3.0 | 1.5 | 1196 | $1,200 | $1.00 | 46d | 1 | 0.38mi |
| 114 Dixie Trl Warner Robins, GA | 3.0 | 2.0 | 980 | $1,250 | $1.28 | 23d | 1 | 0.42mi |
| 600 Arizona Ave Warner Robins, GA | 1.0–3.0 | 1.0–1.5 | 912 | $1,100 | $1.21 | 15d | 29 | 0.53mi |
| 106 National Ave Warner Robins, GA | 3.0 | 1.0 | 984 | $1,250 | $1.27 | 46d | 1 | 0.54mi |
| 202 Ruzelle St Warner Robins, GA | 3.0 | 1.0 | 962 | $1,175 | $1.22 | 46d | 1 | 0.54mi |
| 119 Keith Dr Warner Robins, GA | 3.0 | 2.0 | 1122 | $1,175 | $1.05 | 46d | 1 | 0.55mi |
| 122 Briarwood Dr Warner Robins, GA | 4.0 | 2.0 | 1218 | $1,195 | $0.98 | 23d | 1 | 0.57mi |
| 124 Briarwood Dr Warner Robins, GA | 3.0 | 2.0 | 1134 | $1,500 | $1.32 | 46d | 1 | 0.57mi |
| 136 Oscar Ct Warner Robins, GA | 3.0 | 2.0 | 1395 | $1,400 | $1.00 | 46d | 1 | 0.64mi |
| 310 Northlake Dr Warner Robins, GA | 1.0–2.0 | 1.0–1.5 | 825 | $1,250 | $1.52 | 15d | 23 | 0.66mi |
| 206 Northlake Dr Warner Robins, GA | 1.0–3.0 | 1.0–2.0 | 942 | $1,225 | $1.30 | 15d | 10 | 0.71mi |
| 1005 Elberta Rd Warner Robins, GA | 1.0–2.0 | 1.0 | 620 | $1,045 | $1.68 | 46d | 19 | 0.71mi |
| 202 Wendan Way Warner Robins, GA | 4.0 | 1.0 | 1036 | $1,075 | $1.04 | 15d | 1 | 0.80mi |
| 613 Greenbriar Rd Warner Robins, GA | 1.0–2.0 | 1.0 | 712 | $925 | $1.30 | 15d | 7 | 0.84mi |
| 319 Orchard Ln Warner Robins, GA | 3.0 | 1.0 | 950 | $1,400 | $1.47 | 46d | 1 | 0.97mi |
| 318 Bruce St Warner Robins, GA | 3.0 | 1.0 | 960 | $1,150 | $1.20 | 46d | 1 | 1.01mi |
| 119 Vicki Lynn Dr Warner Robins, GA | 1.0–3.0 | 1.0–2.0 | 962 | $1,199 | $1.25 | 46d | 81 | 1.03mi |
| 119 Vicki Lynn Dr Warner Robins, GA | 1.0–3.0 | 1.0–2.0 | 962 | $1,139 | $1.18 | 15d | 9 | 1.03mi |
| 646 Gawin Dr Warner Robins, GA | 2.0 | 1.5 | 1050 | $1,025 | $0.98 | 46d | 1 | 1.06mi |
| 607 McArthur Blvd Warner Robins, GA | 2.0 | 1.0 | 804 | $1,250 | $1.55 | 23d | 1 | 1.19mi |
| 607 McArthur Blvd Warner Robins, GA | 2.0 | 1.0 | 804 | $1,250 | $1.55 | 46d | 1 | 1.19mi |
| 116 Vickie Dr Warner Robins, GA | 3.0 | 1.5 | 1056 | $1,300 | $1.23 | 46d | 1 | 1.19mi |
| 116 Vickie Dr Warner Robins, GA | 3.0 | 1.5 | 1056 | $1,300 | $1.23 | 23d | 1 | 1.19mi |
| 111 Marilyn Dr Warner Robins, GA | 3.0 | 1.0 | 912 | $1,175 | $1.29 | 23d | 1 | 1.26mi |
| 111 Marilyn Dr Warner Robins, GA | 3.0 | 1.0 | 912 | $1,250 | $1.37 | 46d | 1 | 1.26mi |
| 314 McArthur Blvd Warner Robins, GA | 3.0 | 1.0 | 1100 | $1,400 | $1.27 | 46d | 1 | 1.34mi |
| 115 Arnold Blvd Warner Robins, GA | 3.0 | 2.0 | 1037 | $1,300 | $1.25 | 46d | 1 | 1.35mi |
| 1436 Watson Blvd Warner Robins, GA | 2.0 | 1.5 | 1044 | $1,042 | $1.00 | 15d | 8 | 1.49mi |
| 1436 Watson Blvd Warner Robins, GA | 2.0 | 1.5 | 1044 | $1,070 | $1.02 | 46d | 6 | 1.49mi |
Listing history 19 events
-
2026-06-21days on market $149,999 Active 23 DOM
-
2026-06-19days on market $149,999 Active 21 DOM
-
2026-06-18days on market $149,999 Active 20 DOM
-
2026-06-17days on market $149,999 Active 19 DOM
-
2026-06-16days on market $149,999 Active 18 DOM
-
2026-06-15days on market $149,999 Active 17 DOM
-
2026-06-14days on market $149,999 Active 15 DOM
-
2026-06-13statusdays on market $149,999 Active 14 DOM
-
2026-06-10days on market $149,999 New 12 DOM
-
2026-06-09days on market $149,999 New 11 DOM
-
2026-06-08days on market $149,999 New 10 DOM
-
2026-06-07days on market $149,999 New 9 DOM
-
2026-06-05days on market $149,999 New 6 DOM
-
2026-06-03days on market $149,999 New 5 DOM
-
2026-06-02days on market $149,999 New 4 DOM
-
2026-06-01days on market $149,999 New 3 DOM
-
2026-05-31days on market $149,999 New 2 DOM
-
2026-05-30remarks 340-char remark
-
2026-05-30$149,999 New 1 DOM
ⓘ Source: listings_history table (triggers on properties + properties_extension) + one-shot
backfill from property_details.listing_events for pre-trigger history.
Tax reassessment forecast GA · Resets to sale price
- Current annual tax
- $950 · $79/mo
- Projected year-2 tax
- $1,380 · $115/mo
- Expected delta
- +$430/yr (+$36/mo · 45.2%)
ⓘ Screening estimate from a state-policy table — verify with the county assessor before closing.
Climate risk First Street
- Flood 1/10 Low FEMA zone X (unshaded) · 0% chance over 30 yrs
- Wildfire 3/10 Moderate
- Heat 7/10 Severe 7 d/yr ≥108°F today · 19 d/yr by 30 yrs out
- Wind 6/10 Major 73% chance of damaging wind over 30 yrs
- Air quality 3/10 Moderate 2 unhealthy d/yr today · 4 by 30 yrs out
Nearby sold comps map
Loading sold comps map…
Walkable amenities ~0.75 mi
Loading nearby amenities…
Taxation est. · year 1
- Rental income
- $16,472
- − Mortgage interest
- −$8,402
- − Property taxes
- −$950
- − Insurance
- −$750
- − Repairs & maintenance
- −$1,318
- − Management
- −$1,318
- − Depreciation
- −$4,364
- Taxable loss
- −$630
- Est. tax savings @ 24.0%
- +$151
- After-tax cash flow
- $2,024/yr
For passive investors: Depreciation is non-cash, so a rental often shows a tax loss while cash-flowing — sheltering income. Rental losses are passive: they offset passive income freely, and up to $25,000/yr can offset ordinary (W-2) income if you actively participate and your MAGI is under $100k (phasing out to $0 by $150k); unused losses carry forward. On sale, claimed depreciation is recaptured at up to 25%, and gains may owe capital-gains tax (a 1031 exchange can defer both). Figures are a year-1 estimate at your 24.0% rate — not tax advice; consult a CPA.
Schools (NCES district)
- District
- Houston County
- NCES district ID
- 1302880
- Math proficiency
- 43% ▼ -7.00%
- Reading proficiency
- 46% ▼ -2.00%
- Median HH income
- $54,823
- Composite
- 38.68/100
- National rank
- #4144
- State rank
- #23 of 174 in GA
Livability — Warner Robins
- Score
- 65/100
- State rank
- #227
- US rank
- #13290
Category grades
Schools grade is shown separately in the Schools card above.
Census & demographics
- Census place
- Warner Robins, GA
- County
- Houston County · 157,321 people
- City population
- 92,102
- Metro
- Warner Robins, GA
- Population (ZIP)
- 26,872
- Household income
- $45,991
- Rent vs Own
- Severe rent burden
- 1516.0
Population outlook (Houston County) Hauer SSP2
- Today (2025)
- 169,502 people
- By 2030
- 178,486 · +5.3%
- By 2040
- 194,642 · +14.8%
- By 2050
- 207,119 · +22.2%
- By 2075
- 231,480 · +36.6%
- By 2100
- 235,034 · +38.7%
Race, ethnicity, and origin ACS 2023
- Neighborhood character
- Diverse neighborhood (Simpson 0.64)
- Race & ethnicity
- Black 47% White 35% Hispanic / Latino 10% Two or more races 7% Asian 1%
- Hispanic origin (detail)
- Mexican 5%
- Common ancestry
- Iranian 1% Serbian 1% Italian 1%
- Foreign-born
- 6% · Canada, Vietnam, South Korea
- Languages at home
- 91% English-only · Spanish 8%
Political lean MEDSL · Houston
- 2024 margin
- R (+11.3) · D 44.0% · R 55.3%
- 2008→2024 swing
- +8.9pp toward D · 2008: -20.2pp · 2024: -11.3pp
- All cycles
- 2024: R+11.3 2020: R+12.4 2016: R+21.6 2012: R+20.7 2008: R+20.2
Not yet ingested
- Civics
- —
Market trends
- HPI YoY
- ▼ -130.35%
- Current HPI
- 222.1627
- Rent YoY
- ▲ 2.78%
- Metro
- Warner Robins, GA
- State GDP YoY
- ▲ 2.66%
- F500 in state
- 28
Industry mix (Fortune 500 HQ in GA)
| Industry | F500 HQs | Revenue |
|---|---|---|
| Paper / Packaging | 2 | $29B |
|
||
| Retail | 1 | $160B |
|
||
| Transportation / Logistics | 1 | $91B |
|
||
| Airlines | 1 | $62B |
|
||
| Consumer Goods | 1 | $47B |
|
||
| Utilities | 1 | $25B |
|
||
Price history
+132.6% since first listed29 events — show timeline
- 2026-05-29 Relisted — CGMLS
- 2026-05-29 Listed $149,999 MGMLS
- 2026-04-21 Delisted — CGMLS
- 2026-04-21 Listing Removed — GAMLS
- 2026-02-02 Price Changed $149,999 GAMLS
- 2026-01-22 Price Changed $149,999 MGMLS
- 2025-12-10 Rental Removed — TURBOTENANT
- 2025-11-20 Price Changed $159,000 MGMLS
- 2025-11-20 Price Changed $159,000 GAMLS
- 2025-11-20 Listed $149,999 CGMLS
- 2025-11-17 Listed for Rent — TURBOTENANT
- 2025-10-10 Listed $149,999 GAMLS
- 2025-10-10 Listed $170,000 GAMLS
- 2023-04-12 Sold (Public Records) $120,000 Public Records
- 2023-04-10 Sold (MLS) $120,000 CGMLS
- 2023-04-10 Sold (MLS) $120,000 GAMLS
- 2023-04-01 Pending — CGMLS
- 2023-04-01 Pending — GAMLS
- 2023-03-29 Relisted — CGMLS
- 2023-03-29 Relisted — GAMLS
- 2023-03-24 Pending — GAMLS
- 2023-03-24 Pending — CGMLS
- 2023-03-21 Listed $114,100 GAMLS
- 2023-03-20 Listed $114,100 CGMLS
- 2014-02-21 Sold (MLS) $25,000 CGMLS
- 2013-10-27 Listed $29,900 CGMLS
- 2013-06-17 Sold (Public Records) $60,467 Public Records
- 2007-01-17 Sold (Public Records) $75,000 Public Records
- 1999-03-15 Sold (Public Records) $64,500 Public Records
Property tax history
+6.7%/yrLatest (2025): $950 · +9.4% YoY. Source: county tax records.
Cash-flow waterfall
monthlySold comps — $/sqft
last 12 mo · ≤1 miLoading sold comps…