 🏗️ New Construction
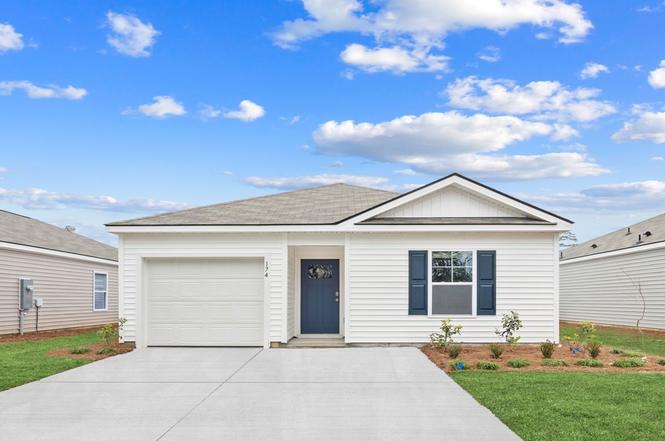
Helena Plan · Hardeeville, SC
Flood risk 1/10 · Minimal
- FEMA flood zone
- X (unshaded)
- Chance of flooding over 30 yrs
- 0.0%
- Est. flood insurance / yr
- $507 – $1,088
Fire risk 4/10 · Minor
- Est. fire insurance / yr
- $783 – $1,453
Heat risk 9/10 · Severe
- Hot days now (above 108°F)
- 7 days/yr
- Hot days in 30 yrs
- 17 days/yr
Wind risk 8/10 · Major
- Chance of severe wind over 30 yrs
- 99.0%
Air-quality risk 3/10 · Minor
- Unhealthy air days now
- 4 days/yr
- Unhealthy air days in 30 yrs
- 4 days/yr
Risk factors via First Street. Map © Google.
Why this score? — see what drove the D- grade
The composite is a weighted blend of 9 inputs, each scored 0–100. Each bar is that input's sub-score; the figure is the points it added to the 100-point composite (weight × sub-score).
- Appreciation +10.0/10.0
- Cash flow +8.0/30.0
- ARV discount +7.5/15.0
- Livability +3.2/5.0
- Rent growth +2.5/5.0
- Condition / age +2.5/5.0
- 1% rule +2.4/10.0
- DSCR +2.0/10.0
- Schools +1.4/10.0
$347,490
🖨 Deal sheet 📄 Offer letter ✓ Due diligence
Listing remarks
Welcome to the Helena floorplan, a beautifully designed one-story home that combines style, efficiency, and comfort. With 1,482 square feet, 4 bedrooms, 2 bathrooms, and a spacious 1-car garage, this D. R. Horton floor plan in The Retreat at East Argent offers everything you need. The Helena's open-concept layout makes everyday living and entertaining easy. The spacious kitchen features a large island overlooking the living and dining areas, so you're always part of the action. The private primary suite, located at the back of the home, includes a roomy walk-in closet and an attached bathroom. Two secondary bedrooms are nestled toward the front, offering flexibility for guests, kids, or you
Key facts
- Garage
- Listed 108 days
Property features AI
Finance
- Financial info: List price $346,490
Exterior
- Home design: Single-family home, Helena plan; New construction
- Construction: Living area approximately 1482; Built as part of 2026 listings
- Exterior features: Located at 86 Sanctuary Dr, Ridgeland SC 29936
Interior
- Bedrooms: 4 bedrooms
- Bathrooms: 2 full bathrooms
- Interior features: Plan: Helena (new construction plan)
Neighborhood map
What this means for you Summary
Snapshot
- This is a 4-bed/2.0-bath single-family listed at $347k.
Deal economics
- At list price, monthly cash flow is $-363 ($-4k/yr) — negative.
- To cash-flow at today's rent, offer at most $302k (13.2% below list).
- To meet the 1% rule (rent ≥ 1% of price), the offer needs to be $264k (24.1% below list).
- Recommended offer: $264k (24.1% below list) — sets the bar for 1% rule.
- Cap rate 5.1% vs local median 3.6% in Hardeeville — top-decile yield for the area; either an underpriced asset or a hidden risk that comps aren't pricing in. Stress-test before assuming the spread holds.
Location & tenants
- Location reads 65/100 on livability (#136 in SC) — a middle-class / working-renter tenant base. Strengths: health & safety A+, crime B+, housing B+; Watch: schools F, amenities F, commute F.
- Jasper 01 (rural): math 12% / reading 22% proficiency, ranked #77 of 80 in SC (top 96%) — low school quality limits family demand, transient renter base, plan for 1-2y turnover; 78% free/reduced lunch — lower-income household profile, screen leases tightly.
- Market conditions: 358 active listings in the ZIP; 2 comparable units currently listed for rent nearby; 1,385 units permitted in Jasper County in 2024 (0 in 5+ unit buildings).
- At $2,638/mo this rent would consume 65% of the median local household income ($49k/yr) (locally 395% of renters already pay >50% of income on rent) — very limited rent-growth headroom before tenants either downsize or default.
Forward outlook
- In year one you build about $38k of equity ($2k loan paydown + $35k appreciation (10.0% local appreciation)).
- Jasper County population projected at +46% by 2050 — long-run rental-demand tailwind backs the buy-and-hold thesis.
- By year 2, paydown + projected appreciation supports a ~$61k cash-out refi (75% LTV) — recoverable capital for the next deal without selling this one.
Negotiation context
- It's been on market 108 days — a 9% lower offer ($316k) is reasonable based on typical stale-listing flexibility.
Risks & watch-outs
- Climate carrying-cost: severe wind risk, 99% chance of damaging wind over 30y; extreme-heat days projected 7→17/yr by 2055 (HVAC capex compounding) — expect insurance premiums to compound above CPI over the hold.
Questions for the listing agent
- What do current leases actually rent for vs. the listed asking? Can we see a recent rent roll and the last 12 months of T-12 income?
- It's been on market 108 days. Have you received any prior offers? Is the seller open to a 24% concession, seller financing, or rate buy-down credit?
- Why hasn't it sold? Are there any deal-killer items the seller is aware of (foundation, flood, title, zoning, code violations)?
- Is there a deadline driving the sale (1031 exchange, divorce, estate, relocation)? That informs how much negotiation room exists.
- Schools are F-rated, which usually means shorter tenancies and higher turnover. Who's the typical renter profile here, and what's been the actual vacancy rate?
- The area grade is low — what's the realistic commute time and amenity access for the typical tenant pool here? Any planned neighborhood developments (good or bad) we should know about?
- What's the average days-on-market for RENTAL listings here right now (not sales)? A rising rental-DOM trend means longer vacancies and softer asking-rent achievability than the comps imply.
- What's the recent tenant-quality profile in this submarket — average credit score on applications, eviction rate, late-payment / NSF rate, and stable-employment percentage? A property-management company in the area should have these aggregated.
- How much new for-sale + rental construction is in the pipeline within 1–3 miles? Heavy new supply typically softens prices + rents 12–24 months out; constrained supply supports both.
Investment metrics
- 1% rule
- 0.74% ✗
- Cap rate
- 5.06%
- Cash-on-cash
- -4.40%
- DSCR
- 0.80
- GRM
- 11.2
CMA / ARV
- ARV (on-the-fly)
- $354,198
- Comps found
- 12
Show comp detail 12 sales within ~0.75 mi
| Address | Dist | Beds/Ba | Sqft | Sold | Price | $/sf | Match |
|---|---|---|---|---|---|---|---|
| 1521 Sanctum St | 0.28mi | 4/2.0 | 1,482 (0%) | 3mo | $350,490 | $236 | 84 |
| 1006 Sanctum St | 0.41mi | 4/2.0 | 1,482 (0%) | 1mo | $352,490 | $238 | 80 |
| 889 Sanctum St | 0.42mi | 4/2.0 | 1,482 (0%) | 1mo | $345,490 | $233 | 80 |
| 1161 Sanctum St | 0.40mi | 4/2.0 | 1,482 (0%) | 3mo | $353,490 | $239 | 79 |
| 1053 Sanctum St | 0.42mi | 4/2.0 | 1,482 (0%) | 2mo | $350,490 | $236 | 79 |
| 271 Hiatus Ct | 0.12mi | 3/2.0 (-1) | 1,618 (+9%) | 4mo | $400,000 | $247 | 71 |
| 1305 Sanctum St | 0.35mi | 3/2.5 (-1) | 1,518 (+2%) | 3mo | $358,490 | $236 | 70 |
| 956 Sanctuary Dr | 0.37mi | 3/2.0 (-1) | 1,618 (+9%) | 1mo | $381,490 | $236 | 61 |
| 269 Rifle Rd | 0.42mi | 3/2.0 (-1) | 1,347 (-9%) | 3mo | $339,990 | $252 | 58 |
| 269 Rifle Rd | 0.43mi | 3/2.0 (-1) | 1,347 (-9%) | 3mo | $399,990 | $297 | 58 |
| 113 Gun Powder Ct | 0.47mi | 3/2.0 (-1) | 1,347 (-9%) | 3mo | $349,990 | $260 | 55 |
| 113 Gun Powder Ct | 0.47mi | 3/2.0 (-1) | 1,347 (-9%) | 4mo | $349,990 | $260 | 55 |
Match score weights: distance 35% · size 25% · config 20% · recency 20%. Top-matched comps best support the ARV.
Projected returns pro-forma
10.0% appreciation · 3.0% rent growth · sell at horizon
- IRR
- 21.2%
- Equity multiple
- 2.71×
- Total profit
- $169,794
- Equity at exit
- $319,090
- IRR
- 19.2%
- Equity multiple
- 6.23×
- Total profit
- $518,301
- Equity at exit
- $688,129
Cash invested: $99,175 (down + closing). Projections, not guarantees.
Landlord ↔ Tenant lean methodology
- Overall (STATE)
- 90 Strongly Landlord-Friendly
- State South Carolina
- 90 Strongly Landlord-Friendly · R+6
- County
- — inherits STATE
- City
- — inherits STATE
ZIP-level market 29936
- Home prices YoY
- 33.1%
- Active inventory
- 358
- Price-to-rent
- 11.0×
Monthly cashflow live
- Estimated rent
- $2,638 medium interval (Pro) →
- Mortgage (P&I)
- −$1,857
- Tax est. 1.5%
- −$443 /mo · $5,313/yr
- Insurance
- −$148
- HOA
- −$0
- Vacancy / Maint / Mgmt
- −$554
- Net cashflow
- $-363
Break-even live
UW: 25.0% down · 7.5% · 30yr · 1.5% tax · 5.0% vac · 8.0% maint · 8.0% mgmt
Financing live
Cash to close
- Down payment
- $88,550
- Closing costs
- $10,626
- Reserves months
- —
- Total cash needed
- —
Loan-product check · same deal, 3 products live
Conventional
25% down · 7.5% · 30yr
- Down + closing
- —
- Monthly P&I
- —
- Monthly cashflow
- —
- DSCR
- —
- Eligible?
- —
Personal DTI + credit; lowest rate.
DSCR
20% down · 8.5% · 30yr
- Down + closing
- —
- Monthly P&I
- —
- Monthly cashflow
- —
- DSCR
- —
- Eligible?
- —
No personal income docs; deal must DSCR.
Hard money
10% down · 12.0% · 12mo
- Down + closing
- —
- Monthly P&I
- —
- Monthly cashflow
- —
- DSCR
- —
- Eligible?
- —
Short-term bridge; refi at stabilization.
Rent comps 2 comps
| Address | Beds | Baths | Sqft | Rent | $/sqft | DOM | Units | Dist |
|---|---|---|---|---|---|---|---|---|
| 2222 Sanctum St Ridgeland, SC | 3.0 | 2.0 | 1183 | $2,300 | $1.94 | 21d | 1 | 0.05mi |
| 548 Hideaway St Ridgeland, SC | 4.0 | 2.0 | 1478 | $2,450 | $1.66 | 21d | 1 | 0.30mi |
Listing history 15 events
-
2026-06-18days on market $347,490 Active 108 DOM
-
2026-06-17days on market $347,490 Active 107 DOM
-
2026-06-16days on market $347,490 Active 106 DOM
-
2026-06-15days on market $347,490 Active 105 DOM
-
2026-06-14days on market $347,490 Active 103 DOM
-
2026-06-13days on market $347,490 Active 102 DOM
-
2026-06-10days on market $347,490 Active 100 DOM
-
2026-06-09days on market $347,490 Active 99 DOM
-
2026-06-08days on market $347,490 Active 98 DOM
-
2026-06-07days on market $347,490 Active 97 DOM
-
2026-06-03days on market $347,490 Active 93 DOM
-
2026-06-02days on market $347,490 Active 92 DOM
-
2026-06-01days on market $347,490 Active 91 DOM
-
2026-05-31days on market $347,490 Active 90 DOM
-
2026-05-30days on market $347,490 Active 89 DOM
ⓘ Source: listings_history table (triggers on properties + properties_extension) + one-shot
backfill from property_details.listing_events for pre-trigger history.
Climate risk First Street
- Flood 1/10 Low FEMA zone X (unshaded) · 0% chance over 30 yrs
- Wildfire 4/10 Moderate
- Heat 9/10 Extreme 7 d/yr ≥108°F today · 17 d/yr by 30 yrs out
- Wind 8/10 Severe 99% chance of damaging wind over 30 yrs
- Air quality 3/10 Moderate 4 unhealthy d/yr today · 4 by 30 yrs out
Nearby sold comps map
Loading sold comps map…
Walkable amenities ~0.75 mi
Loading nearby amenities…
Taxation est. · year 1
- Rental income
- $31,660
- − Mortgage interest
- −$19,841
- − Property taxes
- −$5,313
- − Insurance
- −$1,771
- − Repairs & maintenance
- −$2,533
- − Management
- −$2,533
- − Depreciation
- −$10,304
- Taxable loss
- −$10,634
- Est. tax savings @ 24.0%
- +$2,552
- After-tax cash flow
- $-1,810/yr
For passive investors: Depreciation is non-cash, so a rental often shows a tax loss while cash-flowing — sheltering income. Rental losses are passive: they offset passive income freely, and up to $25,000/yr can offset ordinary (W-2) income if you actively participate and your MAGI is under $100k (phasing out to $0 by $150k); unused losses carry forward. On sale, claimed depreciation is recaptured at up to 25%, and gains may owe capital-gains tax (a 1031 exchange can defer both). Figures are a year-1 estimate at your 24.0% rate — not tax advice; consult a CPA.
Schools (NCES district)
- District
- Jasper 01
- NCES district ID
- 4502520
- Math proficiency
- 12% ▼ -11.00%
- Reading proficiency
- 22% ▼ -5.00%
- Median HH income
- $37,878
- Composite
- 14.23/100
- National rank
- #9450
- State rank
- #77 of 80 in SC
Livability — Hardeeville
- Score
- 65/100
- State rank
- #136
- US rank
- #13105
Category grades
Schools grade is shown separately in the Schools card above.
Census & demographics
- Census place
- Hardeeville, SC
- County
- Jasper County · 26,362 people
- City population
- 11,373
- Metro
- Hilton Head Island-Bluffton, SC
- Population (ZIP)
- 14,989
- Household income
- $48,986
- Rent vs Own
- Severe rent burden
- 395.0
Population outlook (Jasper County) Hauer SSP2
- Today (2025)
- 34,428 people
- By 2030
- 37,718 · +9.6%
- By 2040
- 44,061 · +28.0%
- By 2050
- 50,302 · +46.1%
- By 2075
- 66,869 · +94.2%
- By 2100
- 110,455 · +220.8%
Race, ethnicity, and origin ACS 2023
- Neighborhood character
- Diverse neighborhood (Simpson 0.64)
- Race & ethnicity
- Black 44% White 37% Hispanic / Latino 14% Two or more races 7%
- Hispanic origin (detail)
- Mexican 9% Puerto Rican 1%
- Common ancestry
- Serbian 2% Lithuanian 1% Italian 1%
- Foreign-born
- 8% · Canada
- Languages at home
- 86% English-only · Spanish 13%
Political lean MEDSL · Jasper
- 2024 margin
- Lean R (+9.6) · D 44.7% · R 54.3% · Other 1.0%
- 2008→2024 swing
- -32.5pp toward R · 2008: 22.9pp · 2024: -9.6pp
- All cycles
- 2024: R+9.6 2020: D+0.8 2016: D+11.9 2012: D+15.6 2008: D+22.9
Not yet ingested
- Civics
- —
Market trends
- HPI YoY
- ▲ 88.70%
- Current HPI
- 356.5493
- Rent YoY
- —
- Metro
- Hilton Head Island-Bluffton, SC
- State GDP YoY
- ▲ 4.51%
- F500 in state
- 2
Industry mix (Fortune 500 HQ in SC)
| Industry | F500 HQs | Revenue |
|---|---|---|
| Packaging | 1 | $7B |
|
||
Cash-flow waterfall
monthlySold comps — $/sqft
last 12 mo · ≤1 miLoading sold comps…