 6-Plex
860 Lou Ann Ln · Clarksville, TN
Flood risk 1/10 · Minimal
- FEMA flood zone
- X (unshaded)
- Chance of flooding over 30 yrs
- 0.0%
- Est. flood insurance / yr
- $507 – $1,088
Fire risk 2/10 · Minimal
- Est. fire insurance / yr
- $949 – $1,763
Heat risk 5/10 · Moderate
- Hot days now (above 107°F)
- 7 days/yr
- Hot days in 30 yrs
- 19 days/yr
Wind risk 3/10 · Minor
- Chance of severe wind over 30 yrs
- 8.0%
Air-quality risk 2/10 · Minimal
- Unhealthy air days now
- 1 days/yr
- Unhealthy air days in 30 yrs
- 1 days/yr
Risk factors via First Street. Map © Google.
Why this score? — see what drove the B- grade
The composite is a weighted blend of 9 inputs, each scored 0–100. Each bar is that input's sub-score; the figure is the points it added to the 100-point composite (weight × sub-score).
- Cash flow +30.0/30.0
- 1% rule +10.0/10.0
- DSCR +10.0/10.0
- ARV discount +7.5/15.0
- Livability +4.2/5.0
- Rent growth +2.8/5.0
- Schools +2.5/10.0
- Condition / age +2.2/5.0
- Appreciation +0.0/10.0
$460,000
🖨 Deal sheet (PDF) 📄 Offer letter ✓ Due diligence
Multi-family units
County records classify this as Multi-Family (5+ Unit). Listing-text estimate: 6 units. confirmed
5+ unit building — per-unit beds/baths from public records are typically unavailable; the breakdown below (if shown) is an estimate from the listing text.
Listing remarks
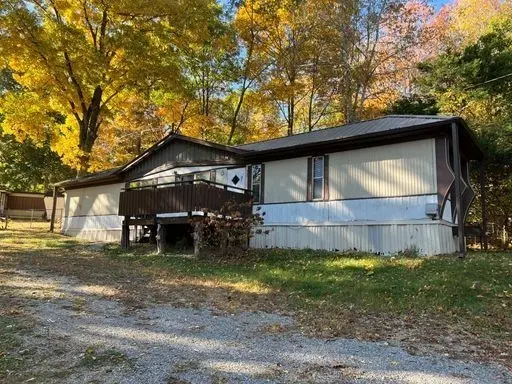
6 unit parcel at 860-866 Lou Ann Lane with 6 manufactured homes on 1.73 acre site. Fully leased. Several units with long time tenants. This is a turnkey deal at the 1% rule which is just hard to come by these days for investors. DO NOT DISTURB TENANTS. 8+% cap rate.
Key facts
- Built 1990
- Listed 60 days
Property features AI
Finance
- Financial info: Gross annual income approximately $54,294; Net operating income approximately $38,006; Owner pays trash collection; Tenants pay electricity and water
Exterior
- Utilities: Public water service; Public sewer service; Electric service available
- Home design: Residential income property; Attached property; One level; Multi-family structure; Zoned RM-1
- Construction: Built (approximate); Other construction materials
- Exterior features: Public water; Public sewer; Electricity available; Water available
Interior
- Bedrooms: Six 2-bedroom units
- Flooring: Carpet; Laminate
- Bathrooms: Units with 2 bathrooms each
- Heating & cooling: Electric heating; Electric cooling
- Interior features: Carpet and laminate flooring
Neighborhood map
What this means for you Summary
Snapshot
- This is a 6 × 4-bed/4.0-bath units multifamily listed at $460k. Condition is rated fair.
Deal economics
- At list price, monthly cash flow is $5k ($54k/yr) — positive. Per door: $751/mo.
- The deal already cash-flows at list — no discount required.
- Meets the 1% rule at list price ($10k rent vs $460k).
- Recommended offer: $446k (3.0% below list) — sets the bar for market timing.
- Cap rate 18.1% vs local median 3.5% in Clarksville — top-decile yield for the area; either an underpriced asset or a hidden risk that comps aren't pricing in. Stress-test before assuming the spread holds.
Location & tenants
- Location reads 84/100 on livability (#1 in TN, #798 nationally) — a professional / high-income tenant draw. Strengths: amenities A+, commute A+, cost of living A+; Watch: employment C-, crime D+.
- Montgomery County (urban): math 25% / reading 31% proficiency, ranked #65 of 139 in TN (top 47%) — low school quality limits family demand, transient renter base, plan for 1-2y turnover.
- Zoned schools: Minglewood Elementary (math 20% / reading 18%, grade F, #687 of 952 statewide, top 72%, 744 students, 0% FRL); Northwest High (math 6% / reading 34%, grade F, #178 of 332 statewide, top 55%, 1,456 students, 0% FRL) — zoned schools average 0% FRL vs 40% district-wide (40 pts lower); this property's tenant base skews higher-income than the district average.
- Market conditions: Rents rising (+1.3%/yr); 893 active listings in the ZIP; 2,583 units permitted in Montgomery County in 2024 (617 in 5+ unit buildings).
- At $9,730/mo this rent would consume 166% of the median local household income ($70k/yr) (locally 2093% of renters already pay >50% of income on rent) — very limited rent-growth headroom before tenants either downsize or default.
Forward outlook
- Local home prices are declining (-3.0%/yr); year-one equity from $3k of loan paydown is wiped out by about $14k of value loss. Plan a longer hold.
- Montgomery County population projected at +49% by 2050 — long-run rental-demand tailwind backs the buy-and-hold thesis.
- At projected returns (-3.0% appreciation + 1.3% rent growth), your $129k cash investment doubles in ~3 years — after that, you're playing with house money.
Negotiation context
- It's been on market 60 days — a 3% lower offer ($446k) is reasonable based on typical stale-listing flexibility.
Risks & watch-outs
- Climate carrying-cost: extreme-heat days projected 7→19/yr by 2055 (HVAC capex compounding) — expect insurance premiums to compound above CPI over the hold.
Questions for the listing agent
- It's been on market 60 days. Have you received any prior offers? Is the seller open to a 3% concession, seller financing, or rate buy-down credit?
- Can we see the unit-by-unit rent roll, current vacancy, and any below-market leases? What's the average tenancy length?
- What capital expenditures (roof, boiler, parking lot, exteriors) have been made in the last 5 years, and what's planned in the next 2?
- Have any recent inspections been done? Can we get a copy of the seller's disclosures and any deferred-maintenance estimates?
- Is there a deadline driving the sale (1031 exchange, divorce, estate, relocation)? That informs how much negotiation room exists.
- Crime grade is D in this area — have there been break-ins, vandalism, or insurance claims at this property in the last 3 years? What carrier currently insures it and at what premium?
- What's the average days-on-market for RENTAL listings here right now (not sales)? A rising rental-DOM trend means longer vacancies and softer asking-rent achievability than the comps imply.
- What's the recent tenant-quality profile in this submarket — average credit score on applications, eviction rate, late-payment / NSF rate, and stable-employment percentage? A property-management company in the area should have these aggregated.
- How much new apartment / multifamily construction is in the pipeline within 1–3 miles? Heavy new supply (>2% of stock underway) typically softens rents 12–24 months out; light construction supports rent growth.
Investment metrics
- 1% rule
- 2.12% ✓
- Cap rate
- 18.05%
- Cash-on-cash
- 42.00%
- DSCR
- 2.87
- GRM
- 3.9
CMA / ARV
No comps found within radius.
Projected returns pro-forma
-3.0% appreciation · 1.27% rent growth · sell at horizon
- IRR
- 36.7%
- Equity multiple
- 2.52×
- Total profit
- $196,057
- Equity at exit
- $68,587
- IRR
- 42.4%
- Equity multiple
- 4.69×
- Total profit
- $475,019
- Equity at exit
- $39,772
Cash invested: $128,800 (down + closing). Projections, not guarantees.
Landlord ↔ Tenant lean methodology
- Overall (STATE)
- 87 Strongly Landlord-Friendly
- State Tennessee
- 87 Strongly Landlord-Friendly · R+13
- County
- — inherits STATE
- City
- — inherits STATE
ZIP-level market 37042
- Home prices YoY
- -18.2%
- Rents YoY
- 1.3%
- Active inventory
- 893
- Price-to-rent
- 23.6×
Monthly cashflow live
- Estimated rent
- $9,730 high interval (Pro) →
- Mortgage (P&I)
- −$2,412
- Tax est. 1.5%
- −$575 /mo · $6,900/yr
- Insurance
- −$192
- HOA
- −$0
- Vacancy / Maint / Mgmt
- −$2,043
- Net cashflow
- $4,508
Break-even live
Sensitivity live
| Price | -10% $4,826 | -5% $4,667 | +0% $4,508 | +5% $4,349 | +10% $4,190 |
|---|---|---|---|---|---|
| Rent | -10% $3,739 | -5% $4,123 | +0% $4,508 | +5% $4,892 | +10% $5,276 |
| Rate | -1.0pp $4,739 | -0.5pp $4,625 | base $4,508 | +0.5pp $4,389 | +1.0pp $4,267 |
6-unit breakdown (identical units grouped — click to expand)
| Units | Beds | Baths | Est. rent |
|---|---|---|---|
| 6× units | 4 | 4 | $9,732 |
| #1 | 4 | 4 | $1,622 |
| #2 | 4 | 4 | $1,622 |
| #3 | 4 | 4 | $1,622 |
| #4 | 4 | 4 | $1,622 |
| #5 | 4 | 4 | $1,622 |
| #6 | 4 | 4 | $1,622 |
| Total (6 units) | $9,730 | ||
UW: 25.0% down · 7.5% · 30yr · 1.5% tax · 5.0% vac · 8.0% maint · 8.0% mgmt
Financing live
Cash to close
- Down payment
- $115,000
- Closing costs
- $13,800
- Reserves months
- —
- Total cash needed
- —
Loan-product check · same deal, 3 products live
Conventional
25% down · 7.5% · 30yr
- Down + closing
- —
- Monthly P&I
- —
- Monthly cashflow
- —
- DSCR
- —
- Eligible?
- —
Personal DTI + credit; lowest rate.
DSCR
20% down · 8.5% · 30yr
- Down + closing
- —
- Monthly P&I
- —
- Monthly cashflow
- —
- DSCR
- —
- Eligible?
- —
No personal income docs; deal must DSCR.
Hard money
10% down · 12.0% · 12mo
- Down + closing
- —
- Monthly P&I
- —
- Monthly cashflow
- —
- DSCR
- —
- Eligible?
- —
Short-term bridge; refi at stabilization.
Listing history 17 events
-
2026-06-18days on market $460,000 Active 60 DOM
-
2026-06-17days on market $460,000 Active 59 DOM
-
2026-06-16days on market $460,000 Active 58 DOM
-
2026-06-15days on market $460,000 Active 57 DOM
-
2026-06-14days on market $460,000 Active 55 DOM
-
2026-06-13days on market $460,000 Active 54 DOM
-
2026-06-10days on market $460,000 Active 52 DOM
-
2026-06-09days on market $460,000 Active 51 DOM
-
2026-06-08days on market $460,000 Active 50 DOM
-
2026-06-07days on market $460,000 Active 49 DOM
-
2026-06-05days on market $460,000 Active 46 DOM
-
2026-06-03days on market $460,000 Active 45 DOM
-
2026-06-02days on market $460,000 Active 44 DOM
-
2026-05-31days on market $460,000 Active 42 DOM
-
2026-05-30days on market $460,000 Active 41 DOM
-
2026-04-28price $460,000
-
2026-04-19$475,000 Active
ⓘ Source: listings_history table (triggers on properties + properties_extension) + one-shot
backfill from property_details.listing_events for pre-trigger history.
Climate risk First Street
- Flood 1/10 Low FEMA zone X (unshaded) · 0% chance over 30 yrs
- Wildfire 2/10 Low
- Heat 5/10 Major 7 d/yr ≥107°F today · 19 d/yr by 30 yrs out
- Wind 3/10 Moderate 8% chance of damaging wind over 30 yrs
- Air quality 2/10 Low 1 unhealthy d/yr today · 1 by 30 yrs out
Nearby sold comps map
Loading sold comps map…
Walkable amenities ~0.75 mi
Loading nearby amenities…
Taxation est. · year 1
- Rental income
- $116,760
- − Mortgage interest
- −$25,767
- − Property taxes
- −$6,900
- − Insurance
- −$2,300
- − Repairs & maintenance
- −$9,341
- − Management
- −$9,341
- − Depreciation
- −$13,382
- Taxable income
- $49,729
- Est. tax owed @ 24.0%
- −$11,935
- After-tax cash flow
- $42,158/yr
For passive investors: Depreciation is non-cash, so a rental often shows a tax loss while cash-flowing — sheltering income. Rental losses are passive: they offset passive income freely, and up to $25,000/yr can offset ordinary (W-2) income if you actively participate and your MAGI is under $100k (phasing out to $0 by $150k); unused losses carry forward. On sale, claimed depreciation is recaptured at up to 25%, and gains may owe capital-gains tax (a 1031 exchange can defer both). Figures are a year-1 estimate at your 24.0% rate — not tax advice; consult a CPA.
Condition & rehab AI · 13 photos
This multi-family property requires significant repairs and maintenance, particularly to the roof and exterior siding, to improve its condition and value.
Repairs flagged
- Major Roof — Significant damage and potential leaks indicated.
- Major Exterior siding — Weathered and in need of repair.
- Minor Flooring — Carpeted flooring may need replacement for aesthetic appeal.
Value-add opportunities
- Both Replace roof — A new roof will significantly improve the home's appearance and value.
- Both Repair and paint exterior siding — A fresh coat of paint and repairs will enhance curb appeal and value.
- Both Replace carpeted flooring — New flooring will improve the home's appearance and value.
Renovation cost estimate screening
| Repair item | Severity | Est. cost |
|---|---|---|
| Roof · Significant damage and potential leaks indicated. | Major | $15,000–50,000 |
| Exterior siding · Weathered and in need of repair. | Major | $15,000–50,000 |
| Flooring · Carpeted flooring may need replacement for aesthetic appeal. | Minor | $500–3,000 |
| Total estimated repair cost · 3 items | $30,500–103,000 |
Value-add ROI direction
- Both Replace roof — A new roof will significantly improve the home's appearance and value. ↑
- Both Repair and paint exterior siding — A fresh coat of paint and repairs will enhance curb appeal and value. ↑
- Both Replace carpeted flooring — New flooring will improve the home's appearance and value. ↑
ⓘ Cost ranges are severity-bucket heuristics (US national rule-of-thumb). Get contractor quotes + a written scope before underwriting a rehab budget.
Schools (NCES district)
- District
- Montgomery County
- NCES district ID
- 4703030
- Math proficiency
- 25% ▼ -20.00%
- Reading proficiency
- 31% ▼ -10.00%
- Median HH income
- $50,423
- Composite
- 24.56/100
- National rank
- #7641
- State rank
- #65 of 139 in TN
Livability — Clarksville
- Score
- 84/100
- State rank
- #1
- US rank
- #798
Category grades
Schools grade is shown separately in the Schools card above.
Census & demographics
- Census place
- Clarksville, TN
- County
- Montgomery County · 211,371 people
- City population
- 211,371
- Metro
- Clarksville, TN-KY
- Population (ZIP)
- 87,652
- Household income
- $70,393
- Rent vs Own
- Severe rent burden
- 2093.0
Population outlook (Montgomery County) Hauer SSP2
- Today (2025)
- 236,633 people
- By 2030
- 258,978 · +9.4%
- By 2040
- 305,456 · +29.1%
- By 2050
- 353,147 · +49.2%
- By 2075
- 471,289 · +99.2%
- By 2100
- 564,122 · +138.4%
Race, ethnicity, and origin ACS 2023
- Neighborhood character
- Diverse neighborhood (Simpson 0.68)
- Race & ethnicity
- White 48% Black 26% Hispanic / Latino 15% Two or more races 13% Asian 3%
- Hispanic origin (detail)
- Mexican 6% Puerto Rican 4%
- Common ancestry
- Italian 4% Slovak 1% Lithuanian 1%
- Foreign-born
- 8% · Canada, South Korea, China
- Languages at home
- 88% English-only · Spanish 8% German/W. Germanic 1% Other Indo-European 1%
Political lean MEDSL · Montgomery
- 2024 margin
- R (+18.4) · D 40.0% · R 58.5% · Other 1.5%
- 2008→2024 swing
- -10.5pp toward R · 2008: -7.9pp · 2024: -18.4pp
- All cycles
- 2024: R+18.4 2020: R+12.7 2016: R+18.6 2012: R+10.5 2008: R+7.9
Not yet ingested
- Civics
- —
Market trends
- HPI YoY
- ▼ -58.81%
- Current HPI
- 264.4911
- Rent YoY
- ▲ 1.27%
- Metro
- Clarksville, TN-KY
- State GDP YoY
- ▲ 2.78%
- F500 in state
- 22
Industry mix (Fortune 500 HQ in TN)
| Industry | F500 HQs | Revenue |
|---|---|---|
| Healthcare | 3 | $91B |
|
||
| Retail | 3 | $72B |
|
||
| Transportation / Logistics | 1 | $88B |
|
||
| Paper / Packaging | 1 | $19B |
|
||
| Insurance | 1 | $13B |
|
||
| Energy | 1 | $12B |
|
||
Price history
-3.2% since first listed2 events — show timeline
- 2026-04-28 Price Changed $460,000 REALTRACS as Distributed by MLS Grid
- 2026-04-19 Listed $475,000 REALTRACS as Distributed by MLS Grid
Cash-flow waterfall
monthlySold comps — $/sqft
last 12 mo · ≤1 miLoading sold comps…