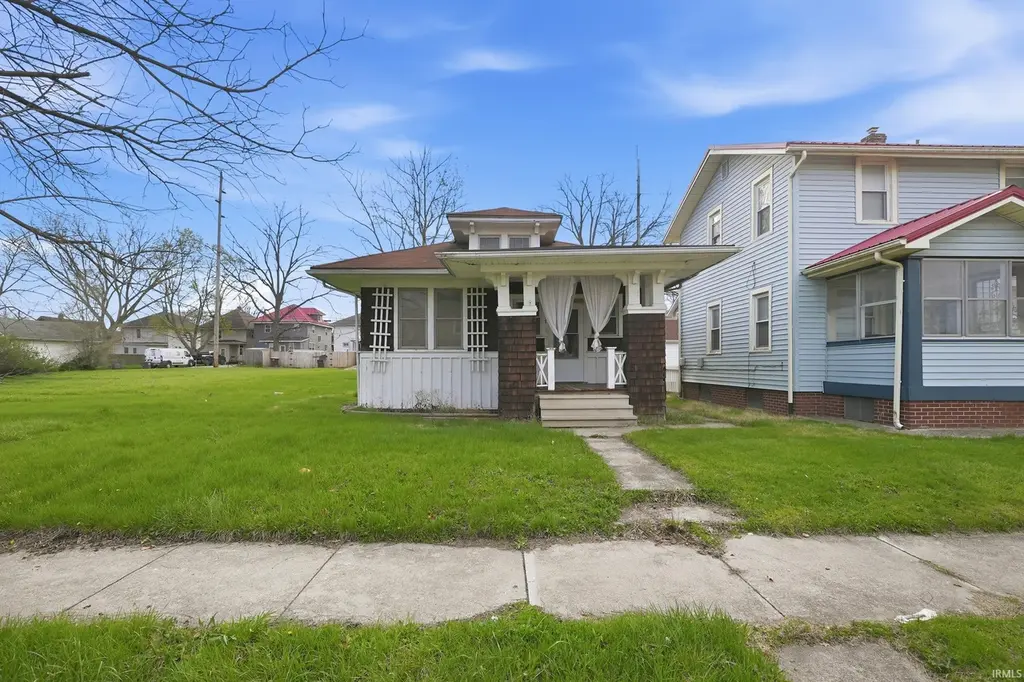
3117 Monroe St · Fort Wayne, IN
Flood risk 1/10 · Minimal
- FEMA flood zone
- X (unshaded)
- Chance of flooding over 30 yrs
- 0.0%
- Est. flood insurance / yr
- $473 – $860
Fire risk 1/10 · Minimal
- Est. fire insurance / yr
- $717 – $1,331
Heat risk 3/10 · Minor
- Hot days now (above 100°F)
- 7 days/yr
- Hot days in 30 yrs
- 17 days/yr
Wind risk 2/10 · Minimal
- Chance of severe wind over 30 yrs
- —
Air-quality risk 3/10 · Minor
- Unhealthy air days now
- 2 days/yr
- Unhealthy air days in 30 yrs
- 3 days/yr
Risk factors via First Street. Map © Google.
Why this score? — see what drove the B+ grade
The composite is a weighted blend of 9 inputs, each scored 0–100. Each bar is that input's sub-score; the figure is the points it added to the 100-point composite (weight × sub-score).
- Cash flow +29.3/30.0
- ARV discount +15.0/15.0
- DSCR +10.0/10.0
- 1% rule +9.0/10.0
- Livability +4.2/5.0
- Rent growth +3.7/5.0
- Condition / age +2.5/5.0
- Schools +2.2/10.0
- Appreciation +0.0/10.0
$63,000
🖨 Deal sheet (PDF) 📄 Offer letter ✓ Due diligence
Listing remarks MLS
Great investment opportunity being sold AS-IS. There is another lot included in the sale of this home. Ready for your favorite contractor to create your dream. Good fit for investors or buyers looking to take on a manageable project. This 1-bedroom, 1-bath home with a simple, functional layout and classic charm sits on two lots, giving the feeling of space from neighbors. Rare find in Fort Wayne. Features a cozy living area and original woodwork, hard wood floors that could be brought back to life. Walking up the relaxing front porch, you enter the living room with immediate entry to the left for the bedroom. The living room is separated but open to the dining room with original decorative columns. The bathroom is off the dining room and also has access to the bedroom down a small hall. The kitchen is to the rear of the house with small back porch. The yard is a landscaper's blank canvas. The open basement is excellent storage and in great shape. Financing can be available with a rehab loan
Key facts
- Hard wood floors
- Another lot included
- Original woodwork
Tags
Neighborhood map
What this means for you Summary
Snapshot
- This is a 2-bed/1.0-bath single-family listed at $63k.
Deal economics
- At list price, monthly cash flow is $222 ($3k/yr) — positive.
- The deal already cash-flows at list — no discount required.
- Meets the 1% rule at list price ($884 rent vs $63k).
- Recommended offer: $59k (6.0% below list) — sets the bar for market timing.
- Cap rate 10.5% vs local median 4.8% in Fort Wayne — top-decile yield for the area; either an underpriced asset or a hidden risk that comps aren't pricing in. Stress-test before assuming the spread holds.
Location & tenants
- Location reads 84/100 on livability (#6 in IN, #676 nationally) — a professional / high-income tenant draw. Strengths: amenities A+, commute A+, cost of living A+; Watch: crime C-, employment D+.
- Fort Wayne Community Schools (urban): math 22% / reading 29% proficiency, ranked #263 of 301 in IN (top 87%) — low school quality limits family demand, transient renter base, plan for 1-2y turnover; 60% free/reduced lunch — lower-income household profile, screen leases tightly.
- Zoned schools: Indian Village Elementary School (math 27% / reading 22%, grade F, #762 of 994 statewide, top 78%, 372 students, 74% FRL); Kekionga Middle School (math 10% / reading 17%, grade F, #303 of 330 statewide, top 92%, 538 students, 80% FRL); South Side High School (math 12% / reading 39%, grade F, #322 of 369 statewide, top 87%, 1,423 students, 73% FRL) — zoned schools average 76% FRL vs 60% district-wide (15 pts higher); higher-poverty schools than district average — tighter screening recommended.
- Market conditions: Rents rising fast (+4.9%/yr); 133 active listings in the ZIP; 24 comparable units currently listed for rent nearby; rentals at typical pace (median 23d on market — plan ~3-4 weeks tenant-placement turnaround); 1,861 units permitted in Allen County in 2024 (576 in 5+ unit buildings).
Forward outlook
- Local home prices are declining (-3.0%/yr); year-one equity from $436 of loan paydown is wiped out by about $2k of value loss. Plan a longer hold.
- Allen County population projected at +10% by 2050 — modest demand growth; plan on rents tracking national, not racing it.
- At projected returns (-3.0% appreciation + 4.9% rent growth), your $18k cash investment doubles in ~7 years — after that, you're playing with house money.
Negotiation context
- It's been on market 68 days — a 6% lower offer ($59k) is reasonable based on typical stale-listing flexibility.
Risks & watch-outs
- Watch-outs: built in 1934 — expect roof / HVAC / electrical / plumbing capex.
Questions for the listing agent
- It's been on market 68 days. Have you received any prior offers? Is the seller open to a 6% concession, seller financing, or rate buy-down credit?
- Built in 1934 — when were the roof, HVAC, electrical panel, plumbing, and water heater last replaced?
- Why hasn't it sold? Are there any deal-killer items the seller is aware of (foundation, flood, title, zoning, code violations)?
- Is there a deadline driving the sale (1031 exchange, divorce, estate, relocation)? That informs how much negotiation room exists.
- Schools are D-rated, which usually means shorter tenancies and higher turnover. Who's the typical renter profile here, and what's been the actual vacancy rate?
- What's the average days-on-market for RENTAL listings here right now (not sales)? A rising rental-DOM trend means longer vacancies and softer asking-rent achievability than the comps imply.
- What's the recent tenant-quality profile in this submarket — average credit score on applications, eviction rate, late-payment / NSF rate, and stable-employment percentage? A property-management company in the area should have these aggregated.
- How much new for-sale + rental construction is in the pipeline within 1–3 miles? Heavy new supply typically softens prices + rents 12–24 months out; constrained supply supports both.
Investment metrics
- 1% rule
- 1.40% ✓
- Cap rate
- 10.52%
- Cash-on-cash
- 15.11%
- DSCR
- 1.67
- GRM
- 5.9
CMA / ARV
- ARV (median comp)
- $78,150
- List price
- $63,000
- Delta
- -19.39%
- Verdict
- UNDERPRICED
- Comps
- 20 within 1.0 mi
Show comp detail 12 sales within ~0.75 mi
| Address | Dist | Beds/Ba | Sqft | Sold | Price | $/sf | Match |
|---|---|---|---|---|---|---|---|
| 415 Agnes St | 0.17mi | 2/1.0 | 720 (+1%) | 1mo | $77,000 | $107 | 90 |
| 3217 Oliver St | 0.41mi | 2/1.0 | 672 (-6%) | 1mo | $60,510 | $90 | 70 |
| 4121 Monroe St | 0.60mi | 2/1.0 | 725 (+1%) | 5mo | $42,000 | $58 | 66 |
| 3621 Lafayette St | 0.34mi | 2/1.0 | 672 (-6%) | 11mo | $120,000 | $179 | 64 |
| 225 W Darrow Ave | 0.59mi | 2/1.0 | 772 (+8%) | 4mo | $139,900 | $181 | 56 |
| 1128 Eckart St | 0.39mi | 2/1.0 | 790 (+10%) | 12mo | $48,000 | $61 | 55 |
| 3920 Smith St | 0.57mi | 2/1.0 | 804 (+12%) | 4mo | $56,000 | $70 | 50 |
| 3105 Winter St | 0.69mi | 2/1.0 | 778 (+9%) | 7mo | $85,800 | $110 | 48 |
| 720 Milton St | 0.64mi | 2/1.0 | 780 (+9%) | 9mo | $70,000 | $90 | 47 |
| 3314 Reed St | 0.61mi | 2/1.0 | 616 (-14%) | 2mo | $94,900 | $154 | 46 |
| 916 Baxter St | 0.62mi | 2/1.0 | 620 (-13%) | 4mo | $120,000 | $194 | 45 |
| 514 Buchanan St | 0.73mi | 2/1.0 | 796 (+11%) | 3mo | $114,900 | $144 | 45 |
Match score weights: distance 35% · size 25% · config 20% · recency 20%. Top-matched comps best support the ARV.
Projected returns pro-forma
-3.0% appreciation · 4.93% rent growth · sell at horizon
- IRR
- 8.1%
- Equity multiple
- 1.32×
- Total profit
- $5,725
- Equity at exit
- $9,394
- IRR
- 19.0%
- Equity multiple
- 2.75×
- Total profit
- $30,821
- Equity at exit
- $5,447
Cash invested: $17,640 (down + closing). Projections, not guarantees.
Landlord ↔ Tenant lean methodology
- Overall (STATE)
- 90 Strongly Landlord-Friendly
- State Indiana
- 90 Strongly Landlord-Friendly · R+11
- County
- — inherits STATE
- City
- — inherits STATE
ZIP-level market 46806
- Home prices YoY
- -33.6%
- Rents YoY
- 4.9%
- Active inventory
- 133
- Price-to-rent
- 5.9×
Monthly cashflow live
- Estimated rent
- $884 high interval (Pro) →
- Mortgage (P&I)
- −$330
- Tax from tax record
- −$119 /mo · $1,431/yr
- Insurance
- −$26
- HOA
- −$0
- Vacancy / Maint / Mgmt
- −$186
- Net cashflow
- $222
Break-even live
Sensitivity live
| Price | -10% $258 | -5% $240 | +0% $222 | +5% $204 | +10% $186 |
|---|---|---|---|---|---|
| Rent | -10% $152 | -5% $187 | +0% $222 | +5% $257 | +10% $292 |
| Rate | -1.0pp $254 | -0.5pp $238 | base $222 | +0.5pp $206 | +1.0pp $189 |
UW: 25.0% down · 7.5% · 30yr · 1.5% tax · 5.0% vac · 8.0% maint · 8.0% mgmt
Financing live
Cash to close
- Down payment
- $15,750
- Closing costs
- $1,890
- Reserves months
- —
- Total cash needed
- —
Loan-product check · same deal, 3 products live
Conventional
25% down · 7.5% · 30yr
- Down + closing
- —
- Monthly P&I
- —
- Monthly cashflow
- —
- DSCR
- —
- Eligible?
- —
Personal DTI + credit; lowest rate.
DSCR
20% down · 8.5% · 30yr
- Down + closing
- —
- Monthly P&I
- —
- Monthly cashflow
- —
- DSCR
- —
- Eligible?
- —
No personal income docs; deal must DSCR.
Hard money
10% down · 12.0% · 12mo
- Down + closing
- —
- Monthly P&I
- —
- Monthly cashflow
- —
- DSCR
- —
- Eligible?
- —
Short-term bridge; refi at stabilization.
Rent comps 24 comps
| Address | Beds | Baths | Sqft | Rent | $/sqft | DOM | Units | Dist |
|---|---|---|---|---|---|---|---|---|
| 239 E Woodland Ave Unit 1 Fort Wayne, IN | 1.0 | 1.0 | 500 | $625 | $1.25 | 15d | 1 | 0.50mi |
| 3113 S Harrison St Unit 2 Fort Wayne, IN | 2.0 | 1.0 | 600 | $850 | $1.42 | 15d | 1 | 0.50mi |
| 2919 S Harrison St Unit 2921 Fort Wayne, IN | 2.0 | 1.0 | 538 | $825 | $1.53 | 23d | 1 | 0.52mi |
| 4121 Monroe St Fort Wayne, IN | 2.0 | 1.0 | 725 | $1,100 | $1.52 | 15d | 1 | 0.59mi |
| 2224 S Calhoun St Apt 1C Fort Wayne, IN | 1.0 | 1.0 | 400 | $650 | $1.62 | 23d | 1 | 0.76mi |
| 3932 Winter St Fort Wayne, IN | 2.0 | 1.0 | 750 | $875 | $1.17 | 45d | 1 | 0.83mi |
| 859 Buchanan St Fort Wayne, IN | 1.0–4.0 | 1.0 | 887 | $900 | $1.01 | 23d | 1 | 0.86mi |
| 2222 Hoagland Ave Unit E3 Fort Wayne, IN | 1.0 | 1.0 | 625 | $675 | $1.08 | 23d | 1 | 0.94mi |
| 340 W Dewald St Apt 2 Fort Wayne, IN | 1.0 | 1.0 | 600 | $825 | $1.38 | 15d | 1 | 0.96mi |
| 227 W Williams St Unit 3 Fort Wayne, IN | 1.0 | 1.0 | 590 | $650 | $1.10 | 45d | 1 | 0.97mi |
| 2301 Fairfield Ave Unit 406 Fort Wayne, IN | 1.0 | 1.0 | 552 | $750 | $1.36 | 45d | 1 | 0.99mi |
| 3718 S Wayne Ave Fort Wayne, IN | 1.0 | 1.0 | 568 | $795 | $1.40 | 45d | 1 | 1.02mi |
| 2117 Eckart St Fort Wayne, IN | 1.0 | 1.0 | 468 | $975 | $2.08 | 23d | 1 | 1.02mi |
| 4330 S Anthony Blvd Unit 4402 Fort Wayne, IN | 1.0 | 1.0 | 575 | $900 | $1.57 | 15d | 1 | 1.09mi |
| 2411 Fox Ave Unit 2411-A Fort Wayne, IN | 1.0 | 1.0 | 620 | $799 | $1.29 | 23d | 1 | 1.13mi |
| 810 Huestis Ave Apt 1 Fort Wayne, IN | 2.0 | 1.0 | 749 | $925 | $1.23 | 23d | 1 | 1.15mi |
| 927 Nuttman Ave Fort Wayne, IN | 2.0 | 1.0 | 650 | $850 | $1.31 | 45d | 1 | 1.15mi |
| 824 Huestis Ave Apt C Fort Wayne, IN | 2.0 | 1.0 | 744 | $825 | $1.11 | 23d | 1 | 1.17mi |
| 3019 Broadway Unit 2 Fort Wayne, IN | 1.0 | 1.0 | 750 | $925 | $1.23 | 45d | 1 | 1.30mi |
| 4325 Werling Dr Fort Wayne, IN | 1.0–3.0 | 1.0–2.0 | 923 | $1,008 | $1.09 | 45d | 1 | 1.32mi |
| 1207 Nuttman Ave Fort Wayne, IN | 2.0 | 1.0 | 650 | $850 | $1.31 | 45d | 1 | 1.35mi |
| 1315 Huestis Ave Unit 2 Fort Wayne, IN | 1.0 | 1.0 | 650 | $800 | $1.23 | 23d | 1 | 1.42mi |
| 1829 Broadway Unit 1831 Fort Wayne, IN | 1.0 | 1.0 | 600 | $950 | $1.58 | 45d | 1 | 1.46mi |
| 1250 Ewing St Fort Wayne, IN | 2.0 | 1.0–2.0 | 980 | $2,081 | $2.12 | 23d | 24 | 1.49mi |
Listing history 16 events
-
2026-06-22days on market $63,000 Active 68 DOM
-
2026-06-18days on market $63,000 Active 65 DOM
-
2026-06-17days on market $63,000 Active 64 DOM
-
2026-06-16days on market $63,000 Active 63 DOM
-
2026-06-15days on market $63,000 Active 62 DOM
-
2026-06-14days on market $63,000 Active 60 DOM
-
2026-06-10days on market $63,000 Active 57 DOM
-
2026-06-09days on market $63,000 Active 56 DOM
-
2026-06-08days on market $63,000 Active 55 DOM
-
2026-06-07days on market $63,000 Active 54 DOM
-
2026-06-03days on market $63,000 Active 50 DOM
-
2026-06-02days on market $63,000 Active 49 DOM
-
2026-06-01days on market $63,000 Active 48 DOM
-
2026-05-31days on market $63,000 Active 47 DOM
-
2026-05-30days on market $63,000 Active 46 DOM
-
2026-04-14$63,000 Active 1005-char remark
Show marketing remark (1005 chars)
Great investment opportunity being sold AS-IS. There is another lot included in the sale of this home. Ready for your favorite contractor to create your dream. Good fit for investors or buyers looking to take on a manageable project. This 1-bedroom, 1-bath home with a simple, functional layout and classic charm sits on two lots, giving the feeling of space from neighbors. Rare find in Fort Wayne. Features a cozy living area and original woodwork, hard wood floors that could be brought back to life. Walking up the relaxing front porch, you enter the living room with immediate entry to the left for the bedroom. The living room is separated but open to the dining room with original decorative columns. The bathroom is off the dining room and also has access to the bedroom down a small hall. The kitchen is to the rear of the house with small back porch. The yard is a landscaper's blank canvas. The open basement is excellent storage and in great shape. Financing can be available with a rehab loan
ⓘ Source: listings_history table (triggers on properties + properties_extension) + one-shot
backfill from property_details.listing_events for pre-trigger history.
Tax reassessment forecast IN · Partial reset (capped growth)
- Current annual tax
- $1,431 · $119/mo
- Projected year-2 tax
- $1,431 · $119/mo
- Expected delta
- $0/yr ($0/mo · 0.0%)
ⓘ Screening estimate from a state-policy table — verify with the county assessor before closing.
Climate risk First Street
- Flood 1/10 Low FEMA zone X (unshaded) · 0% chance over 30 yrs
- Wildfire 1/10 Low
- Heat 3/10 Moderate 7 d/yr ≥100°F today · 17 d/yr by 30 yrs out
- Wind 2/10 Low
- Air quality 3/10 Moderate 2 unhealthy d/yr today · 3 by 30 yrs out
Nearby sold comps map
Loading sold comps map…
Walkable amenities ~0.75 mi
Loading nearby amenities…
Taxation est. · year 1
- Rental income
- $10,603
- − Mortgage interest
- −$3,529
- − Property taxes
- −$1,431
- − Insurance
- −$315
- − Repairs & maintenance
- −$848
- − Management
- −$848
- − Depreciation
- −$1,833
- Taxable income
- $1,798
- Est. tax owed @ 24.0%
- −$432
- After-tax cash flow
- $2,234/yr
For passive investors: Depreciation is non-cash, so a rental often shows a tax loss while cash-flowing — sheltering income. Rental losses are passive: they offset passive income freely, and up to $25,000/yr can offset ordinary (W-2) income if you actively participate and your MAGI is under $100k (phasing out to $0 by $150k); unused losses carry forward. On sale, claimed depreciation is recaptured at up to 25%, and gains may owe capital-gains tax (a 1031 exchange can defer both). Figures are a year-1 estimate at your 24.0% rate — not tax advice; consult a CPA.
Schools (NCES district)
- District
- Fort Wayne Community Schools
- NCES district ID
- 1803630
- Math proficiency
- 22% ▼ -11.00%
- Reading proficiency
- 29% ▼ -7.00%
- Median HH income
- $41,951
- Composite
- 21.68/100
- National rank
- #8275
- State rank
- #263 of 301 in IN
Livability — Fort Wayne
- Score
- 84/100
- State rank
- #6
- US rank
- #676
Category grades
Schools grade is shown separately in the Schools card above.
Census & demographics
- Census place
- Fort Wayne, IN
- County
- Allen County · 326,813 people
- City population
- 326,813
- Metro
- Fort Wayne, IN
- Population (ZIP)
- 26,425
- Household income
- $47,895
- Rent vs Own
- Severe rent burden
- 1184.0
Population outlook (Allen County) Hauer SSP2
- Today (2025)
- 394,020 people
- By 2030
- 405,128 · +2.8%
- By 2040
- 423,476 · +7.5%
- By 2050
- 435,137 · +10.4%
- By 2075
- 450,293 · +14.3%
- By 2100
- 424,101 · +7.6%
Race, ethnicity, and origin ACS 2023
- Neighborhood character
- Highly diverse neighborhood (Simpson 0.74)
- Race & ethnicity
- Black 37% Hispanic / Latino 26% White 21% Asian 12% Two or more races 11% Native American 2%
- Hispanic origin (detail)
- Mexican 18% Puerto Rican 1%
- Common ancestry
- Italian 1% Romanian 1% Lithuanian 1%
- Foreign-born
- 19% · Canada, Philippines, South Korea
- Languages at home
- 71% English-only · Spanish 19% Other Asian/Pacific 9%
Political lean MEDSL · Allen
- 2024 margin
- R (+12.5) · D 42.9% · R 55.4% · Other 1.7%
- 2008→2024 swing
- -8.1pp toward R · 2008: -4.3pp · 2024: -12.5pp
- All cycles
- 2024: R+12.5 2020: R+11.2 2016: R+19.6 2012: R+16.8 2008: R+4.3
Not yet ingested
- Civics
- —
Market trends
- HPI YoY
- ▼ -148.00%
- Current HPI
- 291.8198
- Rent YoY
- ▲ 4.93%
- Metro
- Fort Wayne, IN
- State GDP YoY
- ▲ 2.90%
- F500 in state
- 18
Industry mix (Fortune 500 HQ in IN)
| Industry | F500 HQs | Revenue |
|---|---|---|
| Industrial Machinery | 2 | $37B |
|
||
| Healthcare | 1 | $177B |
|
||
| Pharmaceuticals | 1 | $45B |
|
||
| Metals / Steel | 1 | $18B |
|
||
| Agriculture | 1 | $17B |
|
||
| Packaging | 1 | $12B |
|
||
Price history
1 event — show timeline
- 2026-04-14 Listed $63,000 IRMLS
Property tax history
+10.5%/yrLatest (2024): $1,431 · +18.1% YoY. Source: county tax records.
Cash-flow waterfall
monthlySold comps — $/sqft
last 12 mo · ≤1 miLoading sold comps…