 Duplex
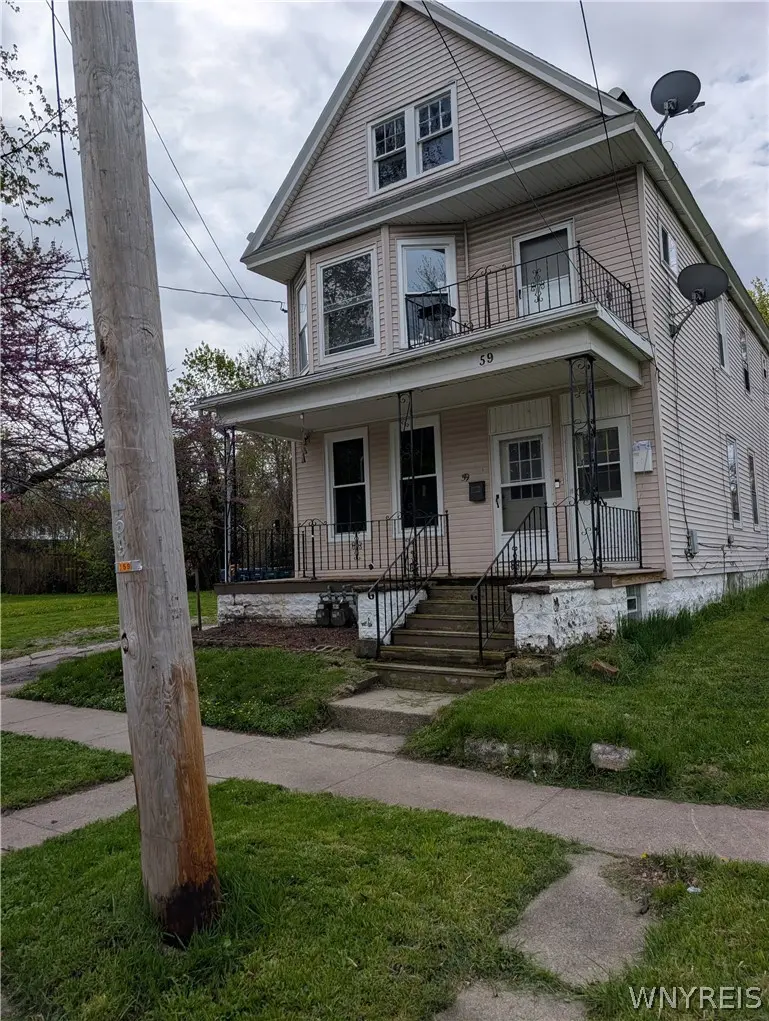
59 Edna Pl · Buffalo, NY
Flood risk 1/10 · Minimal
- FEMA flood zone
- X (unshaded)
- Chance of flooding over 30 yrs
- 0.0%
- Est. flood insurance / yr
- $473 – $860
Fire risk 1/10 · Minimal
- Est. fire insurance / yr
- $691 – $1,283
Heat risk 3/10 · Minor
- Hot days now (above 91°F)
- 7 days/yr
- Hot days in 30 yrs
- 15 days/yr
Wind risk 1/10 · Minimal
- Chance of severe wind over 30 yrs
- —
Air-quality risk 4/10 · Minor
- Unhealthy air days now
- 4 days/yr
- Unhealthy air days in 30 yrs
- 9 days/yr
Risk factors via First Street. Map © Google.
Why this score? — see what drove the A grade
The composite is a weighted blend of 9 inputs, each scored 0–100. Each bar is that input's sub-score; the figure is the points it added to the 100-point composite (weight × sub-score).
- Cash flow +30.0/30.0
- ARV discount +15.0/15.0
- 1% rule +10.0/10.0
- DSCR +10.0/10.0
- Appreciation +5.9/10.0
- Rent growth +4.6/5.0
- Livability +3.9/5.0
- Schools +3.3/10.0
- Condition / age +2.5/5.0
$194,900
🖨 Deal sheet (PDF) 📄 Offer letter ✓ Due diligence
Multi-family units
County records classify this as Multi-Family (2-4 Unit). Listing-text estimate: 2 units. confirmed
Listing remarks MLS
Great Investment / Income Property! Large 3/3 duplex minutes away from Medical Hospital, close to Downtown Buffalo. Upper unit updated. Features include: hardwood floors, gas fireplace(NRTC). Large bedrooms and kitchens. Lots of storage. Call today to schedule a showing in this very desired area!
Key facts
- Ample storage space
- Spacious duplex
- Investment property
Tags
Property features AI
Finance
- Other: Lot is rectangular, near public transit, with city street frontage (approx. 34 x 127)
- Financial info: Property has 2 total units with separate gas and electric meters for each unit; One unit currently rented month-to-month for $1,000; Owner pays hot water; rent includes hot water; Operating expenses include water and sewer
Exterior
- Parking: Concrete parking
- Utilities: Public water connected; Sewer connected; Circuit breaker electrical
- Home design: 2-story multi-family residence; Residential multi-use zoning; Stone foundation; Resale condition
- Construction: Vinyl siding; Copper plumbing; Asphalt roof; Built (existing)
- Exterior features: Balcony; Covered porch
Interior
- Kitchen: Gas water heater
- Bedrooms: Two separate 3-bedroom units (each unit has 3 bedrooms)
- Flooring: Hardwood; Varies
- Bathrooms: Each unit has 1 full bathroom (2 full bathrooms total)
- Heating & cooling: Gas forced air heating; Heating is present
- Interior features: Hardwood and varied flooring; Full basement
- Laundry & utility: Common area laundry
Neighborhood map
What this means for you Summary
Snapshot
- This is a 2 × 3-bed/?-bath units multifamily listed at $195k.
Deal economics
- At list price, monthly cash flow is $2k ($25k/yr) — positive. Per door: $1k/mo.
- The deal already cash-flows at list — no discount required.
- Meets the 1% rule at list price ($4k rent vs $195k).
- Recommended offer: $189k (3.0% below list) — sets the bar for market timing.
- Cap rate 19.1% vs local median 8.0% in Buffalo — top-decile yield for the area; either an underpriced asset or a hidden risk that comps aren't pricing in. Stress-test before assuming the spread holds.
Location & tenants
- Location reads 77/100 on livability (#195 in NY, #3,011 nationally) — a middle-class / working-renter tenant base. Strengths: commute A+, housing A+, health & safety A+; Watch: crime F, employment D-.
- Buffalo City School District (urban): math 41% / reading 40% proficiency, ranked #535 of 590 in NY (top 91%) — families likely to look elsewhere, expect single-tenant / working-renter base with shorter leases; 75% free/reduced lunch — lower-income household profile, screen leases tightly.
- Market conditions: Rents rising fast (+8.5%/yr); 56 active listings in the ZIP; 1 comparable units currently listed for rent nearby; 1,244 units permitted in Erie County in 2024 (563 in 5+ unit buildings).
- At $4,089/mo this rent would consume 98% of the median local household income ($50k/yr) (locally 959% of renters already pay >50% of income on rent) — very limited rent-growth headroom before tenants either downsize or default.
Forward outlook
- In year one you build about $5k of equity ($1k loan paydown + $4k appreciation (1.9% local appreciation)).
- At projected returns (1.9% appreciation + 8.0% rent growth), your $55k cash investment doubles in ~2 years — after that, you're playing with house money.
- By year 7, paydown + projected appreciation supports a ~$32k cash-out refi (75% LTV) — recoverable capital for the next deal without selling this one.
Negotiation context
- It's been on market 40 days — a 3% lower offer ($189k) is reasonable based on typical stale-listing flexibility.
- 2 sale attempts since 10y ago with the ask held roughly flat each time — persistent listings suggest the price (not the market) is what's stuck; bring a comps-based counter.
- Current owner paid $95k; list at $195k implies a 105% gain — meaningful room to come down on a strong offer.
Risks & watch-outs
- Watch-outs: built in 1920 — expect roof / HVAC / electrical / plumbing capex.
Questions for the listing agent
- It's been on market 40 days. Have you received any prior offers? Is the seller open to a 3% concession, seller financing, or rate buy-down credit?
- Can we see the unit-by-unit rent roll, current vacancy, and any below-market leases? What's the average tenancy length?
- What capital expenditures (roof, boiler, parking lot, exteriors) have been made in the last 5 years, and what's planned in the next 2?
- Built in 1920 — when were the roof, HVAC, electrical panel, plumbing, and water heater last replaced?
- Is there a deadline driving the sale (1031 exchange, divorce, estate, relocation)? That informs how much negotiation room exists.
- Crime grade is F in this area — have there been break-ins, vandalism, or insurance claims at this property in the last 3 years? What carrier currently insures it and at what premium?
- What's the average days-on-market for RENTAL listings here right now (not sales)? A rising rental-DOM trend means longer vacancies and softer asking-rent achievability than the comps imply.
- What's the recent tenant-quality profile in this submarket — average credit score on applications, eviction rate, late-payment / NSF rate, and stable-employment percentage? A property-management company in the area should have these aggregated.
- How much new apartment / multifamily construction is in the pipeline within 1–3 miles? Heavy new supply (>2% of stock underway) typically softens rents 12–24 months out; light construction supports rent growth.
Investment metrics
- 1% rule
- 2.10% ✓
- Cap rate
- 19.13%
- Cash-on-cash
- 45.86%
- DSCR
- 3.04
- GRM
- 4.0
CMA / ARV
- ARV (median comp)
- $305,398
- List price
- $194,900
- Delta
- -36.18%
- Verdict
- UNDERPRICED
- Comps
- 20 within 1.0 mi
Show comp detail 12 sales within ~0.75 mi
| Address | Dist | Beds/Ba | Sqft | Sold | Price | $/sf | Match |
|---|---|---|---|---|---|---|---|
| 248 Peach St | 0.40mi | 6/2.0 | 2,612 (+1%) | 4mo | $191,000 | $73 | 76 |
| 44 Laurel St | 0.40mi | 6/2.0 | 2,600 (+1%) | 10mo | $130,100 | $50 | 72 |
| 211 Riley St | 0.40mi | 6/3.0 | 2,522 (-2%) | 7mo | $210,000 | $83 | 68 |
| 361 E North St Unit S | 0.48mi | 5/2.5 (-1) | 2,544 (-1%) | 3mo | $172,500 | $68 | 66 |
| 248 Dodge St | 0.27mi | 6/3.0 | 2,520 (-2%) | 20mo | $345,000 | $137 | 64 |
| 243 Peach St | 0.43mi | 6/2.0 | 2,560 (-1%) | 20mo | $149,000 | $58 | 62 |
| 109 Northampton St | 0.19mi | 6/2.0 | 2,748 (+7%) | 22mo | $325,000 | $118 | 62 |
| 253 High St | 0.37mi | 6/2.0 | 2,448 (-5%) | 16mo | $233,000 | $95 | 61 |
| 37 Pershing Ave | 0.67mi | 5/3.0 (-1) | 2,641 (+2%) | 1mo | $85,000 | $32 | 54 |
| 157 Park St | 0.66mi | 5/3.0 (-1) | 2,644 (+3%) | 11mo | $661,000 | $250 | 46 |
| 53 Pershing Ave | 0.66mi | 5/2.0 (-1) | 2,360 (-8%) | 11mo | $149,000 | $63 | 42 |
| 494 Best St | 0.69mi | 6/2.0 | 2,352 (-9%) | 17mo | $267,000 | $114 | 39 |
Match score weights: distance 35% · size 25% · config 20% · recency 20%. Top-matched comps best support the ARV.
Projected returns pro-forma
1.86% appreciation · 8.0% rent growth · sell at horizon
- IRR
- 54.1%
- Equity multiple
- 4.05×
- Total profit
- $166,376
- Equity at exit
- $75,429
- IRR
- 56.8%
- Equity multiple
- 9.45×
- Total profit
- $461,283
- Equity at exit
- $107,519
Cash invested: $54,572 (down + closing). Projections, not guarantees.
Landlord ↔ Tenant lean methodology
- Overall (STATE)
- 15 Strongly Tenant-Friendly
- State New York
- 15 Strongly Tenant-Friendly · D+10
- County
- — inherits STATE
- City
- — inherits STATE
ZIP-level market 14209
- Home prices YoY
- 0.4%
- Rents YoY
- 8.5%
- Active inventory
- 56
- Price-to-rent
- 7.9×
Monthly cashflow live
- Estimated rent
- $4,089 high interval (Pro) →
- Mortgage (P&I)
- −$1,022
- Tax from tax record
- −$42 /mo · $499/yr
- Insurance
- −$81
- HOA
- −$0
- Vacancy / Maint / Mgmt
- −$859
- Net cashflow
- $2,085
Break-even live
Sensitivity live
| Price | -10% $2,196 | -5% $2,141 | +0% $2,085 | +5% $2,030 | +10% $1,975 |
|---|---|---|---|---|---|
| Rent | -10% $1,762 | -5% $1,924 | +0% $2,085 | +5% $2,247 | +10% $2,409 |
| Rate | -1.0pp $2,184 | -0.5pp $2,135 | base $2,085 | +0.5pp $2,035 | +1.0pp $1,984 |
2-unit breakdown (identical units grouped — click to expand)
| Units | Beds | Baths | Est. rent |
|---|---|---|---|
| 2× units | 3 | — | $4,090 |
| #1 | 3 | — | $2,045 |
| #2 | 3 | — | $2,045 |
| Total (2 units) | $4,089 | ||
UW: 25.0% down · 7.5% · 30yr · 1.5% tax · 5.0% vac · 8.0% maint · 8.0% mgmt
Financing live
Cash to close
- Down payment
- $48,725
- Closing costs
- $5,847
- Reserves months
- —
- Total cash needed
- —
Loan-product check · same deal, 3 products live
Conventional
25% down · 7.5% · 30yr
- Down + closing
- —
- Monthly P&I
- —
- Monthly cashflow
- —
- DSCR
- —
- Eligible?
- —
Personal DTI + credit; lowest rate.
DSCR
20% down · 8.5% · 30yr
- Down + closing
- —
- Monthly P&I
- —
- Monthly cashflow
- —
- DSCR
- —
- Eligible?
- —
No personal income docs; deal must DSCR.
Hard money
10% down · 12.0% · 12mo
- Down + closing
- —
- Monthly P&I
- —
- Monthly cashflow
- —
- DSCR
- —
- Eligible?
- —
Short-term bridge; refi at stabilization.
Rent comps 1 comps
| Address | Beds | Baths | Sqft | Rent | $/sqft | DOM | Units | Dist |
|---|---|---|---|---|---|---|---|---|
| 518 Wilson St Buffalo, NY | 5.0 | 1.5 | 1848 | $1,500 | $0.81 | 24d | 1 | 1.22mi |
Listing history 21 events
-
2026-06-18days on market $194,900 Active 40 DOM
-
2026-06-17days on market $194,900 Active 39 DOM
-
2026-06-16remarks 690-char remark
-
2026-06-16days on market $194,900 Active 38 DOM
-
2026-06-15days on market $194,900 Active 37 DOM
-
2026-06-13days on market $194,900 Active 35 DOM
-
2026-06-13days on market $194,900 Active 34 DOM
-
2026-06-10days on market $194,900 Active 32 DOM
-
2026-06-09days on market $194,900 Active 31 DOM
-
2026-06-08days on market $194,900 Active 30 DOM
-
2026-06-07days on market $194,900 Active 29 DOM
-
2026-06-03days on market $194,900 Active 25 DOM
-
2026-06-02days on market $194,900 Active 24 DOM
-
2026-06-01days on market $194,900 Active 23 DOM
-
2026-05-31days on market $194,900 Active 22 DOM
-
2026-05-08$194,900 Active 842-char remark
-
2016-10-06soldstatus $95,000 Closed Sale or Rented 297-char remark
Show marketing remark (297 chars)
Great Investment / Income Property! Large 3/3 duplex minutes away from Medical Hospital, close to Downtown Buffalo. Upper unit updated. Features include: hardwood floors, gas fireplace(NRTC). Large bedrooms and kitchens. Lots of storage. Call today to schedule a showing in this very desired area!
-
2016-09-29soldstatus $95,000
-
2016-05-19status Pending Sale 297-char remark
Show marketing remark (297 chars)
Great Investment / Income Property! Large 3/3 duplex minutes away from Medical Hospital, close to Downtown Buffalo. Upper unit updated. Features include: hardwood floors, gas fireplace(NRTC). Large bedrooms and kitchens. Lots of storage. Call today to schedule a showing in this very desired area!
-
2016-05-04$85,000 Active 297-char remark
Show marketing remark (297 chars)
Great Investment / Income Property! Large 3/3 duplex minutes away from Medical Hospital, close to Downtown Buffalo. Upper unit updated. Features include: hardwood floors, gas fireplace(NRTC). Large bedrooms and kitchens. Lots of storage. Call today to schedule a showing in this very desired area!
-
2004-03-05soldstatus $32,725
ⓘ Source: listings_history table (triggers on properties + properties_extension) + one-shot
backfill from property_details.listing_events for pre-trigger history.
Tax reassessment forecast NY · Partial reset (capped growth)
- Current annual tax
- $499 · $42/mo
- Projected year-2 tax
- $1,896 · $158/mo
- Expected delta
- +$1,398/yr (+$116/mo · 280.3%)
ⓘ Screening estimate from a state-policy table — verify with the county assessor before closing.
Climate risk First Street
- Flood 1/10 Low FEMA zone X (unshaded) · 0% chance over 30 yrs
- Wildfire 1/10 Low
- Heat 3/10 Moderate 7 d/yr ≥91°F today · 15 d/yr by 30 yrs out
- Wind 1/10 Low
- Air quality 4/10 Moderate 4 unhealthy d/yr today · 9 by 30 yrs out
Nearby sold comps map
Loading sold comps map…
Walkable amenities ~0.75 mi
Loading nearby amenities…
Taxation est. · year 1
- Rental income
- $49,068
- − Mortgage interest
- −$10,917
- − Property taxes
- −$499
- − Insurance
- −$974
- − Repairs & maintenance
- −$3,925
- − Management
- −$3,925
- − Depreciation
- −$5,670
- Taxable income
- $23,157
- Est. tax owed @ 24.0%
- −$5,558
- After-tax cash flow
- $19,468/yr
For passive investors: Depreciation is non-cash, so a rental often shows a tax loss while cash-flowing — sheltering income. Rental losses are passive: they offset passive income freely, and up to $25,000/yr can offset ordinary (W-2) income if you actively participate and your MAGI is under $100k (phasing out to $0 by $150k); unused losses carry forward. On sale, claimed depreciation is recaptured at up to 25%, and gains may owe capital-gains tax (a 1031 exchange can defer both). Figures are a year-1 estimate at your 24.0% rate — not tax advice; consult a CPA.
Schools (NCES district)
- District
- Buffalo City School District
- NCES district ID
- 3605850
- Math proficiency
- 41% ▲ 11.00%
- Reading proficiency
- 40% ▲ 7.00%
- Median HH income
- $31,665
- Composite
- 33.17/100
- National rank
- #5544
- State rank
- #535 of 590 in NY
Livability — Buffalo
- Score
- 77/100
- State rank
- #195
- US rank
- #3011
Category grades
Schools grade is shown separately in the Schools card above.
Census & demographics
- Census place
- Buffalo, NY
- County
- Erie County · 714,559 people
- City population
- 440,021
- Metro
- Buffalo-Cheektowaga, NY
- Population (ZIP)
- 8,313
- Household income
- $50,046
- Rent vs Own
- Severe rent burden
- 959.0
Population outlook (Erie County) Hauer SSP2
- Today (2025)
- 933,037 people
- By 2030
- 935,181 · +0.2%
- By 2040
- 928,531 · -0.5%
- By 2050
- 905,725 · -2.9%
- By 2075
- 834,037 · -10.6%
- By 2100
- 708,033 · -24.1%
Race, ethnicity, and origin ACS 2023
- Neighborhood character
- Diverse neighborhood (Simpson 0.62)
- Race & ethnicity
- White 53% Black 30% Hispanic / Latino 11% Two or more races 5% Asian 3%
- Hispanic origin (detail)
- Puerto Rican 6% Dominican 1%
- Common ancestry
- Romanian 6% Lithuanian 2% Scotch-Irish 2%
- Foreign-born
- 9% · Canada, Dominican Republic, China
- Languages at home
- 88% English-only · Spanish 5% Other Indo-European 2% French/Haitian/Cajun 2%
Political lean MEDSL · Erie
- 2024 margin
- Lean D (+9.7) · D 54.8% · R 45.2%
- 2008→2024 swing
- -7.9pp toward R · 2008: 17.5pp · 2024: 9.7pp
- All cycles
- 2024: D+9.7 2020: D+14.7 2016: D+4.8 2012: D+15.6 2008: D+17.5
Not yet ingested
- Civics
- —
Market trends
- HPI YoY
- ▲ 1.86%
- Current HPI
- 443.9414
- Rent YoY
- ▲ 8.53%
- Metro
- Buffalo-Cheektowaga, NY
- State GDP YoY
- ▲ 2.60%
- F500 in state
- 92
Industry mix (Fortune 500 HQ in NY)
| Industry | F500 HQs | Revenue |
|---|---|---|
| Financial Services | 10 | $950B |
|
||
| Consumer Goods | 9 | $162B |
|
||
| Insurance | 4 | $225B |
|
||
| Telecommunications | 2 | $144B |
|
||
| Pharmaceuticals | 2 | $112B |
|
||
| Media / Entertainment | 2 | $69B |
|
||
Price history
+495.6% since first listed6 events — show timeline
- 2026-05-08 Listed $194,900 WNYREIS
- 2016-10-06 Sold (MLS) $95,000 WNYREIS
- 2016-09-29 Sold (Public Records) $95,000 Public Records
- 2016-05-19 Pending — WNYREIS
- 2016-05-04 Listed $85,000 WNYREIS
- 2004-03-05 Sold (Public Records) $32,725 Public Records
Property tax history
+10.7%/yrLatest (2025): $499 · -14.5% YoY. Source: county tax records.
Cash-flow waterfall
monthlySold comps — $/sqft
last 12 mo · ≤1 miLoading sold comps…