32507 Pea Ridge Rd · Albany, LA
Flood risk 6/10 · Moderate
- FEMA flood zone
- X (unshaded)
- Chance of flooding over 30 yrs
- 0.69%
- Est. flood insurance / yr
- $507 – $1,088
Fire risk 8/10 · Major
- Est. fire insurance / yr
- $1,269 – $2,357
Heat risk 8/10 · Major
- Hot days now (above 109°F)
- 7 days/yr
- Hot days in 30 yrs
- 20 days/yr
Wind risk 9/10 · Severe
- Chance of severe wind over 30 yrs
- 99.0%
Air-quality risk 2/10 · Minimal
- Unhealthy air days now
- 0 days/yr
- Unhealthy air days in 30 yrs
- 1 days/yr
Risk factors via First Street. Map © Google.
Why this score? — see what drove the D grade
The composite is a weighted blend of 9 inputs, each scored 0–100. Each bar is that input's sub-score; the figure is the points it added to the 100-point composite (weight × sub-score).
- Cash flow +13.6/30.0
- ARV discount +6.4/15.0
- DSCR +4.1/10.0
- Schools +4.0/10.0
- Livability +3.9/5.0
- 1% rule +3.8/10.0
- Rent growth +2.5/5.0
- Condition / age +2.2/5.0
- Appreciation +0.0/10.0
$179,000
🖨 Deal sheet (PDF) 📄 Offer letter ✓ Due diligence
Listing remarks MLS
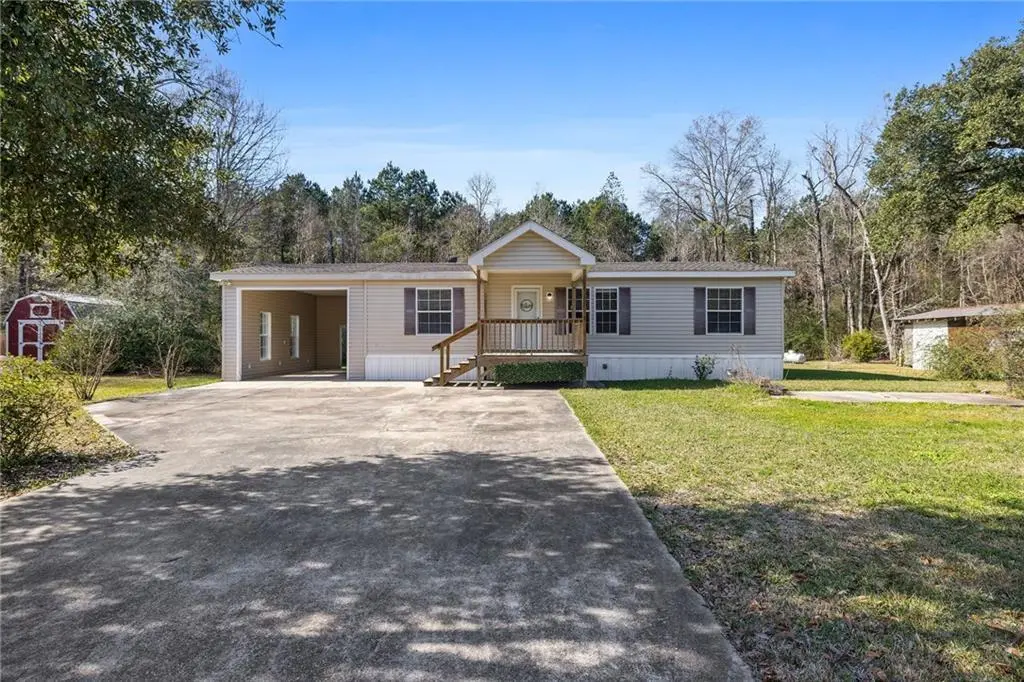
Three bedroom, two bath doublewide home on .38 of an acre in the Albany school district. Features a concrete driveway, one car covered attached garage, storage shed all in an X flood zone.
Key facts
- Storage shed
- Concrete driveway
- 0.38 acre lot
Tags
Neighborhood map
What this means for you Summary
Snapshot
- This is a 3-bed/2.0-bath single-family listed at $179k. Condition is rated fair.
Deal economics
- At list price, monthly cash flow is $10 ($119/yr) — positive.
- The deal already cash-flows at list — no discount required.
- To meet the 1% rule (rent ≥ 1% of price), the offer needs to be $158k (11.8% below list).
- Recommended offer: $158k (12.0% below list) — sets the bar for market timing.
- Cap rate 6.4% vs local median 4.7% in Albany — top-decile yield for the area; either an underpriced asset or a hidden risk that comps aren't pricing in. Stress-test before assuming the spread holds.
Location & tenants
- Location reads 77/100 on livability (#12 in LA, #3,099 nationally) — a middle-class / working-renter tenant base. Strengths: schools A+, cost of living A+, housing A+; Watch: amenities F, commute F.
- Livingston Parish (suburban): math 40% / reading 52% proficiency, ranked #13 of 98 in LA (top 13%) — families likely to look elsewhere, expect single-tenant / working-renter base with shorter leases.
- Market conditions: 40 active listings in the ZIP; 794 units permitted in Livingston Parish in 2024 (99 in 5+ unit buildings).
Forward outlook
- Local home prices are declining (-3.0%/yr); year-one equity from $1k of loan paydown is wiped out by about $5k of value loss. Plan a longer hold.
- Livingston County population projected at +27% by 2050 — long-run rental-demand tailwind backs the buy-and-hold thesis.
Negotiation context
- It's been on market 151 days — a 12% lower offer ($158k) is reasonable based on typical stale-listing flexibility.
- 2 sale attempts with the ask held roughly flat each time — persistent listings suggest the price (not the market) is what's stuck; bring a comps-based counter.
Risks & watch-outs
- Climate carrying-cost: major flood risk; severe wind risk, 99% chance of damaging wind over 30y; severe wildfire risk; extreme-heat days projected 7→20/yr by 2055 (HVAC capex compounding) — expect insurance premiums to compound above CPI over the hold.
Questions for the listing agent
- It's been on market 151 days. Have you received any prior offers? Is the seller open to a 12% concession, seller financing, or rate buy-down credit?
- Have any recent inspections been done? Can we get a copy of the seller's disclosures and any deferred-maintenance estimates?
- Why hasn't it sold? Are there any deal-killer items the seller is aware of (foundation, flood, title, zoning, code violations)?
- Is there a deadline driving the sale (1031 exchange, divorce, estate, relocation)? That informs how much negotiation room exists.
- Schools are A-rated — typically a magnet for longer-tenancy family renters. What's the average tenant stay here, and is there a school-zone premium baked into asking?
- The area grade is low — what's the realistic commute time and amenity access for the typical tenant pool here? Any planned neighborhood developments (good or bad) we should know about?
- What's the average days-on-market for RENTAL listings here right now (not sales)? A rising rental-DOM trend means longer vacancies and softer asking-rent achievability than the comps imply.
- What's the recent tenant-quality profile in this submarket — average credit score on applications, eviction rate, late-payment / NSF rate, and stable-employment percentage? A property-management company in the area should have these aggregated.
- How much new for-sale + rental construction is in the pipeline within 1–3 miles? Heavy new supply typically softens prices + rents 12–24 months out; constrained supply supports both.
Investment metrics
- 1% rule
- 0.88% ✗
- Cap rate
- 6.36%
- Cash-on-cash
- 0.24%
- DSCR
- 1.01
- GRM
- 9.5
CMA / ARV
- ARV (median comp)
- $174,715
- List price
- $179,000
- Delta
- 2.45%
- Verdict
- FAIR
- Comps
- 4 within 1.0 mi
Show comp detail 1 sale within ~0.75 mi
| Address | Dist | Beds/Ba | Sqft | Sold | Price | $/sf | Match |
|---|---|---|---|---|---|---|---|
| 27670 Jc Stewart Rd | 0.62mi | 3/2.0 | 1,110 (-5%) | 8mo | $155,000 | $140 | 56 |
Match score weights: distance 35% · size 25% · config 20% · recency 20%. Top-matched comps best support the ARV.
Projected returns pro-forma
-3.0% appreciation · 3.0% rent growth · sell at horizon
- IRR
- -15.9%
- Equity multiple
- 0.43×
- Total profit
- $-28,348
- Equity at exit
- $26,689
- IRR
- -7.5%
- Equity multiple
- 0.53×
- Total profit
- $-23,772
- Equity at exit
- $15,477
Cash invested: $50,120 (down + closing). Projections, not guarantees.
Landlord ↔ Tenant lean methodology
- Overall (STATE)
- 90 Strongly Landlord-Friendly
- State Louisiana
- 90 Strongly Landlord-Friendly · R+12
- County
- — inherits STATE
- City
- — inherits STATE
ZIP-level market 70711
- Home prices YoY
- -11.3%
- Active inventory
- 40
- Price-to-rent
- 9.5×
Monthly cashflow live
- Estimated rent
- $1,578 medium interval (Pro) →
- Mortgage (P&I)
- −$939
- Tax est. 1.5%
- −$224 /mo · $2,685/yr
- Insurance
- −$75
- HOA
- −$0
- Vacancy / Maint / Mgmt
- −$331
- Net cashflow
- $10
Break-even live
Sensitivity live
| Price | -10% $134 | -5% $72 | +0% $10 | +5% $-52 | +10% $-114 |
|---|---|---|---|---|---|
| Rent | -10% $-115 | -5% $-52 | +0% $10 | +5% $72 | +10% $135 |
| Rate | -1.0pp $100 | -0.5pp $55 | base $10 | +0.5pp $-36 | +1.0pp $-84 |
UW: 25.0% down · 7.5% · 30yr · 1.5% tax · 5.0% vac · 8.0% maint · 8.0% mgmt
Financing live
Cash to close
- Down payment
- $44,750
- Closing costs
- $5,370
- Reserves months
- —
- Total cash needed
- —
Loan-product check · same deal, 3 products live
Conventional
25% down · 7.5% · 30yr
- Down + closing
- —
- Monthly P&I
- —
- Monthly cashflow
- —
- DSCR
- —
- Eligible?
- —
Personal DTI + credit; lowest rate.
DSCR
20% down · 8.5% · 30yr
- Down + closing
- —
- Monthly P&I
- —
- Monthly cashflow
- —
- DSCR
- —
- Eligible?
- —
No personal income docs; deal must DSCR.
Hard money
10% down · 12.0% · 12mo
- Down + closing
- —
- Monthly P&I
- —
- Monthly cashflow
- —
- DSCR
- —
- Eligible?
- —
Short-term bridge; refi at stabilization.
Listing history 19 events
-
2026-06-22days on market $179,000 Active 151 DOM
-
2026-06-18days on market $179,000 Active 148 DOM
-
2026-06-17days on market $179,000 Active 147 DOM
-
2026-06-16days on market $179,000 Active 146 DOM
-
2026-06-15days on market $179,000 Active 145 DOM
-
2026-06-14days on market $179,000 Active 143 DOM
-
2026-06-13days on market $179,000 Active 142 DOM
-
2026-06-10days on market $179,000 Active 140 DOM
-
2026-06-08days on market $179,000 Active 138 DOM
-
2026-06-07days on market $179,000 Active 137 DOM
-
2026-06-03days on market $179,000 Active 133 DOM
-
2026-06-02days on market $179,000 Active 132 DOM
-
2026-06-01days on market $179,000 Active 131 DOM
-
2026-05-31days on market $179,000 Active 130 DOM
-
2026-05-31days on market $179,000 Active 129 DOM
-
2026-04-13price $179,000 188-char remark
Show marketing remark (189 chars)
Three bedroom, two bath doublewide home on . 38 of an acre in the Albany school district. Features a concrete driveway, one car covered attached garage, storage shed all in an X flood zone.
-
2026-04-13price $179,000 189-char remark
Show marketing remark (189 chars)
Three bedroom, two bath doublewide home on . 38 of an acre in the Albany school district. Features a concrete driveway, one car covered attached garage, storage shed all in an X flood zone.
-
2026-01-21$181,000 Active 188-char remark
Show marketing remark (189 chars)
Three bedroom, two bath doublewide home on . 38 of an acre in the Albany school district. Features a concrete driveway, one car covered attached garage, storage shed all in an X flood zone.
-
2026-01-21$181,000 Active 189-char remark
Show marketing remark (189 chars)
Three bedroom, two bath doublewide home on . 38 of an acre in the Albany school district. Features a concrete driveway, one car covered attached garage, storage shed all in an X flood zone.
ⓘ Source: listings_history table (triggers on properties + properties_extension) + one-shot
backfill from property_details.listing_events for pre-trigger history.
Climate risk First Street
- Flood 6/10 Major FEMA zone X (unshaded) · 69% chance over 30 yrs
- Wildfire 8/10 Severe
- Heat 8/10 Severe 7 d/yr ≥109°F today · 20 d/yr by 30 yrs out
- Wind 9/10 Extreme 99% chance of damaging wind over 30 yrs
- Air quality 2/10 Low 0 unhealthy d/yr today · 1 by 30 yrs out
Nearby sold comps map
Loading sold comps map…
Walkable amenities ~0.75 mi
Loading nearby amenities…
Taxation est. · year 1
- Rental income
- $18,942
- − Mortgage interest
- −$10,027
- − Property taxes
- −$2,685
- − Insurance
- −$895
- − Repairs & maintenance
- −$1,515
- − Management
- −$1,515
- − Depreciation
- −$5,207
- Taxable loss
- −$2,903
- Est. tax savings @ 24.0%
- +$697
- After-tax cash flow
- $816/yr
For passive investors: Depreciation is non-cash, so a rental often shows a tax loss while cash-flowing — sheltering income. Rental losses are passive: they offset passive income freely, and up to $25,000/yr can offset ordinary (W-2) income if you actively participate and your MAGI is under $100k (phasing out to $0 by $150k); unused losses carry forward. On sale, claimed depreciation is recaptured at up to 25%, and gains may owe capital-gains tax (a 1031 exchange can defer both). Figures are a year-1 estimate at your 24.0% rate — not tax advice; consult a CPA.
Condition & rehab AI · 6 photos
The home is in fair condition with moderate repairs needed, primarily focusing on exterior and landscaping improvements. These updates can significantly increase its resale and rental value.
Repairs flagged
- Moderate Exterior siding — There are visible signs of wear on the exterior siding.
- Minor Landscaping — The landscaping is basic and could be improved to enhance curb appeal.
- Minor Front porch — The front porch could be updated to improve the home's curb appeal.
Value-add opportunities
- Both Landscaping and curb appeal improvements — Enhanced landscaping and curb appeal can increase both resale and rental value.
- Both Exterior siding repair — Repairing the exterior siding can improve the home's appearance and increase its value.
- Both Paint touch-ups — Paint touch-ups can improve the home's appearance and increase its value.
- Both Front porch update — Updating the front porch can improve the home's curb appeal and increase its value.
Renovation cost estimate screening
| Repair item | Severity | Est. cost |
|---|---|---|
| Exterior siding · There are visible signs of wear on the exterior siding. | Moderate | $3,000–15,000 |
| Landscaping · The landscaping is basic and could be improved to enhance curb appeal. | Minor | $500–3,000 |
| Front porch · The front porch could be updated to improve the home's curb appeal. | Minor | $500–3,000 |
| Total estimated repair cost · 3 items | $4,000–21,000 |
Value-add ROI direction
- Both Landscaping and curb appeal improvements — Enhanced landscaping and curb appeal can increase both resale and rental value. ↑
- Both Exterior siding repair — Repairing the exterior siding can improve the home's appearance and increase its value. ↑
- Both Paint touch-ups — Paint touch-ups can improve the home's appearance and increase its value. ↑
- Both Front porch update — Updating the front porch can improve the home's curb appeal and increase its value. ↑
ⓘ Cost ranges are severity-bucket heuristics (US national rule-of-thumb). Get contractor quotes + a written scope before underwriting a rehab budget.
Schools (NCES district)
- District
- Livingston Parish
- NCES district ID
- 2201020
- Math proficiency
- 40% ▼ -38.00%
- Reading proficiency
- 52% ▼ -32.00%
- Median HH income
- $56,755
- Composite
- 40.07/100
- National rank
- #3811
- State rank
- #13 of 98 in LA
Livability — Albany
- Score
- 77/100
- State rank
- #12
- US rank
- #3099
Category grades
Schools grade is shown separately in the Schools card above.
Census & demographics
- Population (ZIP)
- 5,621
Population outlook (Livingston County) Hauer SSP2
- Today (2025)
- 158,511 people
- By 2030
- 168,241 · +6.1%
- By 2040
- 186,252 · +17.5%
- By 2050
- 201,516 · +27.1%
- By 2075
- 231,217 · +45.9%
- By 2100
- 241,697 · +52.5%
Race, ethnicity, and origin ACS 2023
- Neighborhood character
- Predominantly White (88%)
- Race & ethnicity
- White 88% Hispanic / Latino 6% Two or more races 2%
- Hispanic origin (detail)
- Mexican 6%
- Common ancestry
- Lithuanian 11% Romanian 1%
- Foreign-born
- 6% · Canada
- Languages at home
- 93% English-only · Spanish 7%
Political lean MEDSL · Livingston
- 2024 margin
- Solid R (+68.5) · D 15.1% · R 83.6% · Other 1.3%
- 2008→2024 swing
- +3.4pp toward D · 2008: -71.9pp · 2024: -68.5pp
- All cycles
- 2024: R+68.5 2020: R+70.0 2016: R+72.5 2012: R+70.4 2008: R+71.9
Not yet ingested
- Civics
- —
Market trends
- HPI YoY
- ▼ -23.34%
- Current HPI
- 182.8335
- Rent YoY
- —
- Metro
- —
- State GDP YoY
- ▲ 3.29%
- F500 in state
- 10
Industry mix (Fortune 500 HQ in LA)
| Industry | F500 HQs | Revenue |
|---|---|---|
| Telecommunications | 2 | $23B |
|
||
| Utilities | 1 | $12B |
|
||
| Wholesale / Distribution | 1 | $5B |
|
||
| Advertising | 1 | $2B |
|
||
Price history
-1.1% since first listed4 events — show timeline
- 2026-04-13 Price Changed $179,000 AcadianaMLS
- 2026-04-13 Price Changed $179,000 GSREIN
- 2026-01-21 Listed $181,000 GSREIN
- 2026-01-21 Listed $181,000 AcadianaMLS
Cash-flow waterfall
monthlySold comps — $/sqft
last 12 mo · ≤1 miLoading sold comps…