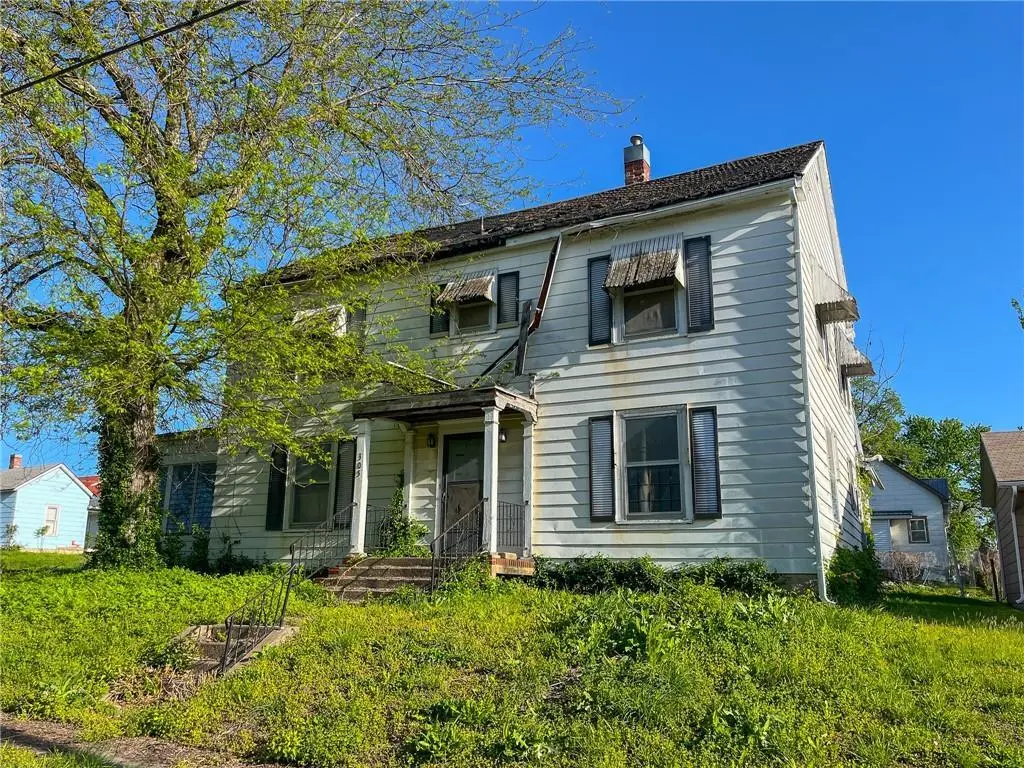
305 E 10th St · Trenton, MO
Flood risk 1/10 · Minimal
- FEMA flood zone
- X (unshaded)
- Chance of flooding over 30 yrs
- 0.0%
- Est. flood insurance / yr
- $473 – $860
Fire risk 1/10 · Minimal
- Est. fire insurance / yr
- $1,054 – $1,958
Heat risk 4/10 · Minor
- Hot days now (above 106°F)
- 7 days/yr
- Hot days in 30 yrs
- 15 days/yr
Wind risk 2/10 · Minimal
- Chance of severe wind over 30 yrs
- —
Air-quality risk 2/10 · Minimal
- Unhealthy air days now
- 0 days/yr
- Unhealthy air days in 30 yrs
- 2 days/yr
Risk factors via First Street. Map © Google.
Why this score? — see what drove the D grade
The composite is a weighted blend of 9 inputs, each scored 0–100. Each bar is that input's sub-score; the figure is the points it added to the 100-point composite (weight × sub-score).
- Cash flow +15.0/30.0
- ARV discount +7.5/15.0
- 1% rule +5.0/10.0
- DSCR +5.0/10.0
- Livability +3.8/5.0
- Schools +3.0/10.0
- Rent growth +2.5/5.0
- Condition / age +2.5/5.0
- Appreciation +0.0/10.0
$25,000
🖨 Deal sheet 📄 Offer letter ✓ Due diligence
Listing remarks MLS
PRICED TO SELL! OWNER FINANCE AVAILABLE! Built in 1900, this large two-story home has seen a lot of Missouri weather — and it shows. With portions of the roof open to the sky and sections of the second-floor ceiling giving way to sunlight and rain, it’s safe to say this property needs serious attention. Expect water damage, sagging floors, and a project that’s not for the faint of heart. That said — beneath the wear and weathering is the kind of old-home charm that just can’t be replicated today. High ceilings, classic lines, and solid bones are still here, waiting for the right person with vision, grit, and maybe a good hard hat. If you’re looking for a move-in-ready home, keep scrolling. But if you’re the kind who sees possibility where others see plywood, this might be your next great story. Bring your contractor, your imagination, and your fearless spirit — and see what this 1900 classic could become again.
Key facts
- 0.23 acre lot
- Garage
- Built 1900
Neighborhood map
What this means for you Summary
Snapshot
- This is a 4-bed/1.5-bath single-family listed at $25k.
Deal economics
- At list price, monthly cash flow is $818 ($10k/yr) — positive.
- The deal already cash-flows at list — no discount required.
- Meets the 1% rule at list price ($1k rent vs $25k).
- Cap rate 45.6% vs local median 6.2% in Trenton — top-decile yield for the area; either an underpriced asset or a hidden risk that comps aren't pricing in. Stress-test before assuming the spread holds.
Location & tenants
- Location reads 76/100 on livability (#49 in MO, #3,686 nationally) — a middle-class / working-renter tenant base. Strengths: cost of living A+, housing A+, health & safety A+; Watch: schools C-, employment C-, amenities F.
- Trenton R-IX (town): math 28% / reading 43% proficiency, ranked #223 of 324 in MO (top 69%) — families likely to look elsewhere, expect single-tenant / working-renter base with shorter leases.
- Market conditions: 50 active listings in the ZIP; 2 units permitted in Grundy County in 2024 (0 in 5+ unit buildings).
Forward outlook
- Local home prices are declining (-3.0%/yr); year-one equity from $173 of loan paydown is wiped out by about $750 of value loss. Plan a longer hold.
- Grundy County population projected at -14% by 2050 — secular population decline; favor cash flow + early exit over multi-decade hold.
- At projected returns (-3.0% appreciation + 3.0% rent growth), your $7k cash investment doubles in ~1 year — after that, you're playing with house money.
Negotiation context
- Only 7 days on market — expect competitive offers; lowballing is unlikely to land.
- 2 sale attempts since 12y ago; this cycle's ask is 26% above the opening price — seller raised mid-cycle; expect resistance to lowballs.
Risks & watch-outs
- Watch-outs: built in 1900 — expect roof / HVAC / electrical / plumbing capex.
Questions for the listing agent
- Built in 1900 — when were the roof, HVAC, electrical panel, plumbing, and water heater last replaced?
- Is there a deadline driving the sale (1031 exchange, divorce, estate, relocation)? That informs how much negotiation room exists.
- The area grade is low — what's the realistic commute time and amenity access for the typical tenant pool here? Any planned neighborhood developments (good or bad) we should know about?
- What's the average days-on-market for RENTAL listings here right now (not sales)? A rising rental-DOM trend means longer vacancies and softer asking-rent achievability than the comps imply.
- What's the recent tenant-quality profile in this submarket — average credit score on applications, eviction rate, late-payment / NSF rate, and stable-employment percentage? A property-management company in the area should have these aggregated.
- How much new for-sale + rental construction is in the pipeline within 1–3 miles? Heavy new supply typically softens prices + rents 12–24 months out; constrained supply supports both.
Investment metrics
- 1% rule
- 4.98% ✓
- Cap rate
- 45.55%
- Cash-on-cash
- 140.22%
- DSCR
- 7.24
- GRM
- 1.7
CMA / ARV
- ARV (median comp)
- $77,673
- List price
- $25,000
- Delta
- -74.38%
- Verdict
- UNDERPRICED
- Comps
- 20 within 1.0 mi
Show comp detail 12 sales within ~0.75 mi
| Address | Dist | Beds/Ba | Sqft | Sold | Price | $/sf | Match |
|---|---|---|---|---|---|---|---|
| 302 E 10th Ct | 0.02mi | 3/1.5 (-1) | 1,516 (-7%) | 0mo | $79,900 | $53 | 82 |
| 1013 Mcpherson St | 0.03mi | 4/2.0 | 1,617 (-0%) | 18mo | $59,900 | $37 | 81 |
| 502 Ridgeway St | 0.31mi | 3/2.0 (-1) | 1,556 (-4%) | 4mo | $149,900 | $96 | 68 |
| 1428 Cedar St | 0.39mi | 3/1.0 (-1) | 1,696 (+4%) | 1mo | $49,900 | $29 | 67 |
| 911 Laclede St | 0.10mi | 3/2.0 (-1) | 1,714 (+6%) | 19mo | $175,000 | $102 | 63 |
| 511 E 9th St | 0.14mi | 5/1.0 (+1) | 1,860 (+14%) | 4mo | $49,900 | $27 | 59 |
| 708 Haliburton St | 0.23mi | 3/2.0 (-1) | 1,486 (-8%) | 15mo | $119,900 | $81 | 56 |
| 906 W 13th Ct | 0.71mi | 4/2.0 | 1,588 (-2%) | 9mo | $103,000 | $65 | 54 |
| 431 Tindall Ave | 0.47mi | 3/1.5 (-1) | 1,428 (-12%) | 8mo | $29,900 | $21 | 46 |
| 403 Linn St | 0.38mi | 4/1.5 | 1,821 (+12%) | 21mo | $39,900 | $22 | 45 |
| 114 Kavanaugh St | 0.57mi | 3/2.0 (-1) | 1,440 (-11%) | 10mo | $45,000 | $31 | 39 |
| 1917 Princeton Rd | 0.64mi | 3/1.5 (-1) | 1,388 (-14%) | 10mo | $59,000 | $43 | 32 |
Match score weights: distance 35% · size 25% · config 20% · recency 20%. Top-matched comps best support the ARV.
Projected returns pro-forma
-3.0% appreciation · 3.0% rent growth · sell at horizon
- IRR
- —
- Equity multiple
- 7.87×
- Total profit
- $48,058
- Equity at exit
- $3,728
- IRR
- —
- Equity multiple
- 16.57×
- Total profit
- $108,985
- Equity at exit
- $2,162
Cash invested: $7,000 (down + closing). Projections, not guarantees.
Landlord ↔ Tenant lean methodology
- Overall (STATE)
- 81 Strongly Landlord-Friendly
- State Missouri
- 81 Strongly Landlord-Friendly · R+10
- County
- — inherits STATE
- City
- — inherits STATE
ZIP-level market 64683
- Home prices YoY
- -14.6%
- Active inventory
- 50
- Price-to-rent
- 1.7×
Monthly cashflow live
- Estimated rent
- $1,244 medium interval (Pro) →
- Mortgage (P&I)
- −$131
- Tax from tax record
- −$23 /mo · $281/yr
- Insurance
- −$10
- HOA
- −$0
- Vacancy / Maint / Mgmt
- −$261
- Net cashflow
- $818
Break-even live
UW: 25.0% down · 7.5% · 30yr · 1.5% tax · 5.0% vac · 8.0% maint · 8.0% mgmt
Financing live
Cash to close
- Down payment
- $6,250
- Closing costs
- $750
- Reserves months
- —
- Total cash needed
- —
Loan-product check · same deal, 3 products live
Conventional
25% down · 7.5% · 30yr
- Down + closing
- —
- Monthly P&I
- —
- Monthly cashflow
- —
- DSCR
- —
- Eligible?
- —
Personal DTI + credit; lowest rate.
DSCR
20% down · 8.5% · 30yr
- Down + closing
- —
- Monthly P&I
- —
- Monthly cashflow
- —
- DSCR
- —
- Eligible?
- —
No personal income docs; deal must DSCR.
Hard money
10% down · 12.0% · 12mo
- Down + closing
- —
- Monthly P&I
- —
- Monthly cashflow
- —
- DSCR
- —
- Eligible?
- —
Short-term bridge; refi at stabilization.
Listing history 12 events
-
2026-06-18days on market $25,000 Active 7 DOM
-
2026-06-17days on market $25,000 Active 6 DOM
-
2026-06-16days on market $25,000 Active 5 DOM
-
2026-06-15days on market $25,000 Active 4 DOM
-
2026-06-13days on market $25,000 Active 2 DOM
-
2026-06-12remarks 669-char remark
-
2026-06-12pricedays on market $25,000 Active 1 DOM
-
2026-05-31days on market $19,900 Active 216 DOM
-
2025-10-27$19,900 Active 976-char remark
Show marketing remark (976 chars)
PRICED TO SELL! OWNER FINANCE AVAILABLE! Built in 1900, this large two-story home has seen a lot of Missouri weather — and it shows. With portions of the roof open to the sky and sections of the second-floor ceiling giving way to sunlight and rain, it’s safe to say this property needs serious attention. Expect water damage, sagging floors, and a project that’s not for the faint of heart. That said — beneath the wear and weathering is the kind of old-home charm that just can’t be replicated today. High ceilings, classic lines, and solid bones are still here, waiting for the right person with vision, grit, and maybe a good hard hat. If you’re looking for a move-in-ready home, keep scrolling. But if you’re the kind who sees possibility where others see plywood, this might be your next great story. Bring your contractor, your imagination, and your fearless spirit — and see what this 1900 classic could become again.
-
2025-02-11price $27,900
-
2014-08-12soldstatus
-
2014-06-09$2,500
ⓘ Source: listings_history table (triggers on properties + properties_extension) + one-shot
backfill from property_details.listing_events for pre-trigger history.
Tax reassessment forecast MO · Resets to sale price
- Current annual tax
- $281 · $23/mo
- Projected year-2 tax
- $281 · $23/mo
- Expected delta
- $0/yr ($0/mo · 0.0%)
ⓘ Screening estimate from a state-policy table — verify with the county assessor before closing.
Climate risk First Street
- Flood 1/10 Low FEMA zone X (unshaded) · 0% chance over 30 yrs
- Wildfire 1/10 Low
- Heat 4/10 Moderate 7 d/yr ≥106°F today · 15 d/yr by 30 yrs out
- Wind 2/10 Low
- Air quality 2/10 Low 0 unhealthy d/yr today · 2 by 30 yrs out
Nearby sold comps map
Loading sold comps map…
Walkable amenities ~0.75 mi
Loading nearby amenities…
Taxation est. · year 1
- Rental income
- $14,930
- − Mortgage interest
- −$1,400
- − Property taxes
- −$281
- − Insurance
- −$125
- − Repairs & maintenance
- −$1,194
- − Management
- −$1,194
- − Depreciation
- −$727
- Taxable income
- $10,007
- Est. tax owed @ 24.0%
- −$2,402
- After-tax cash flow
- $7,414/yr
For passive investors: Depreciation is non-cash, so a rental often shows a tax loss while cash-flowing — sheltering income. Rental losses are passive: they offset passive income freely, and up to $25,000/yr can offset ordinary (W-2) income if you actively participate and your MAGI is under $100k (phasing out to $0 by $150k); unused losses carry forward. On sale, claimed depreciation is recaptured at up to 25%, and gains may owe capital-gains tax (a 1031 exchange can defer both). Figures are a year-1 estimate at your 24.0% rate — not tax advice; consult a CPA.
Schools (NCES district)
- District
- Trenton R-IX
- NCES district ID
- 2930360
- Math proficiency
- 28% ▼ -7.00%
- Reading proficiency
- 43% ▼ -4.00%
- Median HH income
- $37,586
- Composite
- 29.52/100
- National rank
- #6499
- State rank
- #223 of 324 in MO
Livability — Trenton
- Score
- 76/100
- State rank
- #49
- US rank
- #3686
Category grades
Schools grade is shown separately in the Schools card above.
Census & demographics
- Census place
- Trenton, MO
- City population
- 7,648
- Population (ZIP)
- 7,648
Population outlook (Grundy County) Hauer SSP2
- Today (2025)
- 9,586 people
- By 2030
- 9,298 · -3.0%
- By 2040
- 8,783 · -8.4%
- By 2050
- 8,262 · -13.8%
- By 2075
- 7,011 · -26.9%
- By 2100
- 5,650 · -41.1%
Race, ethnicity, and origin ACS 2023
- Neighborhood character
- Predominantly White (91%)
- Race & ethnicity
- White 91% Two or more races 5% Hispanic / Latino 3% Asian 1%
- Common ancestry
- Serbian 2% Portuguese 1% Slovak 1%
- Foreign-born
- 1% · China
- Languages at home
- 98% English-only · German/W. Germanic 1% Chinese 1% Spanish 1%
Political lean MEDSL · Grundy
- 2024 margin
- Solid R (+63.6) · D 17.8% · R 81.4%
- 2008→2024 swing
- -33.5pp toward R · 2008: -30.1pp · 2024: -63.6pp
- All cycles
- 2024: R+63.6 2020: R+62.8 2016: R+60.8 2012: R+41.6 2008: R+30.1
Not yet ingested
- Civics
- —
Market trends
- HPI YoY
- ▼ -32.24%
- Current HPI
- 188.2901
- Rent YoY
- —
- Metro
- —
- State GDP YoY
- ▲ 1.84%
- F500 in state
- 20
Industry mix (Fortune 500 HQ in MO)
| Industry | F500 HQs | Revenue |
|---|---|---|
| Healthcare | 1 | $163B |
|
||
| Insurance | 1 | $21B |
|
||
| Industrial Technology | 1 | $17B |
|
||
| Retail | 1 | $16B |
|
||
| Industrial Distribution | 1 | $10B |
|
||
| Utilities | 1 | $9B |
|
||
Price history
+696.0% since first listed4 events — show timeline
- 2025-10-27 Listed $19,900 Heartland MLS as Distributed by MLS Grid
- 2025-02-11 Price Changed $27,900 Heartland MLS as Distributed by MLS Grid
- 2014-08-12 Sold (MLS) — Heartland MLS as Distributed by MLS Grid
- 2014-06-09 Listed $2,500 Heartland MLS as Distributed by MLS Grid
Property tax history
-2.6%/yrLatest (2025): $281 · +13.1% YoY. Source: county tax records.
Cash-flow waterfall
monthlySold comps — $/sqft
last 12 mo · ≤1 miLoading sold comps…