305 S Gibby Rd · Moses Lake, WA
Flood risk 6/10 · Moderate
- FEMA flood zone
- X (unshaded)
- Chance of flooding over 30 yrs
- 0.68%
- Est. flood insurance / yr
- $507 – $1,088
Fire risk 1/10 · Minimal
- Est. fire insurance / yr
- $604 – $1,122
Heat risk 4/10 · Minor
- Hot days now (above 96°F)
- 7 days/yr
- Hot days in 30 yrs
- 16 days/yr
Wind risk 1/10 · Minimal
- Chance of severe wind over 30 yrs
- —
Air-quality risk 7/10 · Major
- Unhealthy air days now
- 12 days/yr
- Unhealthy air days in 30 yrs
- 14 days/yr
Risk factors via First Street. Map © Google.
Why this score? — see what drove the B- grade
The composite is a weighted blend of 9 inputs, each scored 0–100. Each bar is that input's sub-score; the figure is the points it added to the 100-point composite (weight × sub-score).
- Cash flow +30.0/30.0
- 1% rule +10.0/10.0
- DSCR +10.0/10.0
- ARV discount +7.5/15.0
- Schools +3.9/10.0
- Livability +3.8/5.0
- Condition / age +2.5/5.0
- Rent growth +2.1/5.0
- Appreciation +0.0/10.0
$90,000
🖨 Deal sheet (PDF) 📄 Offer letter ✓ Due diligence
Listing remarks
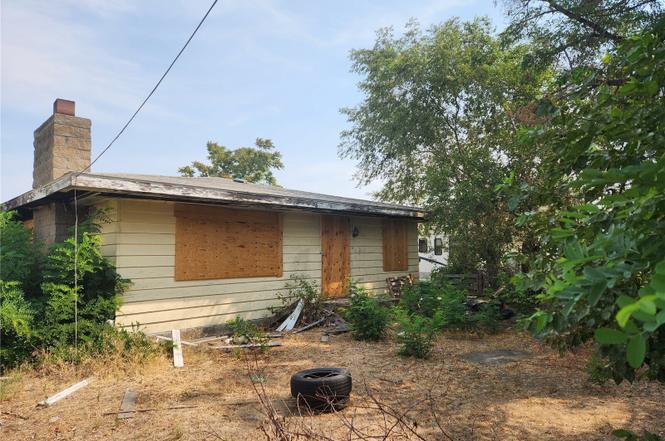
Investment Opportunity! Needs full remodel or tear down then build a home or duplex. 2 car detached garage was not damaged in fire. Large back yard. No entry allowed due to the fire damage is unsafe.
Key facts
- Large back yard
- Detached garage
- 9,583 sq ft lot
Tags
Property features AI
Finance
- Other: Property listed as residential single-family; Living area reported as 1,410; Lot size approximately 0.22 acres
- Financial info: Listing terms: Cash
Exterior
- Parking: Detached garage with covered parking for 2 vehicles
- Utilities: Electric energy source; Public water; Sewer connected
- Home design: Single-family residence; One story; Built on lot
- Construction: Wood construction; Composition roof; Poured concrete foundation; House structure; Built in fixer condition
- Exterior features: Wood exterior products
Interior
- Bedrooms: Three bedrooms, all on the main level
- Bathrooms: One full bathroom on the main level
- Heating & cooling: Heating present (details in remarks); Cooling present
- Interior features: Level topography; Fixer condition
Neighborhood map
What this means for you Summary
Snapshot
- This is a 3-bed/1.0-bath single-family listed at $90k.
Deal economics
- At list price, monthly cash flow is $730 ($9k/yr) — positive.
- The deal already cash-flows at list — no discount required.
- Meets the 1% rule at list price ($2k rent vs $90k).
- Cap rate 16.0% vs local median 3.3% in Moses Lake — top-decile yield for the area; either an underpriced asset or a hidden risk that comps aren't pricing in. Stress-test before assuming the spread holds.
Location & tenants
- Location reads 75/100 on livability (#170 in WA, #4,228 nationally) — a middle-class / working-renter tenant base. Strengths: housing A+, health & safety A+, amenities A-; Watch: employment C-, crime F, commute F.
- Moses Lake School District (town): math 38% / reading 48% proficiency, ranked #198 of 291 in WA (top 68%) — families likely to look elsewhere, expect single-tenant / working-renter base with shorter leases.
- Zoned schools: Midway Elementary (238 students, 83% FRL); Frontier Middle School (758 students, 72% FRL); Moses Lake High School (1,984 students, 64% FRL) — zoned schools average 73% FRL vs 53% district-wide (20 pts higher); higher-poverty schools than district average — tighter screening recommended.
- Market conditions: Rents soft (-1.7%/yr); 590 active listings in the ZIP; 38 comparable units currently listed for rent nearby; rentals lingering (median 46d on market — plan ~5-8 weeks vacancy on turnover, expect pricing pressure); 100% of comp listings sitting > 30 days — soft ceiling on asking rent; 559 units permitted in Grant County in 2024 (35 in 5+ unit buildings).
Forward outlook
- Local home prices are declining (-3.0%/yr); year-one equity from $622 of loan paydown is wiped out by about $3k of value loss. Plan a longer hold.
- Grant County population projected at +16% by 2050 — long-run rental-demand tailwind backs the buy-and-hold thesis.
- At projected returns (-3.0% appreciation + 0.0% rent growth), your $25k cash investment doubles in ~4 years — after that, you're playing with house money.
Negotiation context
- Only 5 days on market — expect competitive offers; lowballing is unlikely to land.
Risks & watch-outs
- Watch-outs: built in 1946 — expect roof / HVAC / electrical / plumbing capex.
- Climate carrying-cost: major flood risk — expect insurance premiums to compound above CPI over the hold.
Questions for the listing agent
- Built in 1946 — when were the roof, HVAC, electrical panel, plumbing, and water heater last replaced?
- Is there a deadline driving the sale (1031 exchange, divorce, estate, relocation)? That informs how much negotiation room exists.
- Schools are D-rated, which usually means shorter tenancies and higher turnover. Who's the typical renter profile here, and what's been the actual vacancy rate?
- Crime grade is F in this area — have there been break-ins, vandalism, or insurance claims at this property in the last 3 years? What carrier currently insures it and at what premium?
- What's the average days-on-market for RENTAL listings here right now (not sales)? A rising rental-DOM trend means longer vacancies and softer asking-rent achievability than the comps imply.
- What's the recent tenant-quality profile in this submarket — average credit score on applications, eviction rate, late-payment / NSF rate, and stable-employment percentage? A property-management company in the area should have these aggregated.
- How much new for-sale + rental construction is in the pipeline within 1–3 miles? Heavy new supply typically softens prices + rents 12–24 months out; constrained supply supports both.
Investment metrics
- 1% rule
- 1.89% ✓
- Cap rate
- 16.02%
- Cash-on-cash
- 34.75%
- DSCR
- 2.55
- GRM
- 4.4
CMA / ARV
- ARV (on-the-fly)
- $294,690
- Comps found
- 12
Show comp detail 12 sales within ~0.75 mi
| Address | Dist | Beds/Ba | Sqft | Sold | Price | $/sf | Match |
|---|---|---|---|---|---|---|---|
| 1457 W Lee St | 0.08mi | 3/2.0 | 1,570 (+11%) | 3mo | $279,000 | $178 | 71 |
| 1826 W Lakeside | 0.42mi | 3/2.0 | 1,376 (-2%) | 2mo | $200,000 | $145 | 70 |
| 1440 W Sunset Dr | 0.15mi | 3/1.0 | 1,308 (-7%) | 14mo | $259,900 | $199 | 70 |
| 1300 W Marina Dr #33 | 0.37mi | 3/2.0 | 1,481 (+5%) | 7mo | $369,800 | $250 | 65 |
| 717 S Locust Ln | 0.32mi | 3/2.0 | 1,287 (-9%) | 2mo | $327,500 | $254 | 64 |
| 1300 Marina Dr #12 | 0.35mi | 3/2.0 | 1,480 (+5%) | 11mo | $386,000 | $261 | 63 |
| 1476 W Sunset Dr | 0.08mi | 3/2.0 | 1,231 (-13%) | 12mo | $271,000 | $220 | 62 |
| 711 S Marigold St | 0.36mi | 3/1.0 | 1,298 (-8%) | 12mo | $255,000 | $196 | 60 |
| 1808 W Crouse St | 0.24mi | 4/1.0 (+1) | 1,361 (-4%) | 22mo | $250,000 | $184 | 60 |
| 1300 W Marina Dr #32 | 0.37mi | 3/2.0 | 1,552 (+10%) | 14mo | $325,000 | $209 | 50 |
| 2125 W Neppel St | 0.58mi | 3/2.0 | 1,387 (-2%) | 21mo | $295,000 | $213 | 49 |
| 2207 W Basin St | 0.59mi | 2/1.0 (-1) | 1,304 (-8%) | 14mo | $181,180 | $139 | 43 |
Match score weights: distance 35% · size 25% · config 20% · recency 20%. Top-matched comps best support the ARV.
Projected returns pro-forma
-3.0% appreciation · 0.0% rent growth · sell at horizon
- IRR
- 26.8%
- Equity multiple
- 2.07×
- Total profit
- $26,930
- Equity at exit
- $13,419
- IRR
- 32.6%
- Equity multiple
- 3.54×
- Total profit
- $64,115
- Equity at exit
- $7,782
Cash invested: $25,200 (down + closing). Projections, not guarantees.
Landlord ↔ Tenant lean methodology
- Overall (STATE)
- 28 Tenant-Leaning
- State Washington
- 28 Tenant-Leaning · D+8
- County
- — inherits STATE
- City
- — inherits STATE
ZIP-level market 98837
- Rents YoY
- -1.7%
- Active inventory
- 590
- Price-to-rent
- 4.4×
Monthly cashflow live
- Estimated rent
- $1,701 high interval (Pro) →
- Mortgage (P&I)
- −$472
- Tax from tax record
- −$105 /mo · $1,259/yr
- Insurance
- −$38
- HOA
- −$0
- Vacancy / Maint / Mgmt
- −$357
- Net cashflow
- $730
Break-even live
Sensitivity live
| Price | -10% $781 | -5% $755 | +0% $730 | +5% $704 | +10% $679 |
|---|---|---|---|---|---|
| Rent | -10% $595 | -5% $663 | +0% $730 | +5% $797 | +10% $864 |
| Rate | -1.0pp $775 | -0.5pp $753 | base $730 | +0.5pp $706 | +1.0pp $683 |
UW: 25.0% down · 7.5% · 30yr · 1.5% tax · 5.0% vac · 8.0% maint · 8.0% mgmt
Financing live
Cash to close
- Down payment
- $22,500
- Closing costs
- $2,700
- Reserves months
- —
- Total cash needed
- —
Loan-product check · same deal, 3 products live
Conventional
25% down · 7.5% · 30yr
- Down + closing
- —
- Monthly P&I
- —
- Monthly cashflow
- —
- DSCR
- —
- Eligible?
- —
Personal DTI + credit; lowest rate.
DSCR
20% down · 8.5% · 30yr
- Down + closing
- —
- Monthly P&I
- —
- Monthly cashflow
- —
- DSCR
- —
- Eligible?
- —
No personal income docs; deal must DSCR.
Hard money
10% down · 12.0% · 12mo
- Down + closing
- —
- Monthly P&I
- —
- Monthly cashflow
- —
- DSCR
- —
- Eligible?
- —
Short-term bridge; refi at stabilization.
Rent comps 38 comps
| Address | Beds | Baths | Sqft | Rent | $/sqft | DOM | Units | Dist |
|---|---|---|---|---|---|---|---|---|
| 1709 W Fern Dr Apt C Moses Lake, WA | 2.0 | 1.5 | 1390 | $1,300 | $0.94 | 45d | 1 | 0.14mi |
| 1701 W Crouse St Moses Lake, WA | 1.0–3.0 | 1.0–2.0 | 1017 | $1,650 | $1.62 | 45d | 6 | 0.18mi |
| 1830 W Crouse St #1 Moses Lake, WA | 2.0 | 1.0 | 946 | $1,295 | $1.37 | 45d | 1 | 0.31mi |
| 1717 W Lakeside Dr Moses Lake, WA | 3.0 | 1.5 | 1554 | $3,000 | $1.93 | 45d | 1 | 0.40mi |
| 1211 W Ivy Ave Unit 203 Moses Lake, WA | 2.0 | 1.0 | 900 | $1,250 | $1.39 | 45d | 1 | 0.48mi |
| 1205 W Ivy Ave Unit 101 Moses Lake, WA | 2.0 | 1.0 | 900 | $1,150 | $1.28 | 45d | 1 | 0.48mi |
| 1206 W Columbia Ave Unit D Moses Lake, WA | 2.0 | 1.0 | 900 | $1,295 | $1.44 | 45d | 1 | 0.51mi |
| 1137 W Lakeside Dr Moses Lake, WA | 2.0 | 1.0 | 1286 | $1,495 | $1.16 | 45d | 1 | 0.71mi |
| 8328 Road 2.4 NE Moses Lake, WA | 3.0 | 2.0 | 1749 | $2,295 | $1.31 | 45d | 1 | 0.85mi |
| 310 N Crestview Dr Unit B Moses Lake, WA | 3.0 | 1.0 | 1573 | $1,875 | $1.19 | 45d | 1 | 0.85mi |
| 2625 W Marina Dr Unit 5 Moses Lake, WA | 3.0 | 2.5 | 1300 | $1,795 | $1.38 | 45d | 1 | 0.96mi |
| 2625 W Marina Dr Unit 4 Moses Lake, WA | 2.0 | 2.5 | 1300 | $1,500 | $1.15 | 45d | 1 | 0.96mi |
| 2625 W Marina Dr Unit 3 Moses Lake, WA | 2.0 | 2.5 | 1350 | $1,700 | $1.26 | 45d | 1 | 0.96mi |
| 2637 W Marina Dr Moses Lake, WA | 2.0 | 2.5 | 1340 | $1,600 | $1.19 | 45d | 1 | 0.97mi |
| 215 N Wellington St Moses Lake, WA | 3.0 | 2.0 | 1550 | $2,200 | $1.42 | 45d | 1 | 0.98mi |
| 2805 W Marina Dr Unit A3 Moses Lake, WA | 2.0 | 2.5 | 1350 | $1,450 | $1.07 | 45d | 1 | 1.09mi |
| 2812 W Marina Dr Unit D Moses Lake, WA | 2.0 | 2.0 | 1078 | $1,695 | $1.57 | 45d | 1 | 1.10mi |
| 924 S Division St Moses Lake, WA | 2.0 | 2.5 | 1162 | $1,675 | $1.44 | 45d | 1 | 1.12mi |
| 2821 W Marina Dr Unit 5 Moses Lake, WA | 3.0 | 2.5 | 1300 | $1,650 | $1.27 | 45d | 1 | 1.13mi |
| 2821 W Marina Dr Unit 1 Moses Lake, WA | 2.0 | 2.5 | 1200 | $1,550 | $1.29 | 45d | 1 | 1.13mi |
| 1330 S Skyline Dr Unit D Moses Lake, WA | 2.0 | 1.5 | 1400 | $1,450 | $1.04 | 45d | 1 | 1.15mi |
| 2829 W Marina Dr Unit 1 Moses Lake, WA | 3.0 | 2.5 | 1300 | $1,650 | $1.27 | 45d | 1 | 1.15mi |
| 2829 W Marina Dr Unit 6 Moses Lake, WA | 2.0 | 2.5 | 1200 | $1,550 | $1.29 | 45d | 1 | 1.15mi |
| 1330 S Skyline Dr Moses Lake, WA | 2.0 | 1.0 | 1400 | $1,450 | $1.04 | 45d | 1 | 1.15mi |
| 1326 S Skyline Dr Unit C Moses Lake, WA | 2.0 | 1.5 | 1400 | $1,450 | $1.04 | 45d | 1 | 1.15mi |
| 1326 S Skyline Dr Moses Lake, WA | 2.0 | 1.5 | 1400 | $1,395 | $1.00 | 45d | 1 | 1.15mi |
| 511 S Interlake Rd Moses Lake, WA | 2.0–4.0 | 2.0 | 1095 | $1,170 | $1.07 | 45d | 8 | 1.17mi |
| 2900 W Marina Dr Moses Lake, WA | 2.0 | 2.0 | 1036 | $1,688 | $1.63 | 45d | 1 | 1.21mi |
| 123 E 9th Ave #40 Moses Lake, WA | 3.0 | 2.0 | 1308 | $1,800 | $1.38 | 45d | 1 | 1.21mi |
| 123 9th Ave #39 Moses Lake, WA | 3.0 | 2.0 | 1308 | $2,400 | $1.83 | 45d | 1 | 1.25mi |
| 123 9th Ave #41 Moses Lake, WA | 3.0 | 2.0 | 1303 | $2,300 | $1.77 | 45d | 1 | 1.25mi |
| 422 N Washington St Moses Lake, WA | 3.0 | 2.0 | 1166 | $2,200 | $1.89 | 45d | 1 | 1.33mi |
| 3013 W Lakeside Dr Unit 5 Moses Lake, WA | 3.0 | 2.0 | 1700 | $2,400 | $1.41 | 45d | 1 | 1.35mi |
| 211 E 6th Ave Apt B Moses Lake, WA | 3.0 | 2.5 | 1332 | $1,775 | $1.33 | 45d | 1 | 1.39mi |
| 300 E 9th Ave Moses Lake, WA | 1.0–3.0 | 1.0–2.0 | 1003 | $1,699 | $1.69 | 45d | 19 | 1.43mi |
| 1340 Shaker Pl Unit E Moses Lake, WA | 2.0 | 1.5 | 1000 | $1,450 | $1.45 | 45d | 1 | 1.47mi |
| 1340 Shaker Pl Unit C Moses Lake, WA | 2.0 | 1.5 | 1000 | $1,395 | $1.40 | 45d | 1 | 1.47mi |
| 1525 S Monroe St #3 Moses Lake, WA | 3.0 | 2.5 | 1495 | $1,500 | $1.00 | 45d | 1 | 1.49mi |
Listing history 6 events
-
2026-06-22days on market $90,000 Active 5 DOM
-
2026-06-21days on market $90,000 Active 4 DOM
-
2026-06-19days on market $90,000 Active 2 DOM
-
2026-06-18remarks 199-char remark
-
2026-06-18remarks 166-char remark
-
2026-06-18$90,000 Active 1 DOM
ⓘ Source: listings_history table (triggers on properties + properties_extension) + one-shot
backfill from property_details.listing_events for pre-trigger history.
Tax reassessment forecast WA · Resets to sale price
- Current annual tax
- $1,259 · $105/mo
- Projected year-2 tax
- $1,259 · $105/mo
- Expected delta
- $0/yr ($0/mo · 0.0%)
ⓘ Screening estimate from a state-policy table — verify with the county assessor before closing.
Climate risk First Street
- Flood 6/10 Major FEMA zone X (unshaded) · 68% chance over 30 yrs
- Wildfire 1/10 Low
- Heat 4/10 Moderate 7 d/yr ≥96°F today · 16 d/yr by 30 yrs out
- Wind 1/10 Low
- Air quality 7/10 Severe 12 unhealthy d/yr today · 14 by 30 yrs out
Nearby sold comps map
Loading sold comps map…
Walkable amenities ~0.75 mi
Loading nearby amenities…
Taxation est. · year 1
- Rental income
- $20,417
- − Mortgage interest
- −$5,041
- − Property taxes
- −$1,259
- − Insurance
- −$450
- − Repairs & maintenance
- −$1,633
- − Management
- −$1,633
- − Depreciation
- −$2,618
- Taxable income
- $7,782
- Est. tax owed @ 24.0%
- −$1,868
- After-tax cash flow
- $6,889/yr
For passive investors: Depreciation is non-cash, so a rental often shows a tax loss while cash-flowing — sheltering income. Rental losses are passive: they offset passive income freely, and up to $25,000/yr can offset ordinary (W-2) income if you actively participate and your MAGI is under $100k (phasing out to $0 by $150k); unused losses carry forward. On sale, claimed depreciation is recaptured at up to 25%, and gains may owe capital-gains tax (a 1031 exchange can defer both). Figures are a year-1 estimate at your 24.0% rate — not tax advice; consult a CPA.
Schools (NCES district)
- District
- Moses Lake School District
- NCES district ID
- 5305220
- Math proficiency
- 38% ▬ 0.00%
- Reading proficiency
- 48% ▼ -1.00%
- Median HH income
- $49,033
- Composite
- 39.17/100
- National rank
- #8232
- State rank
- #198 of 291 in WA
Livability — Moses Lake
- Score
- 75/100
- State rank
- #170
- US rank
- #4228
Category grades
Schools grade is shown separately in the Schools card above.
Census & demographics
- Census place
- Moses Lake, WA
- County
- Grant County · 61,643 people
- City population
- 49,455
- Metro
- Moses Lake, WA
- Population (ZIP)
- 49,455
- Household income
- $74,586
- Rent vs Own
- Severe rent burden
- 1064.0
Population outlook (Grant County) Hauer SSP2
- Today (2025)
- 99,356 people
- By 2030
- 102,107 · +2.8%
- By 2040
- 108,318 · +9.0%
- By 2050
- 114,712 · +15.5%
- By 2075
- 131,376 · +32.2%
- By 2100
- 146,163 · +47.1%
Race, ethnicity, and origin ACS 2023
- Neighborhood character
- Diverse neighborhood (Simpson 0.55)
- Race & ethnicity
- White 58% Hispanic / Latino 33% Two or more races 15% Black 2% Asian 1%
- Hispanic origin (detail)
- Mexican 30%
- Common ancestry
- Portuguese 3% Subsaharan African 2% Lithuanian 2%
- Foreign-born
- 10% · Canada
- Languages at home
- 76% English-only · Spanish 21% Russian/Polish/Slavic 2%
Political lean MEDSL · Grant
- 2024 margin
- Solid R (+37.5) · D 30.0% · R 67.4% · Other 2.6%
- 2008→2024 swing
- -9.9pp toward R · 2008: -27.5pp · 2024: -37.5pp
- All cycles
- 2024: R+37.5 2020: R+34.4 2016: R+37.9 2012: R+32.6 2008: R+27.5
Not yet ingested
- Civics
- —
Market trends
- HPI YoY
- ▼ -384.29%
- Current HPI
- 208.4574
- Rent YoY
- ▼ -1.72%
- Metro
- Moses Lake, WA
- State GDP YoY
- ▲ 4.65%
- F500 in state
- 22
Industry mix (Fortune 500 HQ in WA)
| Industry | F500 HQs | Revenue |
|---|---|---|
| Retail | 2 | $269B |
|
||
| Technology / Retail | 1 | $638B |
|
||
| Technology | 1 | $245B |
|
||
| Telecommunications | 1 | $38B |
|
||
| Food / Beverage | 1 | $36B |
|
||
| Automotive / Trucks | 1 | $34B |
|
||
Price history
1 event — show timeline
- 2026-06-17 Listed $90,000 NWMLS as Distributed by MLS Grid
Property tax history
+11.7%/yrLatest (2026): $1,259 · +0.0% YoY. Source: county tax records.
Cash-flow waterfall
monthlySold comps — $/sqft
last 12 mo · ≤1 miLoading sold comps…