5005 State Highway 107 #12 · César Chávez, TX
Flood risk No data
- FEMA flood zone
- —
- Chance of flooding over 30 yrs
- —
- Est. flood insurance / yr
- —
Fire risk No data
- Est. fire insurance / yr
- —
Heat risk No data
- Hot days now (above threshold)
- —
- Hot days in 30 yrs
- —
Wind risk No data
- Chance of severe wind over 30 yrs
- —
Air-quality risk No data
- Unhealthy air days now
- —
- Unhealthy air days in 30 yrs
- —
Risk factors via First Street. Map © Google.
Why this score? — see what drove the B- grade
The composite is a weighted blend of 9 inputs, each scored 0–100. Each bar is that input's sub-score; the figure is the points it added to the 100-point composite (weight × sub-score).
- Cash flow +30.0/30.0
- 1% rule +10.0/10.0
- DSCR +10.0/10.0
- ARV discount +7.5/15.0
- Livability +2.5/5.0
- Rent growth +2.2/5.0
- Schools +2.2/10.0
- Condition / age +2.2/5.0
- Appreciation +0.0/10.0
$45,000
🖨 Deal sheet 📄 Offer letter ✓ Due diligence
Listing remarks
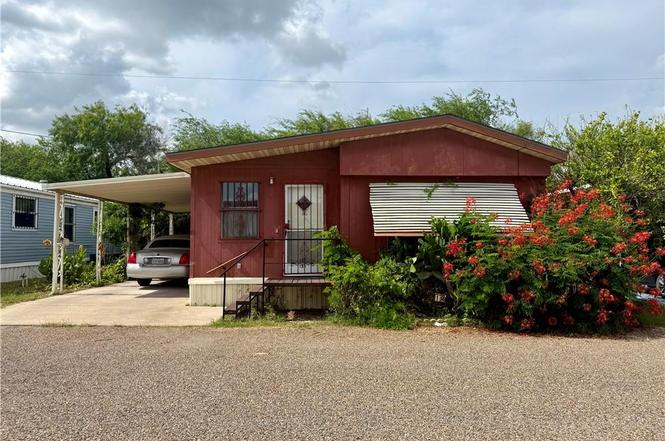
Lot 12! Spacious and well-maintained manufactured home located in an 18+ community. This move-in-ready home features an open layout, a generously sized living area, double-pane windows, iron security bars, and excellent insulation for year-round comfort. The kitchen comes equipped with a refrigerator, stove, and dishwasher. Being sold fully furnished and equipped! Furniture, appliances, televisions, dishes, cookware, kitchenware, washer, dryer, and many household items will convey with the sale, making this a truly turnkey opportunity. Just bring your suitcase and move right in. Enjoy outdoor living with mature shade trees, a patio area, and a 2-car carport. Park rent includes most utilitie
Key facts
- Excellent insulation
- Open layout
- Iron security bars
Tags
Property features AI
Finance
- Other: Located in Orange Grove RV Park, space 12 (manufactured home serial info recorded)
- HOA & community: No homeowner association; Community pool
Exterior
- Parking: Two total parking spaces; Two covered/carport spaces; Carport (no garage)
- Utilities: Public water; City sewer; Paved road access; Electric-powered systems
- Home design: Manufactured home in an RV/park community; 14 x 52 lot dimensions
- Construction: Siding exterior; Metal roof; Other foundation
- Exterior features: Covered, screened patio; Gutters/spouting; Mature trees; Corner lot
Interior
- Kitchen: Electric stove/range; Microwave; Refrigerator
- Flooring: Laminate; Tile
- Bathrooms: One full bathroom; One half bathroom
- Heating & cooling: Central heating (electric); Central air conditioning (electric)
- Interior features: Laminate and tile flooring; Laminate countertops; Built-in features; Ceiling fans; Mini blinds
- Laundry & utility: Washer and dryer present; Laundry closet; Washer/dryer connections; Electric water heater
Neighborhood map
What this means for you Summary
Snapshot
- This is a 3-bed/1.5-bath manufactured listed at $45k. Condition is rated fair.
Deal economics
- At list price, monthly cash flow is $918 ($11k/yr) — positive.
- The deal already cash-flows at list — no discount required.
- Meets the 1% rule at list price ($2k rent vs $45k).
Location & tenants
- Location reads: area grade B — affects rentability + tenant quality, not the cash-flow math above.
- Edinburg CISD (urban): math 20% / reading 34% proficiency, ranked #699 of 826 in TX (top 85%) — low school quality limits family demand, transient renter base, plan for 1-2y turnover; 62% free/reduced lunch — lower-income household profile, screen leases tightly.
- Zoned schools: Eisenhower El (math 16% / reading 26%, grade F, #3,492 of 4,322 statewide, top 81%, 611 students, 92% FRL); Memorial Middle (math 14% / reading 34%, grade F, #1,301 of 1,662 statewide, top 79%, 1,065 students, 91% FRL); Economedes H S (math 19% / reading 24%, grade F, #1,377 of 1,632 statewide, top 85%, 2,762 students, 92% FRL) — zoned schools average 92% FRL vs 62% district-wide (30 pts higher); higher-poverty schools than district average — tighter screening recommended.
- Market conditions: Rents soft (-1.1%/yr); 1003 active listings in the ZIP; 2 comparable units currently listed for rent nearby; 7,378 units permitted in Hidalgo County in 2024 (641 in 5+ unit buildings).
- This rent runs 34% of the median local income ($55k/yr) — at the standard rent-burdened threshold; future hikes will face affordability resistance.
Forward outlook
- Local home prices are declining (-3.0%/yr); year-one equity from $311 of loan paydown is wiped out by about $1k of value loss. Plan a longer hold.
- Hidalgo County population projected at +28% by 2050 — long-run rental-demand tailwind backs the buy-and-hold thesis.
- At projected returns (-3.0% appreciation + 0.0% rent growth), your $13k cash investment doubles in ~2 years — after that, you're playing with house money.
Negotiation context
- Only 3 days on market — expect competitive offers; lowballing is unlikely to land.
Questions for the listing agent
- Have any recent inspections been done? Can we get a copy of the seller's disclosures and any deferred-maintenance estimates?
- Is there a deadline driving the sale (1031 exchange, divorce, estate, relocation)? That informs how much negotiation room exists.
- What's the average days-on-market for RENTAL listings here right now (not sales)? A rising rental-DOM trend means longer vacancies and softer asking-rent achievability than the comps imply.
- What's the recent tenant-quality profile in this submarket — average credit score on applications, eviction rate, late-payment / NSF rate, and stable-employment percentage? A property-management company in the area should have these aggregated.
- How much new for-sale + rental construction is in the pipeline within 1–3 miles? Heavy new supply typically softens prices + rents 12–24 months out; constrained supply supports both.
Investment metrics
- 1% rule
- 3.46% ✓
- Cap rate
- 30.77%
- Cash-on-cash
- 87.43%
- DSCR
- 4.89
- GRM
- 2.4
CMA / ARV
No comps found within radius.
Projected returns pro-forma
-3.0% appreciation · 0.0% rent growth · sell at horizon
- IRR
- 84.6%
- Equity multiple
- 4.70×
- Total profit
- $46,640
- Equity at exit
- $6,710
- IRR
- 87.1%
- Equity multiple
- 8.81×
- Total profit
- $98,375
- Equity at exit
- $3,891
Cash invested: $12,600 (down + closing). Projections, not guarantees.
Landlord ↔ Tenant lean methodology
- Overall (STATE)
- 87 Strongly Landlord-Friendly
- State Texas
- 87 Strongly Landlord-Friendly · R+5
- County
- — inherits STATE
- City
- — inherits STATE
ZIP-level market 78542
- Home prices YoY
- -13.4%
- Rents YoY
- -1.1%
- Active inventory
- 1003
- Price-to-rent
- 2.4×
Monthly cashflow live
- Estimated rent
- $1,556 medium interval (Pro) →
- Mortgage (P&I)
- −$236
- Tax est. 1.5%
- −$56 /mo · $675/yr
- Insurance
- −$19
- HOA
- −$0
- Vacancy / Maint / Mgmt
- −$327
- Net cashflow
- $918
Break-even live
UW: 25.0% down · 7.5% · 30yr · 1.5% tax · 5.0% vac · 8.0% maint · 8.0% mgmt
Financing live
Cash to close
- Down payment
- $11,250
- Closing costs
- $1,350
- Reserves months
- —
- Total cash needed
- —
Loan-product check · same deal, 3 products live
Conventional
25% down · 7.5% · 30yr
- Down + closing
- —
- Monthly P&I
- —
- Monthly cashflow
- —
- DSCR
- —
- Eligible?
- —
Personal DTI + credit; lowest rate.
DSCR
20% down · 8.5% · 30yr
- Down + closing
- —
- Monthly P&I
- —
- Monthly cashflow
- —
- DSCR
- —
- Eligible?
- —
No personal income docs; deal must DSCR.
Hard money
10% down · 12.0% · 12mo
- Down + closing
- —
- Monthly P&I
- —
- Monthly cashflow
- —
- DSCR
- —
- Eligible?
- —
Short-term bridge; refi at stabilization.
Rent comps 2 comps
| Address | Beds | Baths | Sqft | Rent | $/sqft | DOM | Units | Dist |
|---|---|---|---|---|---|---|---|---|
| 3705 Sherman St Edinburg, TX | 3.0 | 2.0 | 1475 | $2,200 | $1.49 | 43d | 1 | 1.00mi |
| 302 S Doolittle Rd Edinburg, TX | 1.0–3.0 | 1.0–2.0 | 750 | $900 | $1.20 | 14d | 7 | 1.44mi |
Listing history 4 events
-
2026-06-18days on market $45,000 Active 3 DOM
-
2026-06-17days on market $45,000 Active 2 DOM
-
2026-06-16remarks 699-char remark
-
2026-06-16$45,000 Active 1 DOM
ⓘ Source: listings_history table (triggers on properties + properties_extension) + one-shot
backfill from property_details.listing_events for pre-trigger history.
Nearby sold comps map
Loading sold comps map…
Walkable amenities ~0.75 mi
Loading nearby amenities…
Taxation est. · year 1
- Rental income
- $18,668
- − Mortgage interest
- −$2,521
- − Property taxes
- −$675
- − Insurance
- −$225
- − Repairs & maintenance
- −$1,493
- − Management
- −$1,493
- − Depreciation
- −$1,309
- Taxable income
- $10,951
- Est. tax owed @ 24.0%
- −$2,628
- After-tax cash flow
- $8,388/yr
For passive investors: Depreciation is non-cash, so a rental often shows a tax loss while cash-flowing — sheltering income. Rental losses are passive: they offset passive income freely, and up to $25,000/yr can offset ordinary (W-2) income if you actively participate and your MAGI is under $100k (phasing out to $0 by $150k); unused losses carry forward. On sale, claimed depreciation is recaptured at up to 25%, and gains may owe capital-gains tax (a 1031 exchange can defer both). Figures are a year-1 estimate at your 24.0% rate — not tax advice; consult a CPA.
Condition & rehab AI · 12 photos
This manufactured home requires moderate repairs and maintenance to improve its condition and value. Repainting, repairing the exterior siding, and replacing the flooring would significantly enhance its appearance and marketability.
Repairs flagged
- Moderate exterior siding — visible wear
- Minor interior walls — some discoloration
- Minor flooring — some wear
Value-add opportunities
- Both paint interior walls — enhances appearance and value
- Both repair exterior siding — improves curb appeal and value
- Both replace flooring — enhances appearance and value
Renovation cost estimate screening
| Repair item | Severity | Est. cost |
|---|---|---|
| exterior siding · visible wear | Moderate | $3,000–15,000 |
| interior walls · some discoloration | Minor | $500–3,000 |
| flooring · some wear | Minor | $500–3,000 |
| Total estimated repair cost · 3 items | $4,000–21,000 |
Value-add ROI direction
- Both paint interior walls — enhances appearance and value ↑
- Both repair exterior siding — improves curb appeal and value ↑
- Both replace flooring — enhances appearance and value ↑
ⓘ Cost ranges are severity-bucket heuristics (US national rule-of-thumb). Get contractor quotes + a written scope before underwriting a rehab budget.
Schools (NCES district)
- District
- Edinburg CISD
- NCES district ID
- 4818180
- Math proficiency
- 20% ▼ -34.00%
- Reading proficiency
- 34% ▼ -11.00%
- Median HH income
- $36,985
- Composite
- 22.42/100
- National rank
- #8114
- State rank
- #699 of 826 in TX
Livability — César Chávez
No livability data for this city. (Only ~50 U.S. cities are tracked.)
Census & demographics
- Census place
- César Chávez, TX
- County
- Hidalgo County · 623,128 people
- City population
- 178,279
- Metro
- McAllen-Edinburg-Mission, TX
- Population (ZIP)
- 89,401
- Household income
- $55,243
- Rent vs Own
- Severe rent burden
- 1240.0
Population outlook (Hidalgo County) Hauer SSP2
- Today (2025)
- 955,232 people
- By 2030
- 1,009,774 · +5.7%
- By 2040
- 1,120,332 · +17.3%
- By 2050
- 1,225,036 · +28.2%
- By 2075
- 1,439,189 · +50.7%
- By 2100
- 1,533,429 · +60.5%
Race, ethnicity, and origin ACS 2023
- Neighborhood character
- Predominantly Hispanic (95%)
- Race & ethnicity
- Hispanic / Latino 95% Two or more races 59% White 4%
- Hispanic origin (detail)
- Mexican 91%
- Foreign-born
- 25% · Canada
- Languages at home
- 15% English-only · Spanish 84%
Political lean MEDSL · Hidalgo
- 2024 margin
- Toss-up / Even · D 48.1% · R 51.0%
- 2008→2024 swing
- -41.6pp toward R · 2008: 38.7pp · 2024: -2.9pp
- All cycles
- 2024: R+2.9 2020: D+17.1 2016: D+40.5 2012: D+41.8 2008: D+38.7
Not yet ingested
- Civics
- —
Market trends
- HPI YoY
- ▼ -34.17%
- Current HPI
- 220.921
- Rent YoY
- ▼ -1.07%
- Metro
- McAllen-Edinburg-Mission, TX
- State GDP YoY
- ▲ 3.95%
- F500 in state
- 110
Industry mix (Fortune 500 HQ in TX)
| Industry | F500 HQs | Revenue |
|---|---|---|
| Energy | 16 | $1,198B |
|
||
| Technology | 5 | $198B |
|
||
| Engineering / Construction | 4 | $72B |
|
||
| Energy Services | 3 | $60B |
|
||
| Utilities | 3 | $41B |
|
||
| Healthcare | 2 | $330B |
|
||
Price history
1 event — show timeline
- 2026-06-16 Listed $45,000 MCALLENMLS
Cash-flow waterfall
monthlySold comps — $/sqft
last 12 mo · ≤1 miLoading sold comps…