 Multi-family
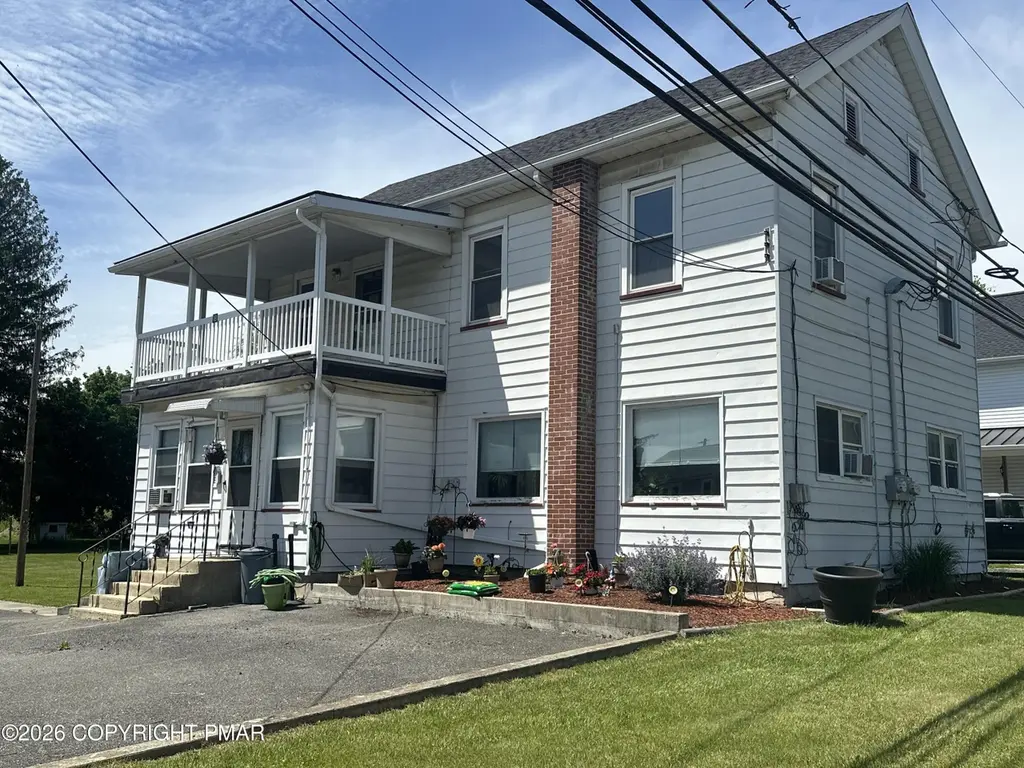
None · Effort, PA
Flood risk 1/10 · Minimal
- FEMA flood zone
- X (unshaded)
- Chance of flooding over 30 yrs
- 0.0%
- Est. flood insurance / yr
- $473 – $860
Fire risk 3/10 · Minor
- Est. fire insurance / yr
- $511 – $949
Heat risk 4/10 · Minor
- Hot days now (above 95°F)
- 7 days/yr
- Hot days in 30 yrs
- 16 days/yr
Wind risk 4/10 · Minor
- Chance of severe wind over 30 yrs
- 10.0%
Air-quality risk 2/10 · Minimal
- Unhealthy air days now
- 1 days/yr
- Unhealthy air days in 30 yrs
- 3 days/yr
Risk factors via First Street. Map © Google.
Why this score? — see what drove the B+ grade
The composite is a weighted blend of 9 inputs, each scored 0–100. Each bar is that input's sub-score; the figure is the points it added to the 100-point composite (weight × sub-score).
- Cash flow +29.1/30.0
- DSCR +10.0/10.0
- 1% rule +8.4/10.0
- Appreciation +8.1/10.0
- ARV discount +7.5/15.0
- Livability +3.9/5.0
- Schools +3.7/10.0
- Rent growth +2.5/5.0
- Condition / age +2.5/5.0
$259,900
🖨 Deal sheet (PDF) 📄 Offer letter ✓ Due diligence
Multi-family units
County records classify this as Multi-Family (2-4 Unit). Listing-text estimate: 1 unit. estimate disagrees with records
Listing remarks
Investor opportunity with owner-occupant potential ! Versatile two-family/commercial area offering endless possibilities. Each unit features 2 bedrooms and 1 full bath, providing comfortable living space for tenants or extended family or multi generational living. One apartment is currently rented, allowing you to live in the other while immediate rental income. The first floor apartment includes a heated porch, perfect for additional living space or a cozy sitting area. The second floor apartment features a spacious open porch to relax and enjoy the outdoors. Outside you'll find a huge parking lot, large backyard, storage shed and covered patio ideal for entertaining or extra storage needs
Key facts
- Heated porch
- Large backyard
- Storage shed
Tags
Property features AI
Finance
- Other: Zoning: R-3 (multi-family)
Exterior
- Parking: 2-car garage; Open parking (4 spaces); Parking lot
- Utilities: Well water; Public sewer
- Home design: Duplex; 2 stories
- Construction: Aluminum siding; Block foundation; Asphalt roof; Built as a duplex (residential use)
- Exterior features: Front enclosed porch; Paved public road frontage on a state road; Second residence on property
Interior
- Kitchen: Electric range; Refrigerator
- Bedrooms: 8 total rooms (includes bedrooms and living spaces)
- Flooring: Carpet; Ceramic tile; Laminate
- Bathrooms: 2 full bathrooms
- Heating & cooling: Electric heating; Ceiling fans
- Interior features: Unfurnished; Full concrete basement; Front enclosed porch; Storm door(s)
- Laundry & utility: Laundry in basement
Neighborhood map
What this means for you Summary
Snapshot
- This is a 4-bed/2.0-bath multifamily listed at $260k.
Deal economics
- At list price, monthly cash flow is $896 ($11k/yr) — positive.
- The deal already cash-flows at list — no discount required.
- Meets the 1% rule at list price ($3k rent vs $260k).
- Recommended offer: $256k (1.5% below list) — sets the bar for market timing.
- Cap rate 10.4% vs local median 2.7% in Effort — top-decile yield for the area; either an underpriced asset or a hidden risk that comps aren't pricing in. Stress-test before assuming the spread holds.
Location & tenants
- Location reads 78/100 on livability (#292 in PA, #2,576 nationally) — a middle-class / working-renter tenant base. Strengths: crime A+, employment A+, cost of living A+; Watch: amenities F, commute F.
- Pleasant Valley SD (rural): math 31% / reading 53% proficiency, ranked #297 of 539 in PA (top 55%) — families likely to look elsewhere, expect single-tenant / working-renter base with shorter leases.
- Zoned schools: Pleasant Valley El Sch (math 39% / reading 51%, grade D-, #809 of 1,518 statewide, top 54%, 899 students, 50% FRL); Pleasant Valley Ms (math 19% / reading 58%, grade F, #275 of 512 statewide, top 55%, 950 students, 50% FRL); Pleasant Valley Hs (math 72% / reading 30%, grade D+, #123 of 437 statewide, top 28%, 1,343 students, 39% FRL).
- Market conditions: 93 active listings in the ZIP; 3 comparable units currently listed for rent nearby; rentals lingering (median 46d on market — plan ~5-8 weeks vacancy on turnover, expect pricing pressure); 100% of comp listings sitting > 30 days — soft ceiling on asking rent; 278 units permitted in Monroe County in 2024 (52 in 5+ unit buildings).
Forward outlook
- In year one you build about $18k of equity ($2k loan paydown + $16k appreciation (6.2% local appreciation)).
- Monroe County population projected at -11% by 2050 — secular population decline; favor cash flow + early exit over multi-decade hold.
- At projected returns (6.2% appreciation + 3.0% rent growth), your $73k cash investment doubles in ~3 years — after that, you're playing with house money.
- By year 3, paydown + projected appreciation supports a ~$45k cash-out refi (75% LTV) — recoverable capital for the next deal without selling this one.
Negotiation context
- It's been on market 27 days — a 2% lower offer ($256k) is reasonable based on typical stale-listing flexibility.
- 2 sale attempts since 2y ago with the ask held roughly flat each time — persistent listings suggest the price (not the market) is what's stuck; bring a comps-based counter.
- Current owner paid $120k; list at $260k implies a 117% gain — meaningful room to come down on a strong offer.
Risks & watch-outs
- Watch-outs: built in 1950 — expect roof / HVAC / electrical / plumbing capex.
Questions for the listing agent
- Built in 1950 — when were the roof, HVAC, electrical panel, plumbing, and water heater last replaced?
- Is there a deadline driving the sale (1031 exchange, divorce, estate, relocation)? That informs how much negotiation room exists.
- Schools are D-rated, which usually means shorter tenancies and higher turnover. Who's the typical renter profile here, and what's been the actual vacancy rate?
- What's the average days-on-market for RENTAL listings here right now (not sales)? A rising rental-DOM trend means longer vacancies and softer asking-rent achievability than the comps imply.
- What's the recent tenant-quality profile in this submarket — average credit score on applications, eviction rate, late-payment / NSF rate, and stable-employment percentage? A property-management company in the area should have these aggregated.
- How much new apartment / multifamily construction is in the pipeline within 1–3 miles? Heavy new supply (>2% of stock underway) typically softens rents 12–24 months out; light construction supports rent growth.
Investment metrics
- 1% rule
- 1.34% ✓
- Cap rate
- 10.43%
- Cash-on-cash
- 14.78%
- DSCR
- 1.66
- GRM
- 6.2
CMA / ARV
No comps found within radius.
Projected returns pro-forma
6.25% appreciation · 3.0% rent growth · sell at horizon
- IRR
- 28.2%
- Equity multiple
- 2.87×
- Total profit
- $136,073
- Equity at exit
- $167,503
- IRR
- 26.2%
- Equity multiple
- 5.87×
- Total profit
- $354,749
- Equity at exit
- $307,378
Cash invested: $72,772 (down + closing). Projections, not guarantees.
Landlord ↔ Tenant lean methodology
- Overall (STATE)
- 62 Landlord-Friendly
- State Pennsylvania
- 62 Landlord-Friendly · EVEN
- County
- — inherits STATE
- City
- — inherits STATE
ZIP-level market 18058
- Home prices YoY
- 3.4%
- Active inventory
- 93
- Price-to-rent
- 12.5×
Monthly cashflow live
- Estimated rent
- $3,470 medium interval (Pro) →
- Mortgage (P&I)
- −$1,363
- Tax from tax record
- −$374 /mo · $4,486/yr
- Insurance
- −$108
- HOA
- −$0
- Vacancy / Maint / Mgmt
- −$729
- Net cashflow
- $896
Break-even live
Sensitivity live
| Price | -10% $1,043 | -5% $970 | +0% $896 | +5% $823 | +10% $749 |
|---|---|---|---|---|---|
| Rent | -10% $622 | -5% $759 | +0% $896 | +5% $1,033 | +10% $1,170 |
| Rate | -1.0pp $1,027 | -0.5pp $962 | base $896 | +0.5pp $829 | +1.0pp $760 |
2-unit breakdown (identical units grouped — click to expand)
| Units | Beds | Baths | Est. rent |
|---|---|---|---|
| 2× units | 2 | 1 | $3,470 |
| #1 | 2 | 1 | $1,735 |
| #2 | 2 | 1 | $1,735 |
| Total (2 units) | $3,470 | ||
UW: 25.0% down · 7.5% · 30yr · 1.5% tax · 5.0% vac · 8.0% maint · 8.0% mgmt
Financing live
Cash to close
- Down payment
- $64,975
- Closing costs
- $7,797
- Reserves months
- —
- Total cash needed
- —
Loan-product check · same deal, 3 products live
Conventional
25% down · 7.5% · 30yr
- Down + closing
- —
- Monthly P&I
- —
- Monthly cashflow
- —
- DSCR
- —
- Eligible?
- —
Personal DTI + credit; lowest rate.
DSCR
20% down · 8.5% · 30yr
- Down + closing
- —
- Monthly P&I
- —
- Monthly cashflow
- —
- DSCR
- —
- Eligible?
- —
No personal income docs; deal must DSCR.
Hard money
10% down · 12.0% · 12mo
- Down + closing
- —
- Monthly P&I
- —
- Monthly cashflow
- —
- DSCR
- —
- Eligible?
- —
Short-term bridge; refi at stabilization.
Rent comps 3 comps
| Address | Beds | Baths | Sqft | Rent | $/sqft | DOM | Units | Dist |
|---|---|---|---|---|---|---|---|---|
| 580 Interchange Rd Kresgeville, PA | 3.0 | 1.5 | 1360 | $1,800 | $1.32 | 45d | 1 | 0.09mi |
| 199 Victoria Arms Cir Kunkletown, PA | 3.0 | 1.5 | 1330 | $1,895 | $1.42 | 45d | 1 | 0.94mi |
| 808 Interchange Rd Kresgeville, PA | 3.0 | 2.0 | 1526 | $1,995 | $1.31 | 45d | 1 | 1.19mi |
Listing history 23 events
-
2026-06-22days on market $259,900 Active 27 DOM
-
2026-06-19days on market $259,900 Active 24 DOM
-
2026-06-18days on market $259,900 Active 23 DOM
-
2026-06-17days on market $259,900 Active 22 DOM
-
2026-06-16days on market $259,900 Active 21 DOM
-
2026-06-15days on market $259,900 Active 20 DOM
-
2026-06-14days on market $259,900 Active 18 DOM
-
2026-06-13days on market $259,900 Active 17 DOM
-
2026-06-10days on market $259,900 Active 15 DOM
-
2026-06-09days on market $259,900 Active 14 DOM
-
2026-06-08days on market $259,900 Active 13 DOM
-
2026-06-07days on market $259,900 Active 12 DOM
-
2026-06-05days on market $259,900 Active 9 DOM
-
2026-06-03days on market $259,900 Active 8 DOM
-
2026-06-02days on market $259,900 Active 7 DOM
-
2026-06-01days on market $259,900 Active 6 DOM
-
2026-05-31days on market $259,900 Active 5 DOM
-
2026-05-30days on market $259,900 Active 4 DOM
-
2026-05-20$259,900 Active
-
2024-10-03$259,900 Active
-
2012-07-10soldstatus $120,000
-
1998-11-30soldstatus $110,000
-
1988-11-30soldstatus $45,000
ⓘ Source: listings_history table (triggers on properties + properties_extension) + one-shot
backfill from property_details.listing_events for pre-trigger history.
Tax reassessment forecast PA · Partial reset (capped growth)
- Current annual tax
- $4,486 · $374/mo
- Projected year-2 tax
- $4,486 · $374/mo
- Expected delta
- $0/yr ($0/mo · 0.0%)
ⓘ Screening estimate from a state-policy table — verify with the county assessor before closing.
Climate risk First Street
- Flood 1/10 Low FEMA zone X (unshaded) · 0% chance over 30 yrs
- Wildfire 3/10 Moderate
- Heat 4/10 Moderate 7 d/yr ≥95°F today · 16 d/yr by 30 yrs out
- Wind 4/10 Moderate 10% chance of damaging wind over 30 yrs
- Air quality 2/10 Low 1 unhealthy d/yr today · 3 by 30 yrs out
Nearby sold comps map
Loading sold comps map…
Walkable amenities ~0.75 mi
Loading nearby amenities…
Taxation est. · year 1
- Rental income
- $41,640
- − Mortgage interest
- −$14,558
- − Property taxes
- −$4,486
- − Insurance
- −$1,300
- − Repairs & maintenance
- −$3,331
- − Management
- −$3,331
- − Depreciation
- −$7,561
- Taxable income
- $7,073
- Est. tax owed @ 24.0%
- −$1,697
- After-tax cash flow
- $9,057/yr
For passive investors: Depreciation is non-cash, so a rental often shows a tax loss while cash-flowing — sheltering income. Rental losses are passive: they offset passive income freely, and up to $25,000/yr can offset ordinary (W-2) income if you actively participate and your MAGI is under $100k (phasing out to $0 by $150k); unused losses carry forward. On sale, claimed depreciation is recaptured at up to 25%, and gains may owe capital-gains tax (a 1031 exchange can defer both). Figures are a year-1 estimate at your 24.0% rate — not tax advice; consult a CPA.
Schools (NCES district)
- District
- Pleasant Valley SD
- NCES district ID
- 4219290
- Math proficiency
- 31% ▼ -19.00%
- Reading proficiency
- 53% ▼ -15.00%
- Median HH income
- $61,593
- Composite
- 37.18/100
- National rank
- #4476
- State rank
- #297 of 539 in PA
Livability — Effort
- Score
- 78/100
- State rank
- #292
- US rank
- #2576
Category grades
Schools grade is shown separately in the Schools card above.
Census & demographics
- Population (ZIP)
- 9,884
Population outlook (Monroe County) Hauer SSP2
- Today (2025)
- 164,099 people
- By 2030
- 161,412 · -1.6%
- By 2040
- 154,616 · -5.8%
- By 2050
- 146,710 · -10.6%
- By 2075
- 140,830 · -14.2%
- By 2100
- 138,472 · -15.6%
Race, ethnicity, and origin ACS 2023
- Neighborhood character
- Predominantly White (81%)
- Race & ethnicity
- White 81% Hispanic / Latino 11% Two or more races 10% Black 2%
- Hispanic origin (detail)
- Mexican 6% Puerto Rican 2%
- Common ancestry
- Romanian 6% Polish 4% Iranian 4%
- Foreign-born
- 6% · Canada
- Languages at home
- 90% English-only · Spanish 5% Other Indo-European 2% Russian/Polish/Slavic 1%
Political lean MEDSL · Monroe
- 2024 margin
- Toss-up / Even · D 49.1% · R 49.9%
- 2008→2024 swing
- -17.1pp toward R · 2008: 16.3pp · 2024: -0.8pp
- All cycles
- 2024: R+0.8 2020: D+6.4 2016: D+0.3 2012: D+14.0 2008: D+16.3
Not yet ingested
- Civics
- —
Market trends
- HPI YoY
- ▲ 6.25%
- Current HPI
- 188.6013
- Rent YoY
- —
- Metro
- —
- State GDP YoY
- ▲ 1.68%
- F500 in state
- 34
Industry mix (Fortune 500 HQ in PA)
| Industry | F500 HQs | Revenue |
|---|---|---|
| Healthcare | 2 | $309B |
|
||
| Insurance | 2 | $27B |
|
||
| Telecommunications / Media | 1 | $124B |
|
||
| Industrial Distribution | 1 | $22B |
|
||
| Financial Services | 1 | $20B |
|
||
| Chemicals / Materials | 1 | $18B |
|
||
Price history
+477.6% since first listed5 events — show timeline
- 2026-05-20 Listed $259,900 PMAR
- 2024-10-03 Listed $259,900 PMAR
- 2012-07-10 Sold (Public Records) $120,000 Public Records
- 1998-11-30 Sold (Public Records) $110,000 Public Records
- 1988-11-30 Sold (Public Records) $45,000 Public Records
Property tax history
+0.7%/yrLatest (2026): $4,486 · +1.6% YoY. Source: county tax records.
Cash-flow waterfall
monthlySold comps — $/sqft
last 12 mo · ≤1 miLoading sold comps…