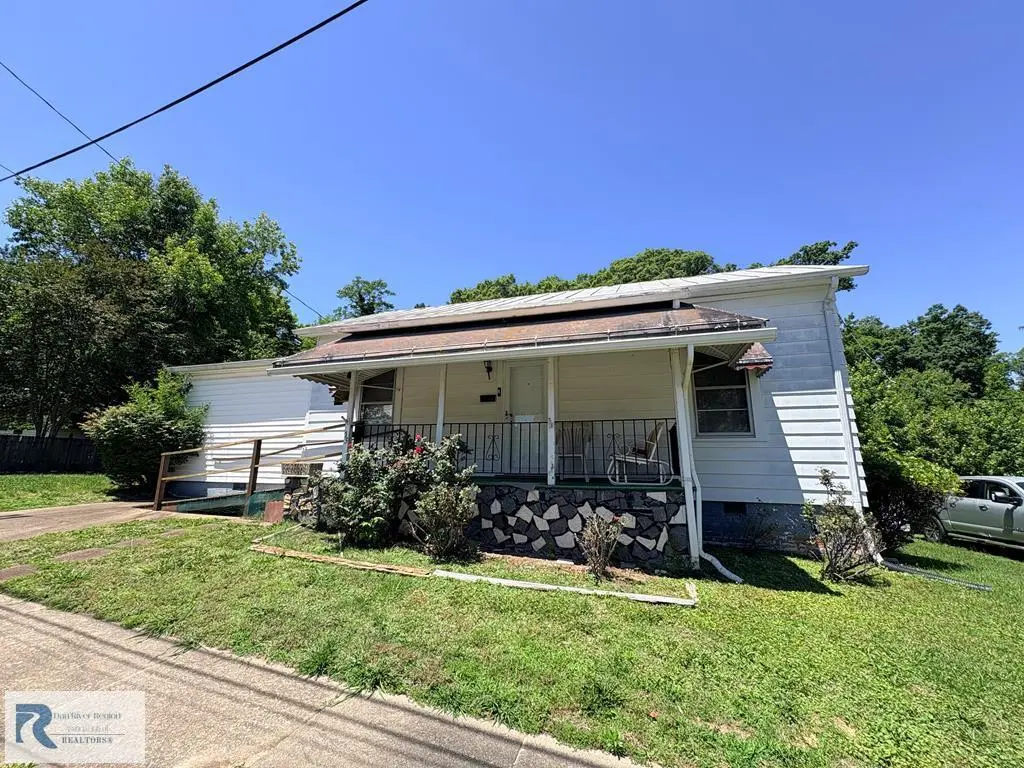
13 Oak Ridge Ave · Danville, VA
Flood risk 1/10 · Minimal
- FEMA flood zone
- X (unshaded)
- Chance of flooding over 30 yrs
- 0.0%
- Est. flood insurance / yr
- $507 – $1,088
Fire risk 1/10 · Minimal
- Est. fire insurance / yr
- $666 – $1,236
Heat risk 6/10 · Moderate
- Hot days now (above 104°F)
- 7 days/yr
- Hot days in 30 yrs
- 18 days/yr
Wind risk 4/10 · Minor
- Chance of severe wind over 30 yrs
- 8.0%
Air-quality risk 2/10 · Minimal
- Unhealthy air days now
- 0 days/yr
- Unhealthy air days in 30 yrs
- 1 days/yr
Risk factors via First Street. Map © Google.
Why this score? — see what drove the C- grade
The composite is a weighted blend of 9 inputs, each scored 0–100. Each bar is that input's sub-score; the figure is the points it added to the 100-point composite (weight × sub-score).
- Cash flow +25.8/30.0
- DSCR +8.6/10.0
- 1% rule +5.5/10.0
- Livability +3.9/5.0
- Schools +3.0/10.0
- Rent growth +2.5/5.0
- Condition / age +2.5/5.0
- ARV discount +0.3/15.0
- Appreciation +0.0/10.0
$129,900
🖨 Deal sheet 📄 Offer letter ✓ Due diligence
Listing remarks
Warm, inviting & full of potential, this 2-bedroom home offers flexible living with the opportunity to easily create a 3rd bedroom. The layout includes two living rooms, a fireplace, one full bath & a screened porch overlooking the backyard. Enjoy driveway parking, a one-car garage & two storage buildings for added convenience. Located within walking distance to Caesars Casino, this property offers great space, functionality & room to make it your own. Interior photos will be added soon!
Key facts
- One car garage
- Screened porch
- Two living rooms
Tags
Property features AI
Exterior
- Utilities: Public water; Public sewer
- Home design: Residential property
- Construction: Metal roof; Vinyl siding; Above-grade finished area reported
- Exterior features: Front porch; Level lot; Outbuilding
Interior
- Kitchen: Electric range
- Bedrooms: 3 main-level bedrooms
- Flooring: Vinyl flooring; Carpet flooring
- Bathrooms: 1 full bathroom (1 on the main level)
- Heating & cooling: Natural gas heating
- Interior features: Storm windows; Living room fireplace; Crawl space basement; 6 total rooms
Neighborhood map
What this means for you Summary
Snapshot
- This is a 2-bed/1.0-bath single-family listed at $130k.
Deal economics
- At list price, monthly cash flow is $314 ($4k/yr) — positive.
- The deal already cash-flows at list — no discount required.
- Meets the 1% rule at list price ($1k rent vs $130k).
- Recommended offer: $128k (1.5% below list) — sets the bar for market timing.
- Cap rate 9.2% vs local median 5.3% in Danville — top-decile yield for the area; either an underpriced asset or a hidden risk that comps aren't pricing in. Stress-test before assuming the spread holds.
Location & tenants
- Location reads 77/100 on livability (#91 in VA, #2,952 nationally) — a middle-class / working-renter tenant base. Strengths: cost of living A+, housing A+, health & safety A+; Watch: amenities D+, crime D-, commute F.
- Danville City Public School District (town): math 30% / reading 44% proficiency, ranked #128 of 131 in VA (top 98%) — families likely to look elsewhere, expect single-tenant / working-renter base with shorter leases; 71% free/reduced lunch — lower-income household profile, screen leases tightly.
- Zoned schools: Schoolfield Elementary (math 22% / reading 40%, grade F, #1,004 of 1,108 statewide, top 91%, 500 students, 98% FRL); O. Trent Bonner Middle (math 33% / reading 53%, grade D-, #288 of 342 statewide, top 85%, 678 students, 91% FRL) — zoned schools average 94% FRL vs 71% district-wide (23 pts higher); higher-poverty schools than district average — tighter screening recommended.
- Market conditions: 245 active listings in the ZIP; 8 comparable units currently listed for rent nearby; rentals lingering (median 44d on market — plan ~5-8 weeks vacancy on turnover, expect pricing pressure); 75% of comp listings sitting > 30 days — soft ceiling on asking rent; 54 units permitted in Danville city in 2024 (40 in 5+ unit buildings).
- This rent runs 32% of the median local income ($51k/yr) — at the standard rent-burdened threshold; future hikes will face affordability resistance.
Forward outlook
- Local home prices are declining (-3.0%/yr); year-one equity from $898 of loan paydown is wiped out by about $4k of value loss. Plan a longer hold.
- Danville County population projected to shrink 7% by 2050 — rents likely to lag national; underwrite the cash flow, not the appreciation.
Negotiation context
- It's been on market 15 days — a 2% lower offer ($128k) is reasonable based on typical stale-listing flexibility.
Risks & watch-outs
- Watch-outs: built in 1950 — expect roof / HVAC / electrical / plumbing capex.
- Climate carrying-cost: extreme-heat days projected 7→18/yr by 2055 (HVAC capex compounding) — expect insurance premiums to compound above CPI over the hold.
Questions for the listing agent
- Built in 1950 — when were the roof, HVAC, electrical panel, plumbing, and water heater last replaced?
- Is there a deadline driving the sale (1031 exchange, divorce, estate, relocation)? That informs how much negotiation room exists.
- Schools are B-rated — typically a magnet for longer-tenancy family renters. What's the average tenant stay here, and is there a school-zone premium baked into asking?
- Crime grade is D in this area — have there been break-ins, vandalism, or insurance claims at this property in the last 3 years? What carrier currently insures it and at what premium?
- What's the average days-on-market for RENTAL listings here right now (not sales)? A rising rental-DOM trend means longer vacancies and softer asking-rent achievability than the comps imply.
- What's the recent tenant-quality profile in this submarket — average credit score on applications, eviction rate, late-payment / NSF rate, and stable-employment percentage? A property-management company in the area should have these aggregated.
- How much new for-sale + rental construction is in the pipeline within 1–3 miles? Heavy new supply typically softens prices + rents 12–24 months out; constrained supply supports both.
Investment metrics
- 1% rule
- 1.05% ✓
- Cap rate
- 9.20%
- Cash-on-cash
- 10.37%
- DSCR
- 1.46
- GRM
- 8.0
CMA / ARV
- ARV (on-the-fly)
- $112,050
- Comps found
- 8
Show comp detail 8 sales within ~0.75 mi
| Address | Dist | Beds/Ba | Sqft | Sold | Price | $/sf | Match |
|---|---|---|---|---|---|---|---|
| 87 Bishop Ave | 0.09mi | 3/2.0 (+1) | 1,269 (-6%) | 13mo | $47,500 | $37 | 66 |
| 57 Glen Oak Dr | 0.54mi | 2/1.0 | 1,248 (-8%) | 10mo | $80,000 | $64 | 54 |
| 73 Fairfield Ave | 0.65mi | 3/1.0 (+1) | 1,368 (+1%) | 12mo | $115,000 | $84 | 52 |
| 268 Park Cir | 0.44mi | 2/1.5 | 1,216 (-10%) | 11mo | $144,500 | $119 | 52 |
| 89 Schoolfield Dr | 0.66mi | 3/1.0 (+1) | 1,207 (-11%) | 1mo | $90,000 | $75 | 46 |
| 29 Schoolfield Dr | 0.46mi | 2/1.5 | 1,152 (-15%) | 23mo | $155,000 | $135 | 33 |
| 45 Laurel Ave | 0.66mi | 3/1.0 (+1) | 1,548 (+15%) | 14mo | $99,500 | $64 | 28 |
| 45 Baltimore Ave | 0.61mi | 3/1.0 (+1) | 1,150 (-15%) | 18mo | $95,000 | $83 | 26 |
Match score weights: distance 35% · size 25% · config 20% · recency 20%. Top-matched comps best support the ARV.
Projected returns pro-forma
-3.0% appreciation · 3.0% rent growth · sell at horizon
- IRR
- -0.8%
- Equity multiple
- 0.97×
- Total profit
- $-1,102
- Equity at exit
- $19,369
- IRR
- 8.8%
- Equity multiple
- 1.67×
- Total profit
- $24,549
- Equity at exit
- $11,231
Cash invested: $36,372 (down + closing). Projections, not guarantees.
Landlord ↔ Tenant lean methodology
- Overall (STATE)
- 55 Moderately Landlord-Leaning
- State Virginia
- 55 Moderately Landlord-Leaning · D+2
- County
- — inherits STATE
- City
- — inherits STATE
ZIP-level market 24541
- Home prices YoY
- -17.1%
- Active inventory
- 245
- Price-to-rent
- 8.0×
Monthly cashflow live
- Estimated rent
- $1,360 high interval (Pro) →
- Mortgage (P&I)
- −$681
- Tax from tax record
- −$25 /mo · $295/yr
- Insurance
- −$54
- HOA
- −$0
- Vacancy / Maint / Mgmt
- −$286
- Net cashflow
- $314
Break-even live
UW: 25.0% down · 7.5% · 30yr · 1.5% tax · 5.0% vac · 8.0% maint · 8.0% mgmt
Financing live
Cash to close
- Down payment
- $32,475
- Closing costs
- $3,897
- Reserves months
- —
- Total cash needed
- —
Loan-product check · same deal, 3 products live
Conventional
25% down · 7.5% · 30yr
- Down + closing
- —
- Monthly P&I
- —
- Monthly cashflow
- —
- DSCR
- —
- Eligible?
- —
Personal DTI + credit; lowest rate.
DSCR
20% down · 8.5% · 30yr
- Down + closing
- —
- Monthly P&I
- —
- Monthly cashflow
- —
- DSCR
- —
- Eligible?
- —
No personal income docs; deal must DSCR.
Hard money
10% down · 12.0% · 12mo
- Down + closing
- —
- Monthly P&I
- —
- Monthly cashflow
- —
- DSCR
- —
- Eligible?
- —
Short-term bridge; refi at stabilization.
Rent comps 8 comps
| Address | Beds | Baths | Sqft | Rent | $/sqft | DOM | Units | Dist |
|---|---|---|---|---|---|---|---|---|
| 66 Carlson Ave Danville, VA | 2.0 | 1.0 | 966 | $1,000 | $1.04 | 44d | 1 | 0.60mi |
| 107 Baltimore Ave Danville, VA | 2.0 | 1.0 | 902 | $914 | $1.01 | 21d | 1 | 0.77mi |
| 732 Hughes St Danville, VA | 2.0 | 1.0 | 900 | $1,800 | $2.00 | 44d | 1 | 0.86mi |
| 671 Park Ave Danville, VA | 2.0 | 1.0 | 942 | $1,100 | $1.17 | 44d | 1 | 0.88mi |
| 721 Chatham Ave Unit A Danville, VA | 3.0 | 1.0 | 950 | $1,350 | $1.42 | 13d | 1 | 0.95mi |
| 119 Martin Ave Danville, VA | 3.0 | 1.5 | 1100 | $1,700 | $1.55 | 44d | 1 | 1.05mi |
| 528 River Oak Dr Danville, VA | 3.0 | 2.0 | 1830 | $2,700 | $1.48 | 44d | 1 | 1.28mi |
| 181 Banner St Danville, VA | 3.0 | 1.0 | 1176 | $1,389 | $1.18 | 44d | 1 | 1.31mi |
Listing history 13 events
-
2026-06-19days on market $129,900 Active 15 DOM
-
2026-06-18days on market $129,900 Active 14 DOM
-
2026-06-17days on market $129,900 Active 13 DOM
-
2026-06-16days on market $129,900 Active 12 DOM
-
2026-06-15days on market $129,900 Active 11 DOM
-
2026-06-14days on market $129,900 Active 9 DOM
-
2026-06-13days on market $129,900 Active 8 DOM
-
2026-06-10days on market $129,900 Active 6 DOM
-
2026-06-09days on market $129,900 Active 5 DOM
-
2026-06-08days on market $129,900 Active 4 DOM
-
2026-06-07days on market $129,900 Active 3 DOM
-
2026-06-05remarks 500-char remark
-
2026-06-05$129,900 Active 1 DOM
ⓘ Source: listings_history table (triggers on properties + properties_extension) + one-shot
backfill from property_details.listing_events for pre-trigger history.
Tax reassessment forecast VA · Resets to sale price
- Current annual tax
- $295 · $25/mo
- Projected year-2 tax
- $1,065 · $89/mo
- Expected delta
- +$770/yr (+$64/mo · 260.5%)
ⓘ Screening estimate from a state-policy table — verify with the county assessor before closing.
Climate risk First Street
- Flood 1/10 Low FEMA zone X (unshaded) · 0% chance over 30 yrs
- Wildfire 1/10 Low
- Heat 6/10 Major 7 d/yr ≥104°F today · 18 d/yr by 30 yrs out
- Wind 4/10 Moderate 8% chance of damaging wind over 30 yrs
- Air quality 2/10 Low 0 unhealthy d/yr today · 1 by 30 yrs out
Nearby sold comps map
Loading sold comps map…
Walkable amenities ~0.75 mi
Loading nearby amenities…
Taxation est. · year 1
- Rental income
- $16,316
- − Mortgage interest
- −$7,276
- − Property taxes
- −$295
- − Insurance
- −$650
- − Repairs & maintenance
- −$1,305
- − Management
- −$1,305
- − Depreciation
- −$3,779
- Taxable income
- $1,705
- Est. tax owed @ 24.0%
- −$409
- After-tax cash flow
- $3,361/yr
For passive investors: Depreciation is non-cash, so a rental often shows a tax loss while cash-flowing — sheltering income. Rental losses are passive: they offset passive income freely, and up to $25,000/yr can offset ordinary (W-2) income if you actively participate and your MAGI is under $100k (phasing out to $0 by $150k); unused losses carry forward. On sale, claimed depreciation is recaptured at up to 25%, and gains may owe capital-gains tax (a 1031 exchange can defer both). Figures are a year-1 estimate at your 24.0% rate — not tax advice; consult a CPA.
Schools (NCES district)
- District
- Danville City Public School District
- NCES district ID
- 5101110
- Math proficiency
- 30% ▼ -22.00%
- Reading proficiency
- 44% ▼ -8.00%
- Median HH income
- $31,952
- Composite
- 30.23/100
- National rank
- #6298
- State rank
- #128 of 131 in VA
Livability — Danville
- Score
- 77/100
- State rank
- #91
- US rank
- #2952
Category grades
Schools grade is shown separately in the Schools card above.
Census & demographics
- Census place
- Danville, VA
- County
- Danville City · 59,055 people
- City population
- 59,055
- Metro
- Danville, VA
- Population (ZIP)
- 28,042
- Household income
- $51,427
- Rent vs Own
- Severe rent burden
- 1399.0
Population outlook (Danville County) Hauer SSP2
- Today (2025)
- 40,989 people
- By 2030
- 40,432 · -1.4%
- By 2040
- 39,255 · -4.2%
- By 2050
- 38,035 · -7.2%
- By 2075
- 35,612 · -13.1%
- By 2100
- 30,365 · -25.9%
Race, ethnicity, and origin ACS 2023
- Neighborhood character
- Diverse neighborhood (Simpson 0.59)
- Race & ethnicity
- White 50% Black 39% Two or more races 7% Hispanic / Latino 5% Asian 2%
- Common ancestry
- Slovak 2% Serbian 2% Lithuanian 1%
- Foreign-born
- 4% · Canada, Dominican Republic
- Languages at home
- 95% English-only · Spanish 4% Other Indo-European 1%
Political lean MEDSL · Danville
- 2024 margin
- Strong D (+21.1) · D 60.1% · R 39.0%
- 2008→2024 swing
- +1.9pp toward D · 2008: 19.1pp · 2024: 21.1pp
- All cycles
- 2024: D+21.1 2020: D+22.1 2016: D+19.9 2012: D+22.1 2008: D+19.1
Not yet ingested
- Civics
- —
Market trends
- HPI YoY
- ▼ -49.28%
- Current HPI
- 238.5992
- Rent YoY
- —
- Metro
- Danville, VA
- State GDP YoY
- ▲ 2.40%
- F500 in state
- 50
Industry mix (Fortune 500 HQ in VA)
| Industry | F500 HQs | Revenue |
|---|---|---|
| Aerospace / Defense | 4 | $236B |
|
||
| Technology / Defense | 3 | $32B |
|
||
| Financial Services | 2 | $176B |
|
||
| Utilities | 2 | $27B |
|
||
| Insurance | 2 | $25B |
|
||
| Technology | 2 | $15B |
|
||
Price history
+8.2% since first listed2 events — show timeline
- 2026-06-04 Listed $129,900 DRRAR
- 2025-04-08 Sold (Public Records) $120,000 Public Records
Property tax history
+2.3%/yrLatest (2025): $295 · +0.0% YoY. Source: county tax records.
Cash-flow waterfall
monthlySold comps — $/sqft
last 12 mo · ≤1 miLoading sold comps…