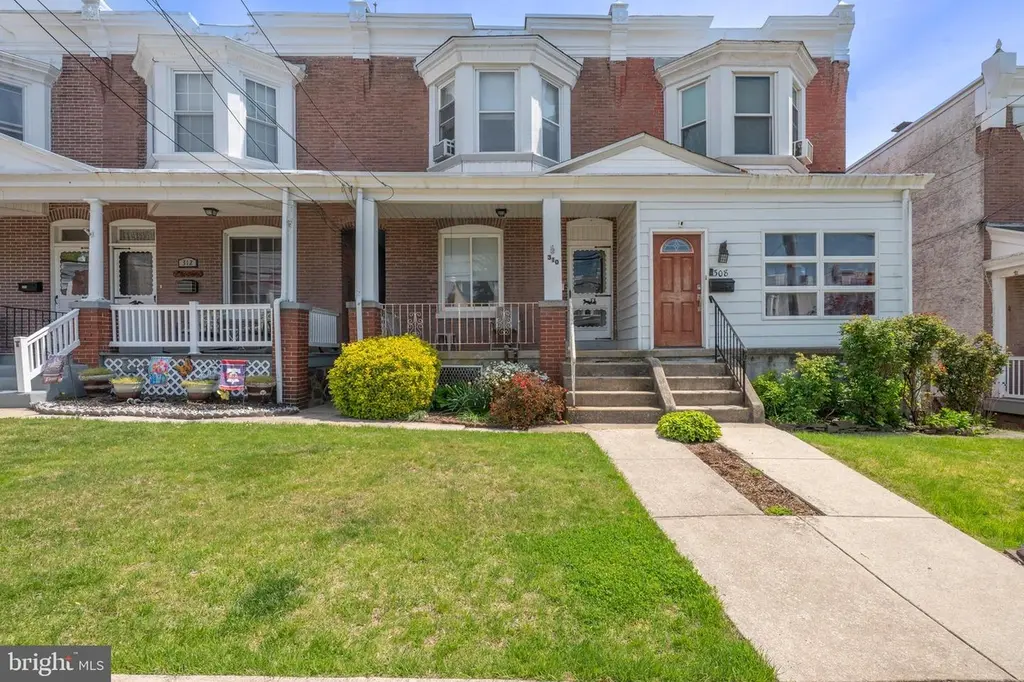
310 Spring St · Royersford, PA
Flood risk 1/10 · Minimal
- FEMA flood zone
- X (unshaded)
- Chance of flooding over 30 yrs
- 0.0%
- Est. flood insurance / yr
- $473 – $860
Fire risk 1/10 · Minimal
- Est. fire insurance / yr
- $511 – $949
Heat risk 6/10 · Moderate
- Hot days now (above 101°F)
- 7 days/yr
- Hot days in 30 yrs
- 15 days/yr
Wind risk 5/10 · Moderate
- Chance of severe wind over 30 yrs
- 23.0%
Air-quality risk 4/10 · Minor
- Unhealthy air days now
- 3 days/yr
- Unhealthy air days in 30 yrs
- 6 days/yr
Risk factors via First Street. Map © Google.
Why this score? — see what drove the B- grade
The composite is a weighted blend of 9 inputs, each scored 0–100. Each bar is that input's sub-score; the figure is the points it added to the 100-point composite (weight × sub-score).
- Cash flow +22.5/30.0
- ARV discount +15.0/15.0
- DSCR +7.2/10.0
- 1% rule +6.2/10.0
- Schools +6.1/10.0
- Livability +4.1/5.0
- Condition / age +2.5/5.0
- Rent growth +2.2/5.0
- Appreciation +0.0/10.0
$222,555
🖨 Deal sheet (PDF) 📄 Offer letter ✓ Due diligence
Listing remarks
Opportunity knocks on the door at 310 Spring Street in Royersford Borough, Spring Ford Schools. Located just a block away from Royersford Elementary, walking distance to Spring Fords Main Campus, and just a half of block from beloved Victory Park; this is the ideal location/block for the new owner or for a great income producing property as a rental in our desired local market. With a new roof in 2026, replacement windows throughout the home, quaint porch setting, and fenced in rear yard with shed; this 3 bedroom , 1 bath home with 2 car off street parking on this loved community block has so much potential and opportunity. Please bring you vision of opportunity to the home for a showing wi
Key facts
- 2 parking spots
- Built 1898
- Listed 5 days
Property features AI
Finance
- Other: Ground rent paid annually
Exterior
- Parking: Two driveway parking spaces; On-street parking available; Two total garage/parking spaces
- Utilities: Public water; Public sewer; Oil hot water and oil hot water supply; Electric service (100 amp); Cable and fiber optic internet available; Above-ground utilities
- Home design: Semi-detached property; One or more stories (traditional layout); Fee simple ownership; Not in a federal flood zone
- Construction: Brick construction; Stone foundation; Rubber roof; Replacement windows; Basement present (unfinished)
- Exterior features: Porch(es); Shed/shop on the property; Crushed stone parking surface; Public municipal trash service
Interior
- Kitchen: Refrigerator; Electric oven/range
- Bedrooms: Three bedrooms on the upper level
- Flooring: Carpet
- Bathrooms: One full bathroom
- Heating & cooling: Hot water heating (oil-fired); Window air conditioning units; 100 amp electrical service
- Interior features: Carpeted floors; Ceiling fans; Combination dining and living area; Traditional floor plan; Eat-in kitchen; Plaster walls and ceilings
- Laundry & utility: Washer and dryer on the main floor; Unfinished basement
Neighborhood map
What this means for you Summary
Snapshot
- This is a 3-bed/1.0-bath single-family listed at $223k.
Deal economics
- At list price, monthly cash flow is $374 ($4k/yr) — positive.
- The deal already cash-flows at list — no discount required.
- Meets the 1% rule at list price ($2k rent vs $223k).
- Cap rate 8.3% vs local median 3.5% in Royersford — top-decile yield for the area; either an underpriced asset or a hidden risk that comps aren't pricing in. Stress-test before assuming the spread holds.
Location & tenants
- Location reads 82/100 on livability (#140 in PA, #1,131 nationally) — a professional / high-income tenant draw. Strengths: crime A+, housing A+, health & safety A+; Watch: amenities D-, commute F.
- Spring-Ford Area SD (suburban): math 58% / reading 78% proficiency, ranked #23 of 539 in PA (top 4%) — acceptable for families but not a draw, mixed tenant base, ~2y average lease; only 11% free/reduced lunch — higher-income household profile.
- Zoned schools: Royersford El Sch (math 62% / reading 67%, grade B, #249 of 1,518 statewide, top 19%, 378 students, 39% FRL); Spring-Ford Intrmd Sch 5Th/6Th (math 49% / reading 77%, grade B+, #29 of 512 statewide, top 5%, 1,278 students, 19% FRL); Spring-Ford Shs 9-12 Ctr (math 94% / reading 86%, grade A+, #3 of 437 statewide, top 0%, 2,631 students, 18% FRL).
- Market conditions: Rents soft (-1.2%/yr); 138 active listings in the ZIP; 15 comparable units currently listed for rent nearby; rentals at typical pace (median 26d on market — plan ~3-4 weeks tenant-placement turnaround); 40% of comp listings sitting > 30 days — soft ceiling on asking rent; solid renter incomes; 1,936 units permitted in Montgomery County in 2024 (530 in 5+ unit buildings).
Forward outlook
- Local home prices are declining (-3.0%/yr); year-one equity from $2k of loan paydown is wiped out by about $7k of value loss. Plan a longer hold.
- Montgomery County population projected at +5% by 2050 — modest demand growth; plan on rents tracking national, not racing it.
Negotiation context
- Only 5 days on market — expect competitive offers; lowballing is unlikely to land.
Risks & watch-outs
- Watch-outs: built in 1898 — expect roof / HVAC / electrical / plumbing capex.
- Climate carrying-cost: moderate wind risk, 23% chance of damaging wind over 30y; extreme-heat days projected 7→15/yr by 2055 (HVAC capex compounding) — expect insurance premiums to compound above CPI over the hold.
Questions for the listing agent
- Built in 1898 — when were the roof, HVAC, electrical panel, plumbing, and water heater last replaced?
- Is there a deadline driving the sale (1031 exchange, divorce, estate, relocation)? That informs how much negotiation room exists.
- Schools are A-rated — typically a magnet for longer-tenancy family renters. What's the average tenant stay here, and is there a school-zone premium baked into asking?
- What's the average days-on-market for RENTAL listings here right now (not sales)? A rising rental-DOM trend means longer vacancies and softer asking-rent achievability than the comps imply.
- What's the recent tenant-quality profile in this submarket — average credit score on applications, eviction rate, late-payment / NSF rate, and stable-employment percentage? A property-management company in the area should have these aggregated.
- How much new for-sale + rental construction is in the pipeline within 1–3 miles? Heavy new supply typically softens prices + rents 12–24 months out; constrained supply supports both.
Investment metrics
- 1% rule
- 1.12% ✓
- Cap rate
- 8.31%
- Cash-on-cash
- 7.20%
- DSCR
- 1.32
- GRM
- 7.4
CMA / ARV
- ARV (median comp)
- $329,491
- List price
- $222,555
- Delta
- -32.45%
- Verdict
- UNDERPRICED
- Comps
- 20 within 1.0 mi
Show comp detail 9 sales within ~0.75 mi
| Address | Dist | Beds/Ba | Sqft | Sold | Price | $/sf | Match |
|---|---|---|---|---|---|---|---|
| 670 Church St | 0.54mi | 3/1.5 | 1,295 (-0%) | 0mo | $395,000 | $305 | 72 |
| 501 Vaughn Rd | 0.53mi | 3/1.5 | 1,320 (+2%) | 11mo | $410,000 | $311 | 61 |
| 509 Vaughn Rd | 0.55mi | 3/1.5 | 1,360 (+5%) | 12mo | $430,000 | $316 | 55 |
| 116 Pikeland Ave | 0.67mi | 3/2.5 | 1,373 (+6%) | 2mo | $445,500 | $324 | 52 |
| 769 Main St | 0.64mi | 3/1.0 | 1,344 (+3%) | 23mo | $354,000 | $263 | 45 |
| 824 Spring St | 0.69mi | 3/1.0 | 1,236 (-5%) | 20mo | $355,000 | $287 | 43 |
| 216 S S And K St | 0.65mi | 3/1.0 | 1,215 (-6%) | 23mo | $275,000 | $226 | 39 |
| 700 Walnut St | 0.51mi | 2/1.0 (-1) | 1,473 (+13%) | 12mo | $400,000 | $272 | 39 |
| 72 Central Ave | 0.62mi | 3/2.0 | 1,128 (-13%) | 21mo | $295,000 | $262 | 28 |
Match score weights: distance 35% · size 25% · config 20% · recency 20%. Top-matched comps best support the ARV.
Projected returns pro-forma
-3.0% appreciation · 0.0% rent growth · sell at horizon
- IRR
- -8.8%
- Equity multiple
- 0.69×
- Total profit
- $-19,498
- Equity at exit
- $33,184
- IRR
- -4.0%
- Equity multiple
- 0.77×
- Total profit
- $-14,317
- Equity at exit
- $19,242
Cash invested: $62,315 (down + closing). Projections, not guarantees.
Landlord ↔ Tenant lean methodology
- Overall (STATE)
- 62 Landlord-Friendly
- State Pennsylvania
- 62 Landlord-Friendly · EVEN
- County
- — inherits STATE
- City
- — inherits STATE
ZIP-level market 19468
- Rents YoY
- -1.2%
- Active inventory
- 138
- Price-to-rent
- 7.4×
Monthly cashflow live
- Estimated rent
- $2,500 high interval (Pro) →
- Mortgage (P&I)
- −$1,167
- Tax from tax record
- −$342 /mo · $4,099/yr
- Insurance
- −$93
- HOA
- −$0
- Vacancy / Maint / Mgmt
- −$525
- Net cashflow
- $374
Break-even live
Sensitivity live
| Price | -10% $500 | -5% $437 | +0% $374 | +5% $311 | +10% $248 |
|---|---|---|---|---|---|
| Rent | -10% $176 | -5% $275 | +0% $374 | +5% $473 | +10% $571 |
| Rate | -1.0pp $486 | -0.5pp $431 | base $374 | +0.5pp $316 | +1.0pp $258 |
UW: 25.0% down · 7.5% · 30yr · 1.5% tax · 5.0% vac · 8.0% maint · 8.0% mgmt
Financing live
Cash to close
- Down payment
- $55,639
- Closing costs
- $6,677
- Reserves months
- —
- Total cash needed
- —
Loan-product check · same deal, 3 products live
Conventional
25% down · 7.5% · 30yr
- Down + closing
- —
- Monthly P&I
- —
- Monthly cashflow
- —
- DSCR
- —
- Eligible?
- —
Personal DTI + credit; lowest rate.
DSCR
20% down · 8.5% · 30yr
- Down + closing
- —
- Monthly P&I
- —
- Monthly cashflow
- —
- DSCR
- —
- Eligible?
- —
No personal income docs; deal must DSCR.
Hard money
10% down · 12.0% · 12mo
- Down + closing
- —
- Monthly P&I
- —
- Monthly cashflow
- —
- DSCR
- —
- Eligible?
- —
Short-term bridge; refi at stabilization.
Rent comps 15 comps
| Address | Beds | Baths | Sqft | Rent | $/sqft | DOM | Units | Dist |
|---|---|---|---|---|---|---|---|---|
| 263 Washington St Royersford, PA | 3.0 | 1.5 | 1212 | $2,600 | $2.15 | 45d | 1 | 0.12mi |
| 400 Main St Unit 8 Royersford, PA | 2.0 | 1.0 | 900 | $1,945 | $2.16 | 45d | 1 | 0.24mi |
| 5 Cameron Ct Royersford, PA | 3.0 | 2.5 | 1814 | $2,700 | $1.49 | 45d | 1 | 0.32mi |
| 50 Clover Pl #50 Royersford, PA | 3.0 | 3.5 | 1742 | $2,800 | $1.61 | 45d | 1 | 0.34mi |
| 624 Main St Royersford, PA | 2.0 | 1.0–2.0 | 822 | $2,445 | $2.97 | 0d | 3 | 0.44mi |
| 205 Horseshoe Dr #205 Royersford, PA | 2.0 | 2.0 | 1019 | $1,795 | $1.76 | 7d | 1 | 0.79mi |
| 902 Magnolia Ln Spring City, PA | 3.0 | 2.5 | 1798 | $3,200 | $1.78 | 0d | 1 | 0.85mi |
| 170 Providence Forge Rd Royersford, PA | 3.0 | 2.5 | 1820 | $2,400 | $1.32 | 26d | 1 | 0.86mi |
| 337 Bridge St Spring City, PA | 3.0 | 1.0 | 1611 | $2,300 | $1.43 | 20d | 1 | 0.88mi |
| 601 Lakeview Dr Royersford, PA | 1.0–2.0 | 1.0–2.0 | 1044 | $2,779 | $2.66 | 0d | 18 | 1.04mi |
| 208 Foxmeadow Dr Unit CONDO 208 Royersford, PA | 2.0 | 2.0 | 1186 | $2,100 | $1.77 | 45d | 1 | 1.10mi |
| 1005 Foxmeadow Dr Unit CONDO 1005 Royersford, PA | 2.0 | 2.0 | 1038 | $2,250 | $2.17 | 45d | 1 | 1.23mi |
| 1512 Foxmeadow Cir Unit CONDO 1512 Royersford, PA | 2.0 | 1.0 | 1120 | $2,300 | $2.05 | 26d | 1 | 1.30mi |
| 2205 Foxmeadow Dr Unit CONDO 2205 Royersford, PA | 2.0 | 2.0 | 1267 | $2,200 | $1.74 | 16d | 1 | 1.35mi |
| 1302 Foxmeadow Cir Royersford, PA | 3.0 | 2.5 | 1782 | $2,500 | $1.40 | 26d | 1 | 1.42mi |
Listing history 3 events
-
2026-05-04status Pending 711-char remark
-
2026-04-30$222,555 Active 711-char remark
-
2026-04-27historical $222,555 711-char remark
ⓘ Source: listings_history table (triggers on properties + properties_extension) + one-shot
backfill from property_details.listing_events for pre-trigger history.
Tax reassessment forecast PA · Partial reset (capped growth)
- Current annual tax
- $4,099 · $342/mo
- Projected year-2 tax
- $4,099 · $342/mo
- Expected delta
- $0/yr ($0/mo · 0.0%)
ⓘ Screening estimate from a state-policy table — verify with the county assessor before closing.
Climate risk First Street
- Flood 1/10 Low FEMA zone X (unshaded) · 0% chance over 30 yrs
- Wildfire 1/10 Low
- Heat 6/10 Major 7 d/yr ≥101°F today · 15 d/yr by 30 yrs out
- Wind 5/10 Major 23% chance of damaging wind over 30 yrs
- Air quality 4/10 Moderate 3 unhealthy d/yr today · 6 by 30 yrs out
Nearby sold comps map
Loading sold comps map…
Walkable amenities ~0.75 mi
Loading nearby amenities…
Taxation est. · year 1
- Rental income
- $30,005
- − Mortgage interest
- −$12,467
- − Property taxes
- −$4,099
- − Insurance
- −$1,113
- − Repairs & maintenance
- −$2,400
- − Management
- −$2,400
- − Depreciation
- −$6,474
- Taxable income
- $1,052
- Est. tax owed @ 24.0%
- −$252
- After-tax cash flow
- $4,235/yr
For passive investors: Depreciation is non-cash, so a rental often shows a tax loss while cash-flowing — sheltering income. Rental losses are passive: they offset passive income freely, and up to $25,000/yr can offset ordinary (W-2) income if you actively participate and your MAGI is under $100k (phasing out to $0 by $150k); unused losses carry forward. On sale, claimed depreciation is recaptured at up to 25%, and gains may owe capital-gains tax (a 1031 exchange can defer both). Figures are a year-1 estimate at your 24.0% rate — not tax advice; consult a CPA.
Schools (NCES district)
- District
- Spring-Ford Area SD
- NCES district ID
- 4222560
- Math proficiency
- 58% ▼ -11.00%
- Reading proficiency
- 78% ▼ -5.00%
- Median HH income
- $84,931
- Composite
- 60.97/100
- National rank
- #802
- State rank
- #23 of 539 in PA
Livability — Royersford
- Score
- 82/100
- State rank
- #140
- US rank
- #1131
Category grades
Schools grade is shown separately in the Schools card above.
Census & demographics
- Census place
- Royersford, PA
- County
- Montgomery County · 712,331 people
- City population
- 28,194
- Metro
- Philadelphia-Camden-Wilmington, PA-NJ-DE-MD
- Population (ZIP)
- 28,194
- Household income
- $108,534
- Rent vs Own
- Severe rent burden
- 555.0
Population outlook (Montgomery County) Hauer SSP2
- Today (2025)
- 856,074 people
- By 2030
- 870,887 · +1.7%
- By 2040
- 891,195 · +4.1%
- By 2050
- 896,417 · +4.7%
- By 2075
- 903,212 · +5.5%
- By 2100
- 843,240 · -1.5%
Race, ethnicity, and origin ACS 2023
- Neighborhood character
- Predominantly White (84%)
- Race & ethnicity
- White 84% Asian 7% Two or more races 3% Hispanic / Latino 3% Black 2%
- Common ancestry
- Romanian 9% Slovak 1% Lithuanian 1%
- Foreign-born
- 7% · Canada, China, Vietnam
- Languages at home
- 91% English-only · Other Indo-European 3% Spanish 2% Other Asian/Pacific 2%
Political lean MEDSL · Montgomery
- 2024 margin
- Strong D (+22.8) · D 60.9% · R 38.1% · Other 1.1%
- 2008→2024 swing
- +2.0pp toward D · 2008: 20.8pp · 2024: 22.8pp
- All cycles
- 2024: D+22.8 2020: D+26.3 2016: D+21.1 2012: D+14.3 2008: D+20.8
Not yet ingested
- Civics
- —
Market trends
- HPI YoY
- ▼ -269.11%
- Current HPI
- 300.9404
- Rent YoY
- ▼ -1.17%
- Metro
- Philadelphia-Camden-Wilmington, PA-NJ-DE-MD
- State GDP YoY
- ▲ 1.68%
- F500 in state
- 34
Industry mix (Fortune 500 HQ in PA)
| Industry | F500 HQs | Revenue |
|---|---|---|
| Healthcare | 2 | $309B |
|
||
| Insurance | 2 | $27B |
|
||
| Telecommunications / Media | 1 | $124B |
|
||
| Industrial Distribution | 1 | $22B |
|
||
| Financial Services | 1 | $20B |
|
||
| Chemicals / Materials | 1 | $18B |
|
||
Price history
+0.0% since first listed3 events — show timeline
- 2026-05-04 Pending — BRIGHT MLS
- 2026-04-30 Listed $222,555 BRIGHT MLS
- 2026-04-27 Coming Soon $222,555 BRIGHT MLS
Property tax history
+3.0%/yrLatest (2026): $4,099 · +4.1% YoY. Source: county tax records.
Cash-flow waterfall
monthlySold comps — $/sqft
last 12 mo · ≤1 miLoading sold comps…