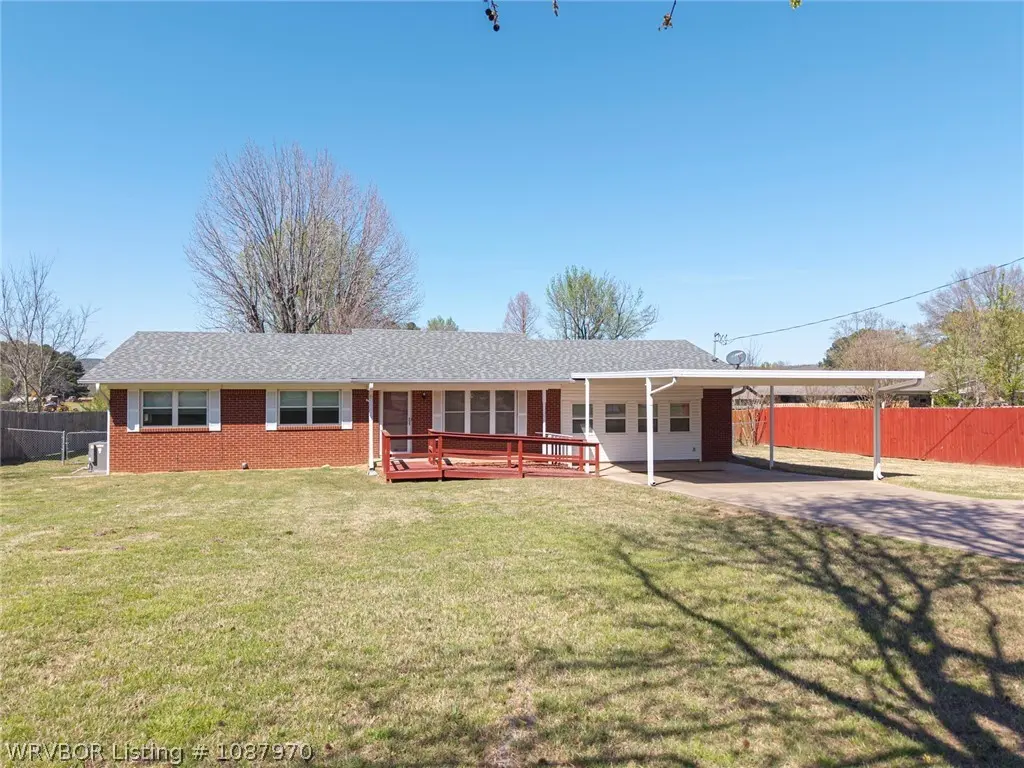
1302 Rena Rd · Van Buren, AR
Flood risk 1/10 · Minimal
- FEMA flood zone
- X (unshaded)
- Chance of flooding over 30 yrs
- 0.0%
- Est. flood insurance / yr
- $507 – $1,088
Fire risk 6/10 · Moderate
- Est. fire insurance / yr
- $1,499 – $2,785
Heat risk 7/10 · Major
- Hot days now (above 111°F)
- 7 days/yr
- Hot days in 30 yrs
- 21 days/yr
Wind risk 2/10 · Minimal
- Chance of severe wind over 30 yrs
- 2.0%
Air-quality risk 2/10 · Minimal
- Unhealthy air days now
- 1 days/yr
- Unhealthy air days in 30 yrs
- 1 days/yr
Risk factors via First Street. Map © Google.
Why this score? — see what drove the D grade
The composite is a weighted blend of 9 inputs, each scored 0–100. Each bar is that input's sub-score; the figure is the points it added to the 100-point composite (weight × sub-score).
- ARV discount +11.9/15.0
- Cash flow +10.1/30.0
- Rent growth +3.7/5.0
- Livability +3.5/5.0
- Schools +3.4/10.0
- 1% rule +3.0/10.0
- DSCR +2.9/10.0
- Condition / age +2.5/5.0
- Appreciation +0.0/10.0
$205,000
🖨 Deal sheet (PDF) 📄 Offer letter ✓ Due diligence
Listing remarks
Nestled on a flat, oversizied 1 acre lot, this charming 3-bedroom , 2-bathroom brick home offers the perfect blend of comfort and convenience. The property features a large fence backyard shaded by mature trees-ideal for relaxing, entertaning, or pets. Inside , you'll find spacious living areas filled with natural light thanks to an abundance of windows. The home showcases a mix of wood-look laminate flooring , ceramic tile, and carpet in the bedrooms. The eat-in-kitchen provides a great space for everyday meals. Cedar-lined indoor storage closet large laundry room with built in storage cabinets. Covered front and back porches, ramp leading up to front door. Outdoors the property has two st
Key facts
- Oversized 1 acre lot
- Natural light
- Mature trees
Tags
Property features AI
Finance
- Other: Accessible entrance with ramp
Exterior
- Parking: Attached concrete garage with 2 covered spaces
- Security: Smoke detectors
- Utilities: Public water; Sewer available; Electricity available; Natural gas available
- Home design: Single-family house; One level
- Construction: Brick and vinyl siding; Asphalt shingle roof; Slab foundation; Built as a residential single-family residence
- Exterior features: Covered patio/porch; Deck; Back yard fencing; Cleared, level city lot; Paved, public-maintained road; Workshop and outbuilding
Interior
- Kitchen: Range; Plumbed for ice maker
- Flooring: Carpet; Ceramic tile; Laminate
- Bathrooms: 2 full bathrooms
- Heating & cooling: Central heating (natural gas); Central air conditioning (electric); Ceiling fans
- Interior features: Ceiling fans; Eat-in kitchen; Storage; Blinds
- Laundry & utility: Washer hookup; Electric dryer hookup; Gas water heater
Neighborhood map
What this means for you Summary
Snapshot
- This is a 3-bed/2.0-bath single-family listed at $205k.
Deal economics
- At list price, monthly cash flow is $-119 ($-1k/yr) — negative.
- To cash-flow at today's rent, offer at most $188k (8.4% below list).
- To meet the 1% rule (rent ≥ 1% of price), the offer needs to be $164k (19.9% below list).
- Recommended offer: $164k (19.9% below list) — sets the bar for 1% rule.
- Cap rate 5.6% vs local median 3.9% in Van Buren — top-decile yield for the area; either an underpriced asset or a hidden risk that comps aren't pricing in. Stress-test before assuming the spread holds.
Location & tenants
- Location reads 69/100 on livability (#75 in AR) — a middle-class / working-renter tenant base. Strengths: cost of living A+, housing A+, health & safety A; Watch: employment D, crime D-, amenities F.
- Van Buren School District (suburban): math 41% / reading 41% proficiency, ranked #62 of 238 in AR (top 26%) — families likely to look elsewhere, expect single-tenant / working-renter base with shorter leases.
- Zoned schools: Rena Elementary School (math 59% / reading 46%, grade C-, #75 of 454 statewide, top 17%, 439 students, 43% FRL); Northridge Middle School (math 54% / reading 51%, grade C+, #27 of 201 statewide, top 14%, 753 students, 46% FRL); Van Buren High School (math 25% / reading 44%, grade F, #92 of 292 statewide, top 37%, 1,228 students, 48% FRL) — zoned schools at 45% FRL track the district average.
- Market conditions: Rents rising fast (+4.8%/yr); 249 active listings in the ZIP; 4 comparable units currently listed for rent nearby; rentals at typical pace (median 23d on market — plan ~3-4 weeks tenant-placement turnaround); 47 units permitted in Crawford County in 2024 (0 in 5+ unit buildings).
- This rent runs 31% of the median local income ($63k/yr) — at the standard rent-burdened threshold; future hikes will face affordability resistance.
Forward outlook
- Local home prices are declining (-3.0%/yr); year-one equity from $1k of loan paydown is wiped out by about $6k of value loss. Plan a longer hold.
- Crawford County population projected to shrink 7% by 2050 — rents likely to lag national; underwrite the cash flow, not the appreciation.
Negotiation context
- It's been on market 23 days — a 2% lower offer ($202k) is reasonable based on typical stale-listing flexibility.
- 4 sale attempts with the ask held roughly flat each time — persistent listings suggest the price (not the market) is what's stuck; bring a comps-based counter.
- Current owner paid $28k; list at $205k implies a 624% gain — meaningful room to come down on a strong offer.
Risks & watch-outs
- Climate carrying-cost: major wildfire risk; extreme-heat days projected 7→21/yr by 2055 (HVAC capex compounding) — expect insurance premiums to compound above CPI over the hold.
Questions for the listing agent
- What do current leases actually rent for vs. the listed asking? Can we see a recent rent roll and the last 12 months of T-12 income?
- Built in 1968 — when were the roof, HVAC, electrical panel, plumbing, and water heater last replaced?
- Is there a deadline driving the sale (1031 exchange, divorce, estate, relocation)? That informs how much negotiation room exists.
- Crime grade is D in this area — have there been break-ins, vandalism, or insurance claims at this property in the last 3 years? What carrier currently insures it and at what premium?
- The area grade is low — what's the realistic commute time and amenity access for the typical tenant pool here? Any planned neighborhood developments (good or bad) we should know about?
- What's the average days-on-market for RENTAL listings here right now (not sales)? A rising rental-DOM trend means longer vacancies and softer asking-rent achievability than the comps imply.
- What's the recent tenant-quality profile in this submarket — average credit score on applications, eviction rate, late-payment / NSF rate, and stable-employment percentage? A property-management company in the area should have these aggregated.
- How much new for-sale + rental construction is in the pipeline within 1–3 miles? Heavy new supply typically softens prices + rents 12–24 months out; constrained supply supports both.
Investment metrics
- 1% rule
- 0.80% ✗
- Cap rate
- 5.60%
- Cash-on-cash
- -2.49%
- DSCR
- 0.89
- GRM
- 10.4
CMA / ARV
- ARV (median comp)
- $226,988
- List price
- $205,000
- Delta
- -3.30%
- Verdict
- FAIR
- Comps
- 20 within 1.0 mi
Show comp detail 12 sales within ~0.75 mi
| Address | Dist | Beds/Ba | Sqft | Sold | Price | $/sf | Match |
|---|---|---|---|---|---|---|---|
| 2005 Broken Hill Dr | 0.36mi | 3/2.0 | 1,646 (-7%) | 5mo | $246,900 | $150 | 67 |
| 1611 Somerset Way | 0.60mi | 3/2.0 | 1,865 (+6%) | 2mo | $250,000 | $134 | 61 |
| 1115 Richmond Rd | 0.73mi | 3/2.0 | 1,821 (+3%) | 0mo | $299,500 | $164 | 60 |
| 1707 Valley View St | 0.55mi | 3/2.0 | 1,835 (+4%) | 9mo | $274,900 | $150 | 60 |
| 2002 Broken Hill Dr | 0.39mi | 3/2.0 | 1,576 (-11%) | 8mo | $210,000 | $133 | 57 |
| 2010 Broken Hill St | 0.40mi | 3/2.0 | 1,553 (-12%) | 10mo | $225,000 | $145 | 54 |
| 2203 Marble Cir | 0.68mi | 4/2.0 (+1) | 1,806 (+2%) | 8mo | $190,000 | $105 | 52 |
| 1606 Broken Hill Dr | 0.60mi | 4/2.0 (+1) | 1,915 (+9%) | 1mo | $278,000 | $145 | 52 |
| 1620 Hunter Hill Dr | 0.67mi | 3/2.0 | 1,660 (-6%) | 9mo | $212,000 | $128 | 51 |
| 1616 Valley View St | 0.64mi | 3/2.0 | 1,890 (+7%) | 10mo | $290,000 | $153 | 50 |
| 1010 Fir Dr | 0.50mi | 3/2.5 | 2,007 (+14%) | 11mo | $315,000 | $157 | 42 |
| 2600 Pearl Blvd | 0.70mi | 3/2.0 | 1,517 (-14%) | 7mo | $232,500 | $153 | 38 |
Match score weights: distance 35% · size 25% · config 20% · recency 20%. Top-matched comps best support the ARV.
Projected returns pro-forma
-3.0% appreciation · 4.76% rent growth · sell at horizon
- IRR
- -18.5%
- Equity multiple
- 0.34×
- Total profit
- $-37,818
- Equity at exit
- $30,566
- IRR
- -7.7%
- Equity multiple
- 0.48×
- Total profit
- $-30,005
- Equity at exit
- $17,725
Cash invested: $57,400 (down + closing). Projections, not guarantees.
Landlord ↔ Tenant lean methodology
- Overall (STATE)
- 92 Strongly Landlord-Friendly
- State Arkansas
- 92 Strongly Landlord-Friendly · R+14
- County
- — inherits STATE
- City
- — inherits STATE
ZIP-level market 72956
- Rents YoY
- 4.8%
- Active inventory
- 249
- Price-to-rent
- 10.4×
Monthly cashflow live
- Estimated rent
- $1,643 medium interval (Pro) →
- Mortgage (P&I)
- −$1,075
- Tax est. 1.5%
- −$256 /mo · $3,075/yr
- Insurance
- −$85
- HOA
- −$0
- Vacancy / Maint / Mgmt
- −$345
- Net cashflow
- $-119
Break-even live
Sensitivity live
| Price | -10% $23 | -5% $-48 | +0% $-119 | +5% $-190 | +10% $-261 |
|---|---|---|---|---|---|
| Rent | -10% $-249 | -5% $-184 | +0% $-119 | +5% $-54 | +10% $11 |
| Rate | -1.0pp $-16 | -0.5pp $-67 | base $-119 | +0.5pp $-172 | +1.0pp $-226 |
UW: 25.0% down · 7.5% · 30yr · 1.5% tax · 5.0% vac · 8.0% maint · 8.0% mgmt
Financing live
Cash to close
- Down payment
- $51,250
- Closing costs
- $6,150
- Reserves months
- —
- Total cash needed
- —
Loan-product check · same deal, 3 products live
Conventional
25% down · 7.5% · 30yr
- Down + closing
- —
- Monthly P&I
- —
- Monthly cashflow
- —
- DSCR
- —
- Eligible?
- —
Personal DTI + credit; lowest rate.
DSCR
20% down · 8.5% · 30yr
- Down + closing
- —
- Monthly P&I
- —
- Monthly cashflow
- —
- DSCR
- —
- Eligible?
- —
No personal income docs; deal must DSCR.
Hard money
10% down · 12.0% · 12mo
- Down + closing
- —
- Monthly P&I
- —
- Monthly cashflow
- —
- DSCR
- —
- Eligible?
- —
Short-term bridge; refi at stabilization.
Rent comps 4 comps
| Address | Beds | Baths | Sqft | Rent | $/sqft | DOM | Units | Dist |
|---|---|---|---|---|---|---|---|---|
| 927 Skyline Dr Van Buren, AR | 4.0 | 2.5 | 2511 | $2,100 | $0.84 | 22d | 1 | 0.98mi |
| 2060 Kalei Ln Van Buren, AR | 3.0 | 2.0 | 1627 | $1,695 | $1.04 | 15d | 1 | 1.02mi |
| 306 Elfen Glen St Van Buren, AR | 3.0 | 2.0 | 1800 | $1,625 | $0.90 | 15d | 1 | 1.24mi |
| 506 Jenny Wren St Van Buren, AR | 3.0 | 2.0 | 1909 | $1,800 | $0.94 | 45d | 1 | 1.25mi |
Listing history 26 events
-
2026-06-21days on market $205,000 Active 23 DOM
-
2026-06-19days on market $205,000 Active 21 DOM
-
2026-06-18days on market $205,000 Active 20 DOM
-
2026-06-17days on market $205,000 Active 19 DOM
-
2026-06-16days on market $205,000 Active 18 DOM
-
2026-06-15days on market $205,000 Active 17 DOM
-
2026-06-14days on market $205,000 Active 15 DOM
-
2026-06-13days on market $205,000 Active 14 DOM
-
2026-06-10days on market $205,000 Active 12 DOM
-
2026-06-09days on market $205,000 Active 11 DOM
-
2026-06-08days on market $205,000 Active 10 DOM
-
2026-06-07days on market $205,000 Active 9 DOM
-
2026-06-05days on market $205,000 Active 6 DOM
-
2026-06-03days on market $205,000 Active 5 DOM
-
2026-06-02days on market $205,000 Active 4 DOM
-
2026-06-01days on market $205,000 Active 3 DOM
-
2026-05-31days on market $205,000 Active 2 DOM
-
2026-05-30remarks 699-char remark
-
2026-05-30pricestatusdays on market $205,000 Active 1 DOM
-
2026-05-17status Pending 1113-char remark
-
2026-05-12status Active 1113-char remark
-
2026-05-07status Pending 1113-char remark
-
2026-04-25status Active 1113-char remark
-
2026-04-04status Pending 1113-char remark
-
2026-04-03$219,500 Active 1113-char remark
-
2004-03-30soldstatus $28,333
ⓘ Source: listings_history table (triggers on properties + properties_extension) + one-shot
backfill from property_details.listing_events for pre-trigger history.
Climate risk First Street
- Flood 1/10 Low FEMA zone X (unshaded) · 0% chance over 30 yrs
- Wildfire 6/10 Major
- Heat 7/10 Severe 7 d/yr ≥111°F today · 21 d/yr by 30 yrs out
- Wind 2/10 Low 2% chance of damaging wind over 30 yrs
- Air quality 2/10 Low 1 unhealthy d/yr today · 1 by 30 yrs out
Nearby sold comps map
Loading sold comps map…
Walkable amenities ~0.75 mi
Loading nearby amenities…
Taxation est. · year 1
- Rental income
- $19,711
- − Mortgage interest
- −$11,483
- − Property taxes
- −$3,075
- − Insurance
- −$1,025
- − Repairs & maintenance
- −$1,577
- − Management
- −$1,577
- − Depreciation
- −$5,964
- Taxable loss
- −$4,990
- Est. tax savings @ 24.0%
- +$1,197
- After-tax cash flow
- $-231/yr
For passive investors: Depreciation is non-cash, so a rental often shows a tax loss while cash-flowing — sheltering income. Rental losses are passive: they offset passive income freely, and up to $25,000/yr can offset ordinary (W-2) income if you actively participate and your MAGI is under $100k (phasing out to $0 by $150k); unused losses carry forward. On sale, claimed depreciation is recaptured at up to 25%, and gains may owe capital-gains tax (a 1031 exchange can defer both). Figures are a year-1 estimate at your 24.0% rate — not tax advice; consult a CPA.
Schools (NCES district)
- District
- Van Buren School District
- NCES district ID
- 0513410
- Math proficiency
- 41% ▼ -8.00%
- Reading proficiency
- 41% ▼ -4.00%
- Median HH income
- $40,350
- Composite
- 34.41/100
- National rank
- #5201
- State rank
- #62 of 238 in AR
Livability — Van Buren
- Score
- 69/100
- State rank
- #75
- US rank
- #8898
Category grades
Schools grade is shown separately in the Schools card above.
Census & demographics
- Census place
- Van Buren, AR
- County
- Crawford County · 34,546 people
- City population
- 34,546
- Metro
- Fort Smith, AR-OK
- Population (ZIP)
- 34,546
- Household income
- $62,988
- Rent vs Own
- Severe rent burden
- 571.0
Population outlook (Crawford County) Hauer SSP2
- Today (2025)
- 62,108 people
- By 2030
- 61,519 · -0.9%
- By 2040
- 59,735 · -3.8%
- By 2050
- 57,521 · -7.4%
- By 2075
- 53,143 · -14.4%
- By 2100
- 49,596 · -20.1%
Race, ethnicity, and origin ACS 2023
- Neighborhood character
- Predominantly White (76%)
- Race & ethnicity
- White 76% Hispanic / Latino 12% Two or more races 11% Asian 2% Native American 1% Black 1%
- Hispanic origin (detail)
- Mexican 5%
- Common ancestry
- Lithuanian 1% Slovak 1% Romanian 1%
- Foreign-born
- 6% · Canada
- Languages at home
- 89% English-only · Spanish 10%
Political lean MEDSL · Crawford
- 2024 margin
- Solid R (+58.2) · D 19.9% · R 78.1% · Other 2.0%
- 2008→2024 swing
- -12.1pp toward R · 2008: -46.0pp · 2024: -58.2pp
- All cycles
- 2024: R+58.2 2020: R+56.7 2016: R+55.0 2012: R+49.9 2008: R+46.0
Not yet ingested
- Civics
- —
Market trends
- HPI YoY
- ▼ -156.05%
- Current HPI
- 221.3066
- Rent YoY
- ▲ 4.76%
- Metro
- Fort Smith, AR-OK
- State GDP YoY
- ▲ 3.80%
- F500 in state
- 10
Industry mix (Fortune 500 HQ in AR)
| Industry | F500 HQs | Revenue |
|---|---|---|
| Retail | 1 | $681B |
|
||
| Food / Agriculture | 1 | $53B |
|
||
| Retail / Energy | 1 | $22B |
|
||
| Transportation / Logistics | 1 | $12B |
|
||
| Energy | 1 | $4B |
|
||
Price history
+623.5% since first listed8 events — show timeline
- 2026-05-29 Listed $205,000 WRVBOR
- 2026-05-17 Pending — WRVBOR
- 2026-05-12 Relisted — WRVBOR
- 2026-05-07 Pending — WRVBOR
- 2026-04-25 Relisted — WRVBOR
- 2026-04-04 Pending — WRVBOR
- 2026-04-03 Listed $219,500 WRVBOR
- 2004-03-30 Sold (Public Records) $28,333 Public Records
Property tax history
-6.1%/yrLatest (2025): $180 · -35.7% YoY. Source: county tax records.
Cash-flow waterfall
monthlySold comps — $/sqft
last 12 mo · ≤1 miLoading sold comps…