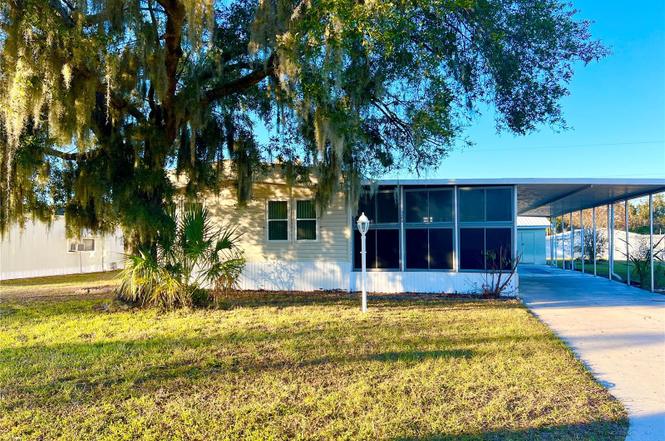
326 Martin Dr · Lakeland, FL
Flood risk 1/10 · Minimal
- FEMA flood zone
- X (unshaded)
- Chance of flooding over 30 yrs
- 0.0%
- Est. flood insurance / yr
- $507 – $1,088
Fire risk 5/10 · Moderate
- Est. fire insurance / yr
- $947 – $1,759
Heat risk 8/10 · Major
- Hot days now (above 108°F)
- 7 days/yr
- Hot days in 30 yrs
- 23 days/yr
Wind risk 9/10 · Severe
- Chance of severe wind over 30 yrs
- 99.0%
Air-quality risk 2/10 · Minimal
- Unhealthy air days now
- 1 days/yr
- Unhealthy air days in 30 yrs
- 1 days/yr
Risk factors via First Street. Map © Google.
Why this score? — see what drove the B- grade
The composite is a weighted blend of 9 inputs, each scored 0–100. Each bar is that input's sub-score; the figure is the points it added to the 100-point composite (weight × sub-score).
- Cash flow +29.9/30.0
- DSCR +10.0/10.0
- 1% rule +8.7/10.0
- ARV discount +7.5/15.0
- Livability +3.9/5.0
- Schools +3.5/10.0
- Rent growth +2.7/5.0
- Condition / age +2.5/5.0
- Appreciation +0.0/10.0
$129,000
🖨 Deal sheet 📄 Offer letter ✓ Due diligence
Listing remarks
Virtually Staged. Charming 2-Bedroom Home with Bonus Sunroom & Double Screened Patios! Welcome to this well-maintained 2 bedroom, 2 bath home featuring a spacious bonus room/sunroom, perfect as an additional living area, office, or hobby space. New Heat pump. Newer Windows and appliances. The open floor plan creates a warm, inviting atmosphere ideal for relaxing or entertaining. Enjoy Florida living at its finest with two large screened patios—one conveniently located off the Primary Bedroom, offering a private outdoor retreat. Situated on a large lot, this property includes a detached shed equipped with a workshop and electric, providing endless possibilities for storage, craft
Key facts
- Clubhouse
- Community pool
- Workshop area
Tags
Property features AI
Finance
- Other: Lease restrictions apply
- Financial info: Total monthly fees $46; Total annual fees $552
- HOA & community: Has HOA (Martin Estates) with required association approval; Monthly HOA fee $46; Senior community; Pets allowed with breed restrictions
Exterior
- Parking: Carport with 5 spaces
- Utilities: Public water; Septic tank; Cable available and connected; Electricity available and connected
- Home design: Residential mobile home (double wide); One level; South-facing
- Construction: Vinyl siding; Metal roof
- Exterior features: Covered, enclosed and screened porches (rear and side); Patio; Sliding doors; Storage; Shed(s) / Workshop
Interior
- Kitchen: Dishwasher; Range; Range hood; Refrigerator
- Bedrooms: 2 bedrooms
- Flooring: Carpet; Vinyl
- Bathrooms: 2 full bathrooms
- Heating & cooling: Central heating; Heat pump; Central air conditioning
- Interior features: Ceiling fans; Open floor plan; Bonus room; Inside utility/storage
- Laundry & utility: Inside laundry room; Washer hookup; Washer and dryer included
Neighborhood map
What this means for you Summary
Snapshot
- This is a 2-bed/2.0-bath manufactured listed at $129k.
Deal economics
- At list price, monthly cash flow is $478 ($6k/yr) — positive.
- The deal already cash-flows at list — no discount required.
- Meets the 1% rule at list price ($2k rent vs $129k).
- Recommended offer: $114k (12.0% below list) — sets the bar for market timing.
Location & tenants
- Location reads 77/100 on livability (#206 in FL, #3,179 nationally) — a middle-class / working-renter tenant base. Strengths: cost of living A+, housing A+, health & safety A+; Watch: employment D+, amenities F, commute F.
- Polk (suburban): math 39% / reading 43% proficiency, ranked #62 of 73 in FL (top 85%) — families likely to look elsewhere, expect single-tenant / working-renter base with shorter leases.
- Market conditions: Rents flat; 259 active listings in the ZIP; 24 comparable units currently listed for rent nearby; rentals at typical pace (median 23d on market — plan ~3-4 weeks tenant-placement turnaround); 10,384 units permitted in Polk County in 2024 (1,716 in 5+ unit buildings).
- This rent runs 30% of the median local income ($70k/yr) — at the standard rent-burdened threshold; future hikes will face affordability resistance.
Forward outlook
- Local home prices are declining (-3.0%/yr); year-one equity from $892 of loan paydown is wiped out by about $4k of value loss. Plan a longer hold.
- Polk County population projected at +33% by 2050 — long-run rental-demand tailwind backs the buy-and-hold thesis.
- At projected returns (-3.0% appreciation + 0.7% rent growth), your $36k cash investment doubles in ~10 years — after that, you're playing with house money.
Negotiation context
- It's been on market 184 days — a 12% lower offer ($114k) is reasonable based on typical stale-listing flexibility.
- Current owner paid $72k; list at $129k implies a 79% gain — meaningful room to come down on a strong offer.
Risks & watch-outs
- Climate carrying-cost: severe wind risk, 99% chance of damaging wind over 30y; moderate wildfire risk; extreme-heat days projected 7→23/yr by 2055 (HVAC capex compounding) — expect insurance premiums to compound above CPI over the hold.
Questions for the listing agent
- It's been on market 184 days. Have you received any prior offers? Is the seller open to a 12% concession, seller financing, or rate buy-down credit?
- Built in 1976 — when were the roof, HVAC, electrical panel, plumbing, and water heater last replaced?
- What does the HOA fee cover, when was the last increase, and are there any pending special assessments or reserve-fund shortfalls?
- Why hasn't it sold? Are there any deal-killer items the seller is aware of (foundation, flood, title, zoning, code violations)?
- Is there a deadline driving the sale (1031 exchange, divorce, estate, relocation)? That informs how much negotiation room exists.
- What's the average days-on-market for RENTAL listings here right now (not sales)? A rising rental-DOM trend means longer vacancies and softer asking-rent achievability than the comps imply.
- What's the recent tenant-quality profile in this submarket — average credit score on applications, eviction rate, late-payment / NSF rate, and stable-employment percentage? A property-management company in the area should have these aggregated.
- How much new for-sale + rental construction is in the pipeline within 1–3 miles? Heavy new supply typically softens prices + rents 12–24 months out; constrained supply supports both.
Investment metrics
- 1% rule
- 1.37% ✓
- Cap rate
- 10.74%
- Cash-on-cash
- 15.88%
- DSCR
- 1.71
- GRM
- 6.1
CMA / ARV
No comps found within radius.
Projected returns pro-forma
-3.0% appreciation · 0.65% rent growth · sell at horizon
- IRR
- 4.0%
- Equity multiple
- 1.15×
- Total profit
- $5,489
- Equity at exit
- $19,234
- IRR
- 11.2%
- Equity multiple
- 1.78×
- Total profit
- $28,131
- Equity at exit
- $11,154
Cash invested: $36,120 (down + closing). Projections, not guarantees.
Landlord ↔ Tenant lean methodology
- Overall (STATE)
- 87 Strongly Landlord-Friendly
- State Florida
- 87 Strongly Landlord-Friendly · R+3
- County
- — inherits STATE
- City
- — inherits STATE
ZIP-level market 33809
- Home prices YoY
- -20.9%
- Rents YoY
- 0.7%
- Active inventory
- 259
- Price-to-rent
- 6.1×
Monthly cashflow live
- Estimated rent
- $1,773 high interval (Pro) →
- Mortgage (P&I)
- −$676
- Tax from tax record
- −$146 /mo · $1,757/yr
- Insurance
- −$54
- HOA
- −$46
- Vacancy / Maint / Mgmt
- −$372
- Net cashflow
- $478
Break-even live
UW: 25.0% down · 7.5% · 30yr · 1.5% tax · 5.0% vac · 8.0% maint · 8.0% mgmt
Financing live
Cash to close
- Down payment
- $32,250
- Closing costs
- $3,870
- Reserves months
- —
- Total cash needed
- —
Loan-product check · same deal, 3 products live
Conventional
25% down · 7.5% · 30yr
- Down + closing
- —
- Monthly P&I
- —
- Monthly cashflow
- —
- DSCR
- —
- Eligible?
- —
Personal DTI + credit; lowest rate.
DSCR
20% down · 8.5% · 30yr
- Down + closing
- —
- Monthly P&I
- —
- Monthly cashflow
- —
- DSCR
- —
- Eligible?
- —
No personal income docs; deal must DSCR.
Hard money
10% down · 12.0% · 12mo
- Down + closing
- —
- Monthly P&I
- —
- Monthly cashflow
- —
- DSCR
- —
- Eligible?
- —
Short-term bridge; refi at stabilization.
Rent comps 24 comps
| Address | Beds | Baths | Sqft | Rent | $/sqft | DOM | Units | Dist |
|---|---|---|---|---|---|---|---|---|
| 111 Lindale St Lakeland, FL | 3.0 | 2.0 | 1400 | $2,350 | $1.68 | 23d | 1 | 0.39mi |
| 142 Lindale St Lakeland, FL | 3.0 | 2.0 | 1480 | $1,895 | $1.28 | 23d | 1 | 0.45mi |
| 8039 Ridgeglen Cir E Lakeland, FL | 3.0 | 2.0 | 1384 | $1,895 | $1.37 | 10d | 1 | 0.53mi |
| 734 Fox Lake Dr Lakeland, FL | 3.0 | 2.0 | 1337 | $1,910 | $1.43 | 3d | 1 | 1.03mi |
| 236 Village Crest Ct Lakeland, FL | 2.0 | 2.0 | 1142 | $1,550 | $1.36 | 13d | 1 | 1.03mi |
| 858 Fox Lake Dr Unit 858 Lakeland, FL | 3.0 | 2.0 | 1302 | $1,495 | $1.15 | 10d | 1 | 1.06mi |
| 239 Village Crest Ct Lakeland, FL | 2.0 | 2.0 | 912 | $1,495 | $1.64 | 23d | 1 | 1.06mi |
| 6268 Sandpipers Dr Lakeland, FL | 2.0 | 2.0 | 1484 | $1,995 | $1.34 | 23d | 1 | 1.07mi |
| 114 Rosalynn Cir Lakeland, FL | 2.0 | 2.0 | 1033 | $1,450 | $1.40 | 23d | 1 | 1.09mi |
| 124 Rosalynn Cir Lakeland, FL | 2.0 | 2.0 | 1033 | $1,550 | $1.50 | 3d | 1 | 1.10mi |
| 259 Village View Ln Lakeland, FL | 2.0 | 2.0 | 885 | $1,600 | $1.81 | 23d | 1 | 1.11mi |
| 1031 Hidden Ct Lakeland, FL | 3.0 | 2.0 | 1712 | $1,995 | $1.17 | 23d | 1 | 1.18mi |
| 235 Leelon Rd Lakeland, FL | 2.0 | 1.0 | 921 | $1,295 | $1.41 | 23d | 1 | 1.20mi |
| 6131 Doe Cir E Lakeland, FL | 3.0 | 2.0 | 1353 | $1,700 | $1.26 | 14d | 1 | 1.26mi |
| 165 Shannon Dr Lakeland, FL | 2.0 | 2.0 | 1008 | $1,350 | $1.34 | 3d | 1 | 1.29mi |
| 5818 Bambi Dr Lakeland, FL | 3.0 | 2.0 | 1401 | $2,200 | $1.57 | 23d | 1 | 1.31mi |
| 8006 Brookeshire Dr Lakeland, FL | 3.0 | 2.0 | 1301 | $1,890 | $1.45 | 18d | 1 | 1.32mi |
| 6031 Crafton Dr Lakeland, FL | 2.0 | 1.0 | 914 | $1,125 | $1.23 | 13d | 1 | 1.41mi |
| 5817 Daughtery Downs Loop Lakeland, FL | 3.0 | 2.0 | 1609 | $1,800 | $1.12 | 23d | 1 | 1.42mi |
| 5817 Daughtery Downs Loop Lakeland, FL | 3.0 | 2.0 | 1609 | $1,800 | $1.12 | 14d | 1 | 1.42mi |
| 5840 Sandpipers Dr Lakeland, FL | 3.0 | 2.0 | 1732 | $2,000 | $1.15 | 14d | 1 | 1.45mi |
| 206 Mary Catherine Ct Lakeland, FL | 3.0 | 2.0 | 1254 | $1,725 | $1.38 | 23d | 1 | 1.46mi |
| 6032 Norton Rd Unit 6032 Lakeland, FL | 2.0 | 2.0 | 880 | $1,295 | $1.47 | 23d | 1 | 1.48mi |
| 6006 Crane Dr Lakeland, FL | 2.0 | 2.0 | 1372 | $2,000 | $1.46 | 11d | 1 | 1.48mi |
HOA detail
- Monthly dues
- $46 · $552/yr
- Likely covers
- electric
Listing history 11 events
-
2026-06-18days on market $129,000 Active 184 DOM
-
2026-06-17days on market $129,000 Active 183 DOM
-
2026-06-16days on market $129,000 Active 182 DOM
-
2026-06-15days on market $129,000 Active 181 DOM
-
2026-06-13days on market $129,000 Active 179 DOM
-
2026-06-10statusdays on market $129,000 Active 176 DOM
-
2026-06-01statusdays on market $129,000 Pending 175 DOM
-
2026-05-31days on market $129,000 Active 174 DOM
-
2026-03-09price $129,000
-
2025-12-08$139,900 Active
-
2006-11-15soldstatus $72,000
ⓘ Source: listings_history table (triggers on properties + properties_extension) + one-shot
backfill from property_details.listing_events for pre-trigger history.
Tax reassessment forecast FL · Resets to sale price
- Current annual tax
- $1,757 · $146/mo
- Projected year-2 tax
- $1,757 · $146/mo
- Expected delta
- $0/yr ($0/mo · 0.0%)
ⓘ Screening estimate from a state-policy table — verify with the county assessor before closing.
Climate risk First Street
- Flood 1/10 Low FEMA zone X (unshaded) · 0% chance over 30 yrs
- Wildfire 5/10 Major
- Heat 8/10 Severe 7 d/yr ≥108°F today · 23 d/yr by 30 yrs out
- Wind 9/10 Extreme 99% chance of damaging wind over 30 yrs
- Air quality 2/10 Low 1 unhealthy d/yr today · 1 by 30 yrs out
Nearby sold comps map
Loading sold comps map…
Walkable amenities ~0.75 mi
Loading nearby amenities…
Taxation est. · year 1
- Rental income
- $21,276
- − Mortgage interest
- −$7,226
- − Property taxes
- −$1,757
- − Insurance
- −$645
- − Repairs & maintenance
- −$1,702
- − Management
- −$1,702
- − HOA
- −$552
- − Depreciation
- −$3,753
- Taxable income
- $3,939
- Est. tax owed @ 24.0%
- −$945
- After-tax cash flow
- $4,790/yr
For passive investors: Depreciation is non-cash, so a rental often shows a tax loss while cash-flowing — sheltering income. Rental losses are passive: they offset passive income freely, and up to $25,000/yr can offset ordinary (W-2) income if you actively participate and your MAGI is under $100k (phasing out to $0 by $150k); unused losses carry forward. On sale, claimed depreciation is recaptured at up to 25%, and gains may owe capital-gains tax (a 1031 exchange can defer both). Figures are a year-1 estimate at your 24.0% rate — not tax advice; consult a CPA.
Schools (NCES district)
- District
- Polk
- NCES district ID
- 1201590
- Math proficiency
- 39% ▼ -11.00%
- Reading proficiency
- 43% ▼ -4.00%
- Median HH income
- $43,979
- Composite
- 34.74/100
- National rank
- #5132
- State rank
- #62 of 73 in FL
Livability — Lakeland
- Score
- 77/100
- State rank
- #206
- US rank
- #3179
Category grades
Schools grade is shown separately in the Schools card above.
Census & demographics
- County
- Polk County · 740,051 people
- City population
- 277,690
- Metro
- Lakeland-Winter Haven, FL
- Population (ZIP)
- 30,797
- Household income
- $70,066
- Rent vs Own
- Severe rent burden
- 924.0
Population outlook (Polk County) Hauer SSP2
- Today (2025)
- 752,975 people
- By 2030
- 804,621 · +6.9%
- By 2040
- 906,117 · +20.3%
- By 2050
- 1,000,476 · +32.9%
- By 2075
- 1,197,520 · +59.0%
- By 2100
- 1,271,518 · +68.9%
Race, ethnicity, and origin ACS 2023
- Neighborhood character
- Diverse neighborhood (Simpson 0.55)
- Race & ethnicity
- White 63% Hispanic / Latino 18% Black 11% Two or more races 11% Asian 3%
- Hispanic origin (detail)
- Puerto Rican 9% Cuban 1% Dominican 2%
- Common ancestry
- Lithuanian 2% Italian 2% Romanian 2%
- Foreign-born
- 11% · Canada, Jamaica
- Languages at home
- 81% English-only · Spanish 15% Other Asian/Pacific 2% Other Indo-European 1%
Political lean MEDSL · Polk
- 2024 margin
- Strong R (+20.7) · D 39.2% · R 59.9%
- 2008→2024 swing
- -14.6pp toward R · 2008: -6.1pp · 2024: -20.7pp
- All cycles
- 2024: R+20.7 2020: R+14.4 2016: R+14.1 2012: R+6.8 2008: R+6.1
Not yet ingested
- Civics
- —
Market trends
- HPI YoY
- ▼ -79.46%
- Current HPI
- 301.3054
- Rent YoY
- ▲ 0.65%
- Metro
- Lakeland-Winter Haven, FL
- State GDP YoY
- ▲ 3.28%
- F500 in state
- 36
Industry mix (Fortune 500 HQ in FL)
| Industry | F500 HQs | Revenue |
|---|---|---|
| Industrial Technology | 2 | $29B |
|
||
| Insurance | 2 | $17B |
|
||
| Retail | 1 | $60B |
|
||
| Technology Distribution | 1 | $58B |
|
||
| Homebuilding | 1 | $35B |
|
||
| Technology Manufacturing | 1 | $35B |
|
||
Price history
+79.2% since first listed3 events — show timeline
- 2026-03-09 Price Changed $129,000 Stellar MLS as Distributed by MLS Grid
- 2025-12-08 Listed $139,900 Stellar MLS as Distributed by MLS Grid
- 2006-11-15 Sold (Public Records) $72,000 Public Records
Property tax history
+15.0%/yrLatest (2025): $1,757 · +79.2% YoY. Source: county tax records.
Cash-flow waterfall
monthlySold comps — $/sqft
last 12 mo · ≤1 miLoading sold comps…