30 Coffelt Cv · Byhalia, MS
Flood risk 1/10 · Minimal
- FEMA flood zone
- X (unshaded)
- Chance of flooding over 30 yrs
- 0.0%
- Est. flood insurance / yr
- $507 – $1,088
Fire risk 5/10 · Moderate
- Est. fire insurance / yr
- $1,241 – $2,305
Heat risk 6/10 · Moderate
- Hot days now (above 108°F)
- 7 days/yr
- Hot days in 30 yrs
- 21 days/yr
Wind risk 4/10 · Minor
- Chance of severe wind over 30 yrs
- 20.0%
Air-quality risk 2/10 · Minimal
- Unhealthy air days now
- 2 days/yr
- Unhealthy air days in 30 yrs
- 2 days/yr
Risk factors via First Street. Map © Google.
Why this score? — see what drove the D- grade
The composite is a weighted blend of 9 inputs, each scored 0–100. Each bar is that input's sub-score; the figure is the points it added to the 100-point composite (weight × sub-score).
- Cash flow +13.0/30.0
- ARV discount +7.5/15.0
- DSCR +3.9/10.0
- Livability +3.0/5.0
- 1% rule +2.5/10.0
- Rent growth +2.5/5.0
- Condition / age +2.5/5.0
- Schools +1.8/10.0
- Appreciation +0.0/10.0
$199,900
🖨 Deal sheet (PDF) 📄 Offer letter ✓ Due diligence
Listing remarks MLS
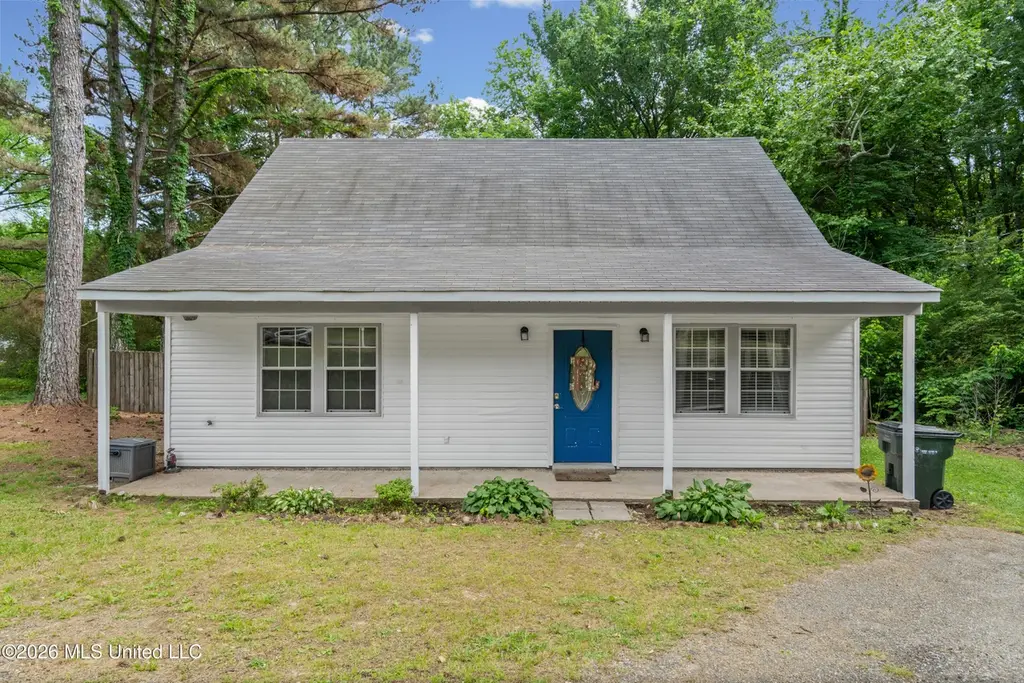
This is a DOLL HOUSE, located on very private 1.5 ac lot with a large back yard enclosed in privacy fence and a storage building. Home features beautiful flooring, 2 large BRs and 1 Bath downstairs, 1 BR and bath up and a large open bonus room! Beautiful French doors open to a large private deck.
Key facts
- Open living areas
- Extra guest area
- Bonus loft space
Tags
Property features AI
Finance
- Other: Property listed as move-in ready; Living area reported by owner
Exterior
- Parking: Driveway with gravel; No garage
- Security: Security features present
- Utilities: Septic tank sewer; Water from community and well; Electricity connected
- Home design: Single family house; Two levels
- Construction: Vinyl exterior; Slab foundation; Three-tab shingle roof; Built in owner-reported year (source: owner)
- Exterior features: Deck and porch; Wood fencing in back yard; Shed(s) on the property; Other exterior features
Interior
- Kitchen: Free-standing electric range
- Bedrooms: Primary bedroom on the main level; Additional bedrooms on main and upper levels
- Bathrooms: Two full bathrooms
- Heating & cooling: Central heating; Central air conditioning
- Interior features: Move-in ready condition; Total of 8 rooms; Blinds and vinyl window coverings
- Laundry & utility: Washer hookup; Electric dryer hookup on upper level; Electric water heater
Neighborhood map
What this means for you Summary
Snapshot
- This is a 3-bed/1.0-bath single-family listed at $200k.
Deal economics
- At list price, monthly cash flow is $-10 ($-118/yr) — negative.
- To cash-flow at today's rent, offer at most $198k (0.9% below list).
- To meet the 1% rule (rent ≥ 1% of price), the offer needs to be $151k (24.6% below list).
- Recommended offer: $151k (24.6% below list) — sets the bar for 1% rule.
- Cap rate 6.2% vs local median 2.9% in Byhalia — top-decile yield for the area; either an underpriced asset or a hidden risk that comps aren't pricing in. Stress-test before assuming the spread holds.
Location & tenants
- Location reads 60/100 on livability (#218 in MS) — a middle-class / working-renter tenant base. Strengths: crime A+, cost of living A+, housing B+; Watch: amenities F, commute F, employment F.
- Marshall County School District (rural): math 18% / reading 25% proficiency, ranked #87 of 130 in MS (top 67%) — low school quality limits family demand, transient renter base, plan for 1-2y turnover; 84% free/reduced lunch — lower-income household profile, screen leases tightly.
- Zoned schools: Byhalia Elementary School (K-4) (math 10% / reading 22%, grade F, #270 of 375 statewide, top 72%, 553 students, 100% FRL); Byhalia Middle School (5-8) (math 18% / reading 24%, grade F, #112 of 179 statewide, top 64%, 444 students, 100% FRL); Byhalia High School (9-12) (math 17% / reading 27%, grade F, #119 of 197 statewide, top 64%, 479 students, 100% FRL) — zoned schools average 100% FRL vs 84% district-wide (16 pts higher); higher-poverty schools than district average — tighter screening recommended.
- Market conditions: 356 active listings in the ZIP; 310 units permitted in Marshall County in 2024 (0 in 5+ unit buildings).
Forward outlook
- Local home prices are declining (-3.0%/yr); year-one equity from $1k of loan paydown is wiped out by about $6k of value loss. Plan a longer hold.
- Marshall County population projected at -24% by 2050 — secular population decline; favor cash flow + early exit over multi-decade hold.
Negotiation context
- Only 2 days on market — expect competitive offers; lowballing is unlikely to land.
- 6 sale attempts since 20y ago with the ask held roughly flat each time — persistent listings suggest the price (not the market) is what's stuck; bring a comps-based counter.
Risks & watch-outs
- Climate carrying-cost: moderate wildfire risk; extreme-heat days projected 7→21/yr by 2055 (HVAC capex compounding) — expect insurance premiums to compound above CPI over the hold.
Questions for the listing agent
- What do current leases actually rent for vs. the listed asking? Can we see a recent rent roll and the last 12 months of T-12 income?
- Is there a deadline driving the sale (1031 exchange, divorce, estate, relocation)? That informs how much negotiation room exists.
- Schools are F-rated, which usually means shorter tenancies and higher turnover. Who's the typical renter profile here, and what's been the actual vacancy rate?
- The area grade is low — what's the realistic commute time and amenity access for the typical tenant pool here? Any planned neighborhood developments (good or bad) we should know about?
- What's the average days-on-market for RENTAL listings here right now (not sales)? A rising rental-DOM trend means longer vacancies and softer asking-rent achievability than the comps imply.
- What's the recent tenant-quality profile in this submarket — average credit score on applications, eviction rate, late-payment / NSF rate, and stable-employment percentage? A property-management company in the area should have these aggregated.
- How much new for-sale + rental construction is in the pipeline within 1–3 miles? Heavy new supply typically softens prices + rents 12–24 months out; constrained supply supports both.
Investment metrics
- 1% rule
- 0.75% ✗
- Cap rate
- 6.23%
- Cash-on-cash
- -0.21%
- DSCR
- 0.99
- GRM
- 11.0
CMA / ARV
No comps found within radius.
Projected returns pro-forma
-3.0% appreciation · 3.0% rent growth · sell at horizon
- IRR
- -16.7%
- Equity multiple
- 0.41×
- Total profit
- $-33,105
- Equity at exit
- $29,806
- IRR
- -8.6%
- Equity multiple
- 0.46×
- Total profit
- $-29,990
- Equity at exit
- $17,284
Cash invested: $55,972 (down + closing). Projections, not guarantees.
Landlord ↔ Tenant lean methodology
- Overall (STATE)
- 90 Strongly Landlord-Friendly
- State Mississippi
- 90 Strongly Landlord-Friendly · R+11
- County
- — inherits STATE
- City
- — inherits STATE
ZIP-level market 38611
- Home prices YoY
- -11.8%
- Active inventory
- 356
- Price-to-rent
- 11.0×
Monthly cashflow live
- Estimated rent
- $1,508 medium interval (Pro) →
- Mortgage (P&I)
- −$1,048
- Tax from tax record
- −$69 /mo · $833/yr
- Insurance
- −$83
- HOA
- −$0
- Vacancy / Maint / Mgmt
- −$317
- Net cashflow
- $-10
Break-even live
Sensitivity live
| Price | -10% $103 | -5% $47 | +0% $-10 | +5% $-66 | +10% $-123 |
|---|---|---|---|---|---|
| Rent | -10% $-129 | -5% $-69 | +0% $-10 | +5% $50 | +10% $109 |
| Rate | -1.0pp $91 | -0.5pp $41 | base $-10 | +0.5pp $-62 | +1.0pp $-114 |
UW: 25.0% down · 7.5% · 30yr · 1.5% tax · 5.0% vac · 8.0% maint · 8.0% mgmt
Financing live
Cash to close
- Down payment
- $49,975
- Closing costs
- $5,997
- Reserves months
- —
- Total cash needed
- —
Loan-product check · same deal, 3 products live
Conventional
25% down · 7.5% · 30yr
- Down + closing
- —
- Monthly P&I
- —
- Monthly cashflow
- —
- DSCR
- —
- Eligible?
- —
Personal DTI + credit; lowest rate.
DSCR
20% down · 8.5% · 30yr
- Down + closing
- —
- Monthly P&I
- —
- Monthly cashflow
- —
- DSCR
- —
- Eligible?
- —
No personal income docs; deal must DSCR.
Hard money
10% down · 12.0% · 12mo
- Down + closing
- —
- Monthly P&I
- —
- Monthly cashflow
- —
- DSCR
- —
- Eligible?
- —
Short-term bridge; refi at stabilization.
Listing history 14 events
-
2026-05-22status Pending
-
2026-05-20$199,900 Active
-
2021-10-11historical
-
2016-12-07soldstatus
-
2016-11-28soldstatus 297-char remark
Show marketing remark (297 chars)
This is a DOLL HOUSE, located on very private 1.5 ac lot with a large back yard enclosed in privacy fence and a storage building. Home features beautiful flooring, 2 large BRs and 1 Bath downstairs, 1 BR and bath up and a large open bonus room! Beautiful French doors open to a large private deck.
-
2016-09-30$98,500 297-char remark
Show marketing remark (297 chars)
This is a DOLL HOUSE, located on very private 1.5 ac lot with a large back yard enclosed in privacy fence and a storage building. Home features beautiful flooring, 2 large BRs and 1 Bath downstairs, 1 BR and bath up and a large open bonus room! Beautiful French doors open to a large private deck.
-
2013-10-18soldstatus
-
2013-09-25soldstatus
-
2013-04-05$54,900
-
2013-03-13historical
-
2012-03-18$75,000
-
2008-10-03$129,900
-
2006-05-31soldstatus
-
2006-01-16$120,000
ⓘ Source: listings_history table (triggers on properties + properties_extension) + one-shot
backfill from property_details.listing_events for pre-trigger history.
Tax reassessment forecast MS · Resets to sale price
- Current annual tax
- $833 · $69/mo
- Projected year-2 tax
- $1,579 · $132/mo
- Expected delta
- +$746/yr (+$62/mo · 89.6%)
ⓘ Screening estimate from a state-policy table — verify with the county assessor before closing.
Climate risk First Street
- Flood 1/10 Low FEMA zone X (unshaded) · 0% chance over 30 yrs
- Wildfire 5/10 Major
- Heat 6/10 Major 7 d/yr ≥108°F today · 21 d/yr by 30 yrs out
- Wind 4/10 Moderate 20% chance of damaging wind over 30 yrs
- Air quality 2/10 Low 2 unhealthy d/yr today · 2 by 30 yrs out
Nearby sold comps map
Loading sold comps map…
Walkable amenities ~0.75 mi
Loading nearby amenities…
Taxation est. · year 1
- Rental income
- $18,094
- − Mortgage interest
- −$11,198
- − Property taxes
- −$833
- − Insurance
- −$1,000
- − Repairs & maintenance
- −$1,448
- − Management
- −$1,448
- − Depreciation
- −$5,815
- Taxable loss
- −$3,646
- Est. tax savings @ 24.0%
- +$875
- After-tax cash flow
- $757/yr
For passive investors: Depreciation is non-cash, so a rental often shows a tax loss while cash-flowing — sheltering income. Rental losses are passive: they offset passive income freely, and up to $25,000/yr can offset ordinary (W-2) income if you actively participate and your MAGI is under $100k (phasing out to $0 by $150k); unused losses carry forward. On sale, claimed depreciation is recaptured at up to 25%, and gains may owe capital-gains tax (a 1031 exchange can defer both). Figures are a year-1 estimate at your 24.0% rate — not tax advice; consult a CPA.
Schools (NCES district)
- District
- Marshall County School District
- NCES district ID
- 2802850
- Math proficiency
- 18% ▼ -14.00%
- Reading proficiency
- 25% ▼ -8.00%
- Median HH income
- $39,333
- Composite
- 18.11/100
- National rank
- #8970
- State rank
- #87 of 130 in MS
Livability — Byhalia
- Score
- 60/100
- State rank
- #218
- US rank
- #18927
Category grades
Schools grade is shown separately in the Schools card above.
Census & demographics
- City population
- 16,751
- Population (ZIP)
- 16,751
Population outlook (Marshall County) Hauer SSP2
- Today (2025)
- 33,542 people
- By 2030
- 31,983 · -4.6%
- By 2040
- 28,556 · -14.9%
- By 2050
- 25,352 · -24.4%
- By 2075
- 20,032 · -40.3%
- By 2100
- 16,738 · -50.1%
Race, ethnicity, and origin ACS 2023
- Neighborhood character
- Majority White (61%)
- Race & ethnicity
- White 61% Black 27% Hispanic / Latino 9% Two or more races 2%
- Hispanic origin (detail)
- Mexican 8%
- Common ancestry
- Serbian 2% Italian 2% Slovak 1%
- Foreign-born
- 4% · Canada
- Languages at home
- 90% English-only · Spanish 10%
Political lean MEDSL · Marshall
- 2024 margin
- Lean R (+7.3) · D 46.0% · R 53.2%
- 2008→2024 swing
- -25.5pp toward R · 2008: 18.2pp · 2024: -7.3pp
- All cycles
- 2024: R+7.3 2020: D+3.1 2016: D+9.7 2012: D+19.4 2008: D+18.2
Not yet ingested
- Civics
- —
Market trends
- HPI YoY
- ▼ -28.38%
- Current HPI
- 212.021
- Rent YoY
- —
- Metro
- —
- State GDP YoY
- —
- F500 in state
- 0
Price history
+66.6% since first listed14 events — show timeline
- 2026-05-22 Pending — MLSU
- 2026-05-20 Listed $199,900 MLSU
- 2021-10-11 Listing Removed — MLSU
- 2016-12-07 Sold (Public Records) — Public Records
- 2016-11-28 Sold (MLS) — MLSU
- 2016-09-30 Listed $98,500 MLSU
- 2013-10-18 Sold (Public Records) — Public Records
- 2013-09-25 Sold (MLS) — MLSU
- 2013-04-05 Listed $54,900 MLSU
- 2013-03-13 Listing Removed — MLSU
- 2012-03-18 Listed $75,000 MLSU
- 2008-10-03 Listed $129,900 MLSU
- 2006-05-31 Sold (MLS) — MLSU
- 2006-01-16 Listed $120,000 MLSU
Property tax history
-4.3%/yrLatest (2025): $833 · +18.0% YoY. Source: county tax records.
Cash-flow waterfall
monthlySold comps — $/sqft
last 12 mo · ≤1 miLoading sold comps…