 Triplex
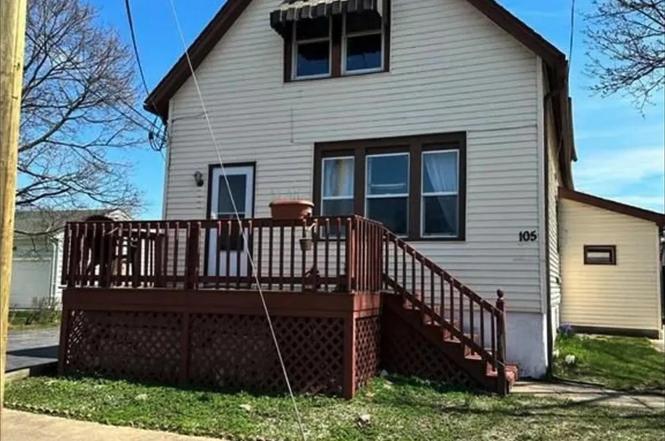
105 Griffith St · Sloan, NY
Flood risk 3/10 · Minor
- FEMA flood zone
- X (unshaded)
- Chance of flooding over 30 yrs
- 0.1%
- Est. flood insurance / yr
- $473 – $860
Fire risk 1/10 · Minimal
- Est. fire insurance / yr
- $691 – $1,283
Heat risk 3/10 · Minor
- Hot days now (above 92°F)
- 7 days/yr
- Hot days in 30 yrs
- 15 days/yr
Wind risk 1/10 · Minimal
- Chance of severe wind over 30 yrs
- —
Air-quality risk 3/10 · Minor
- Unhealthy air days now
- 2 days/yr
- Unhealthy air days in 30 yrs
- 3 days/yr
Risk factors via First Street. Map © Google.
Why this score? — see what drove the B grade
The composite is a weighted blend of 9 inputs, each scored 0–100. Each bar is that input's sub-score; the figure is the points it added to the 100-point composite (weight × sub-score).
- Cash flow +30.0/30.0
- 1% rule +10.0/10.0
- DSCR +10.0/10.0
- Appreciation +10.0/10.0
- Livability +3.8/5.0
- Schools +3.0/10.0
- ARV discount +2.6/15.0
- Rent growth +2.5/5.0
- Condition / age +2.5/5.0
$228,000
🖨 Deal sheet 📄 Offer letter ✓ Due diligence
Multi-family units
County records classify this as Multi-Family (2-4 Unit). Listing-text estimate: 3 units. confirmed
Listing remarks
Investors check out this hard to find 3 unit to add to your portfolio with a double lot & driveway for onsite parking and a 2 car garage. Appliances stay in each apartment. Front is a nice 2 bedroom w/ eat-in kitchen & living room w/ newer floors, rear lower unit is a studio and upper is a 2 bedroom with large eat-in kitchen & living room. The property is currently rented delivering immediate income. Close to all neighborhood amenities, Sloan Market, a neighborhood park, Galleria Mall, many restaurants and stores. This multi-family home combines space, functionality, and cash-flow. A great opportunity to own a solid income-producing property in a great neighborhood.
Key facts
- Double lot
- Eat-in kitchen
- Multi-family home
Tags
Neighborhood map
What this means for you Summary
Snapshot
- This is a 3 × 5-bed/3.0-bath units multifamily listed at $228k.
Deal economics
- At list price, monthly cash flow is $2k ($20k/yr) — positive. Per door: $563/mo.
- The deal already cash-flows at list — no discount required.
- Meets the 1% rule at list price ($4k rent vs $228k).
- Recommended offer: $221k (3.0% below list) — sets the bar for market timing.
- Cap rate 15.2% vs local median 5.7% in Sloan — top-decile yield for the area; either an underpriced asset or a hidden risk that comps aren't pricing in. Stress-test before assuming the spread holds.
Location & tenants
- Location reads 76/100 on livability (#215 in NY, #3,348 nationally) — a middle-class / working-renter tenant base. Strengths: cost of living A+, housing A+, health & safety A+; Watch: employment C-, schools D-, amenities F.
- Cheektowaga-Sloan Union Free School District (urban): math 33% / reading 38% proficiency, ranked #555 of 590 in NY (top 94%) — families likely to look elsewhere, expect single-tenant / working-renter base with shorter leases.
- Market conditions: 83 active listings in the ZIP; 1,244 units permitted in Erie County in 2024 (563 in 5+ unit buildings).
Forward outlook
- In year one you build about $24k of equity ($2k loan paydown + $23k appreciation (10.0% local appreciation)).
- At projected returns (10.0% appreciation + 3.0% rent growth), your $64k cash investment doubles in ~2 years — after that, you're playing with house money.
- By year 2, paydown + projected appreciation supports a ~$39k cash-out refi (75% LTV) — recoverable capital for the next deal without selling this one.
Negotiation context
- It's been on market 50 days — a 3% lower offer ($221k) is reasonable based on typical stale-listing flexibility.
- Current owner paid $110k; list at $228k implies a 107% gain — meaningful room to come down on a strong offer.
Risks & watch-outs
- Watch-outs: built in 1900 — expect roof / HVAC / electrical / plumbing capex.
Questions for the listing agent
- It's been on market 50 days. Have you received any prior offers? Is the seller open to a 3% concession, seller financing, or rate buy-down credit?
- Can we see the unit-by-unit rent roll, current vacancy, and any below-market leases? What's the average tenancy length?
- What capital expenditures (roof, boiler, parking lot, exteriors) have been made in the last 5 years, and what's planned in the next 2?
- Built in 1900 — when were the roof, HVAC, electrical panel, plumbing, and water heater last replaced?
- Is there a deadline driving the sale (1031 exchange, divorce, estate, relocation)? That informs how much negotiation room exists.
- Schools are D-rated, which usually means shorter tenancies and higher turnover. Who's the typical renter profile here, and what's been the actual vacancy rate?
- What's the average days-on-market for RENTAL listings here right now (not sales)? A rising rental-DOM trend means longer vacancies and softer asking-rent achievability than the comps imply.
- What's the recent tenant-quality profile in this submarket — average credit score on applications, eviction rate, late-payment / NSF rate, and stable-employment percentage? A property-management company in the area should have these aggregated.
- How much new apartment / multifamily construction is in the pipeline within 1–3 miles? Heavy new supply (>2% of stock underway) typically softens rents 12–24 months out; light construction supports rent growth.
Investment metrics
- 1% rule
- 1.88% ✓
- Cap rate
- 15.18%
- Cash-on-cash
- 31.74%
- DSCR
- 2.41
- GRM
- 4.4
CMA / ARV
- ARV (on-the-fly)
- $205,434
- Comps found
- 12
Show comp detail 12 sales within ~0.75 mi
| Address | Dist | Beds/Ba | Sqft | Sold | Price | $/sf | Match |
|---|---|---|---|---|---|---|---|
| 2279 Broadway St | 0.40mi | 6/2.0 | 1,875 (-8%) | 2mo | $207,000 | $110 | 63 |
| 188 Crocker St | 0.29mi | 5/2.0 (-1) | 1,895 (-7%) | 4mo | $227,000 | $120 | 63 |
| 236 Crocker St | 0.38mi | 5/3.0 (-1) | 2,240 (+10%) | 2mo | $212,500 | $95 | 59 |
| 8 Wagner Ave | 0.53mi | 5/3.0 (-1) | 2,149 (+6%) | 2mo | $205,000 | $95 | 59 |
| 2067 Broadway St | 0.48mi | 6/3.0 | 1,970 (-3%) | 16mo | $172,000 | $87 | 59 |
| 213 Boll St | 0.24mi | 5/2.0 (-1) | 2,244 (+10%) | 5mo | $275,000 | $123 | 58 |
| 313 Reiman St | 0.32mi | 5/2.0 (-1) | 2,016 (-1%) | 23mo | $260,000 | $129 | 56 |
| 121 Schiller St | 0.60mi | 6/2.0 | 2,000 (-2%) | 12mo | $157,000 | $79 | 55 |
| 103 Goethe St | 0.57mi | 5/2.0 (-1) | 2,024 (-0%) | 15mo | $140,000 | $69 | 51 |
| 351 Gold St | 0.66mi | 6/2.0 | 1,997 (-2%) | 22mo | $150,000 | $75 | 44 |
| 55 N Ogden St Unit E | 0.74mi | 6/2.0 | 2,184 (+7%) | 14mo | $220,000 | $101 | 38 |
| 361 Ludington St | 0.64mi | 6/2.5 | 2,209 (+9%) | 21mo | $258,000 | $117 | 36 |
Match score weights: distance 35% · size 25% · config 20% · recency 20%. Top-matched comps best support the ARV.
Projected returns pro-forma
10.0% appreciation · 3.0% rent growth · sell at horizon
- IRR
- 48.5%
- Equity multiple
- 4.63×
- Total profit
- $231,858
- Equity at exit
- $205,400
- IRR
- 42.3%
- Equity multiple
- 10.37×
- Total profit
- $598,485
- Equity at exit
- $442,954
Cash invested: $63,840 (down + closing). Projections, not guarantees.
Landlord ↔ Tenant lean methodology
- Overall (STATE)
- 15 Strongly Tenant-Friendly
- State New York
- 15 Strongly Tenant-Friendly · D+10
- County
- — inherits STATE
- City
- — inherits STATE
ZIP-level market 14212
- Home prices YoY
- 20.4%
- Active inventory
- 83
- Price-to-rent
- 13.3×
Monthly cashflow live
- Estimated rent
- $4,283 medium interval (Pro) →
- Mortgage (P&I)
- −$1,196
- Tax from tax record
- −$404 /mo · $4,852/yr
- Insurance
- −$95
- HOA
- −$0
- Vacancy / Maint / Mgmt
- −$899
- Net cashflow
- $1,689
Break-even live
3-unit breakdown (identical units grouped — click to expand)
| Units | Beds | Baths | Est. rent |
|---|---|---|---|
| 3× units | 5 | 3 | $4,284 |
| #1 | 5 | 3 | $1,428 |
| #2 | 5 | 3 | $1,428 |
| #3 | 5 | 3 | $1,428 |
| Total (3 units) | $4,283 | ||
UW: 25.0% down · 7.5% · 30yr · 1.5% tax · 5.0% vac · 8.0% maint · 8.0% mgmt
Financing live
Cash to close
- Down payment
- $57,000
- Closing costs
- $6,840
- Reserves months
- —
- Total cash needed
- —
Loan-product check · same deal, 3 products live
Conventional
25% down · 7.5% · 30yr
- Down + closing
- —
- Monthly P&I
- —
- Monthly cashflow
- —
- DSCR
- —
- Eligible?
- —
Personal DTI + credit; lowest rate.
DSCR
20% down · 8.5% · 30yr
- Down + closing
- —
- Monthly P&I
- —
- Monthly cashflow
- —
- DSCR
- —
- Eligible?
- —
No personal income docs; deal must DSCR.
Hard money
10% down · 12.0% · 12mo
- Down + closing
- —
- Monthly P&I
- —
- Monthly cashflow
- —
- DSCR
- —
- Eligible?
- —
Short-term bridge; refi at stabilization.
Listing history 5 events
-
2026-04-15status Pending
-
2026-03-28price $228,000
-
2026-03-17price $230,000
-
2026-02-24$232,000 Active
-
2018-09-26soldstatus $110,000
ⓘ Source: listings_history table (triggers on properties + properties_extension) + one-shot
backfill from property_details.listing_events for pre-trigger history.
Tax reassessment forecast NY · Partial reset (capped growth)
- Current annual tax
- $4,852 · $404/mo
- Projected year-2 tax
- $4,852 · $404/mo
- Expected delta
- $0/yr ($0/mo · 0.0%)
ⓘ Screening estimate from a state-policy table — verify with the county assessor before closing.
Climate risk First Street
- Flood 3/10 Moderate FEMA zone X (unshaded) · 10% chance over 30 yrs
- Wildfire 1/10 Low
- Heat 3/10 Moderate 7 d/yr ≥92°F today · 15 d/yr by 30 yrs out
- Wind 1/10 Low
- Air quality 3/10 Moderate 2 unhealthy d/yr today · 3 by 30 yrs out
Nearby sold comps map
Loading sold comps map…
Walkable amenities ~0.75 mi
Loading nearby amenities…
Taxation est. · year 1
- Rental income
- $51,396
- − Mortgage interest
- −$12,772
- − Property taxes
- −$4,852
- − Insurance
- −$1,140
- − Repairs & maintenance
- −$4,112
- − Management
- −$4,112
- − Depreciation
- −$6,633
- Taxable income
- $17,776
- Est. tax owed @ 24.0%
- −$4,266
- After-tax cash flow
- $15,996/yr
For passive investors: Depreciation is non-cash, so a rental often shows a tax loss while cash-flowing — sheltering income. Rental losses are passive: they offset passive income freely, and up to $25,000/yr can offset ordinary (W-2) income if you actively participate and your MAGI is under $100k (phasing out to $0 by $150k); unused losses carry forward. On sale, claimed depreciation is recaptured at up to 25%, and gains may owe capital-gains tax (a 1031 exchange can defer both). Figures are a year-1 estimate at your 24.0% rate — not tax advice; consult a CPA.
Schools (NCES district)
- District
- Cheektowaga-Sloan Union Free School District
- NCES district ID
- 3627000
- Math proficiency
- 33% ▼ -16.00%
- Reading proficiency
- 38% ▼ -6.00%
- Median HH income
- $45,810
- Composite
- 30.35/100
- National rank
- #6263
- State rank
- #555 of 590 in NY
Livability — Sloan
- Score
- 76/100
- State rank
- #215
- US rank
- #3348
Category grades
Schools grade is shown separately in the Schools card above.
Census & demographics
- Census place
- Sloan, NY
- Population (ZIP)
- 13,603
Population outlook (Erie County) Hauer SSP2
- Today (2025)
- 933,037 people
- By 2030
- 935,181 · +0.2%
- By 2040
- 928,531 · -0.5%
- By 2050
- 905,725 · -2.9%
- By 2075
- 834,037 · -10.6%
- By 2100
- 708,033 · -24.1%
Race, ethnicity, and origin ACS 2023
- Neighborhood character
- Highly diverse neighborhood (Simpson 0.75)
- Race & ethnicity
- White 32% Black 27% Asian 25% Hispanic / Latino 9% Two or more races 8%
- Hispanic origin (detail)
- Puerto Rican 8%
- Common ancestry
- Romanian 12% Serbian 1% Lithuanian 1%
- Foreign-born
- 20% · Philippines, Canada, China
- Languages at home
- 68% English-only · Other Indo-European 18% Spanish 4% Other Asian/Pacific 2%
Political lean MEDSL · Erie
- 2024 margin
- Lean D (+9.7) · D 54.8% · R 45.2%
- 2008→2024 swing
- -7.9pp toward R · 2008: 17.5pp · 2024: 9.7pp
- All cycles
- 2024: D+9.7 2020: D+14.7 2016: D+4.8 2012: D+15.6 2008: D+17.5
Not yet ingested
- Civics
- —
Market trends
- HPI YoY
- ▲ 79.80%
- Current HPI
- 471.6399
- Rent YoY
- —
- Metro
- —
- State GDP YoY
- ▲ 2.60%
- F500 in state
- 92
Industry mix (Fortune 500 HQ in NY)
| Industry | F500 HQs | Revenue |
|---|---|---|
| Financial Services | 10 | $950B |
|
||
| Consumer Goods | 9 | $162B |
|
||
| Insurance | 4 | $225B |
|
||
| Telecommunications | 2 | $144B |
|
||
| Pharmaceuticals | 2 | $112B |
|
||
| Media / Entertainment | 2 | $69B |
|
||
Price history
+107.3% since first listed5 events — show timeline
- 2026-04-15 Pending — WNYREIS
- 2026-03-28 Price Changed $228,000 WNYREIS
- 2026-03-17 Price Changed $230,000 WNYREIS
- 2026-02-24 Listed $232,000 WNYREIS
- 2018-09-26 Sold (Public Records) $110,000 Public Records
Property tax history
+2.5%/yrLatest (2025): $4,852 · +0.9% YoY. Source: county tax records.
Cash-flow waterfall
monthlySold comps — $/sqft
last 12 mo · ≤1 miLoading sold comps…