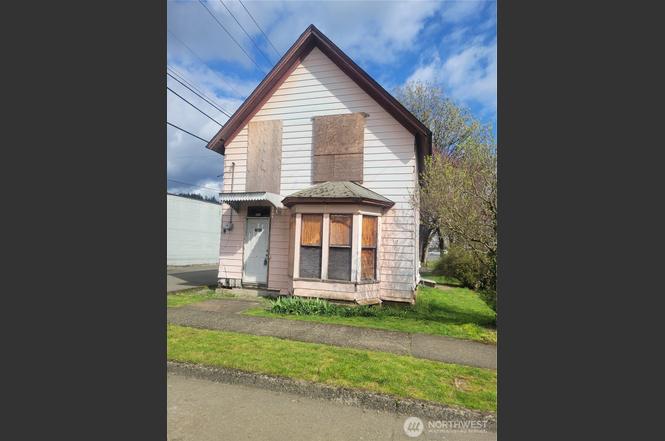
218 S 2nd St · Shelton, WA
Flood risk 7/10 · Major
- FEMA flood zone
- AE
- Chance of flooding over 30 yrs
- 0.99%
- Est. flood insurance / yr
- $1,737 – $8,500
Fire risk 3/10 · Minor
- Est. fire insurance / yr
- $604 – $1,122
Heat risk 3/10 · Minor
- Hot days now (above 88°F)
- 7 days/yr
- Hot days in 30 yrs
- 15 days/yr
Wind risk 1/10 · Minimal
- Chance of severe wind over 30 yrs
- —
Air-quality risk 7/10 · Major
- Unhealthy air days now
- 9 days/yr
- Unhealthy air days in 30 yrs
- 10 days/yr
Risk factors via First Street. Map © Google.
Why this score? — see what drove the C grade
The composite is a weighted blend of 9 inputs, each scored 0–100. Each bar is that input's sub-score; the figure is the points it added to the 100-point composite (weight × sub-score).
- Cash flow +25.2/30.0
- DSCR +8.3/10.0
- ARV discount +7.5/15.0
- 1% rule +5.4/10.0
- Livability +3.7/5.0
- Schools +3.4/10.0
- Rent growth +2.5/5.0
- Condition / age +2.5/5.0
- Appreciation +0.0/10.0
$165,000
🖨 Deal sheet 📄 Offer letter ✓ Due diligence
Listing remarks
Residential or commercially zoned. Good downtown location for a live work space. This 3 bedroom 1.75 bath home will need a remodel. Foundation completed recently. Room behind the home to build a garage or additional living space.
Key facts
- Live work space
- Downtown location
- Foundation completed
Tags
Property features AI
Finance
- Other: Lot size approximately 0.0826 acres; Zoning: City
- Financial info: Listing terms: Cash
- HOA & community: Community features include nearby park and playground; Bus line nearby
Exterior
- Parking: Off-street parking; no garage
- Security: Partially fenced yard
- Utilities: Public water; Sewer connected; Electric power
- Home design: Single-family residence, two-story house; Built on lot; Main level entry; Faces west; Property condition: fair
- Construction: Cement construction materials; Composition roof; Concrete ribbon foundation; Built on lot
- Exterior features: Cement/concrete exterior; Partially fenced lot; Alley access with curbs, paved streets and sidewalks; Level topography
Interior
- Kitchen: Kitchen with eating space (on main level)
- Bedrooms: 3 bedrooms (all on the second floor)
- Flooring: Softwood flooring; Vinyl flooring
- Bathrooms: One full bathroom (main level); One three-quarter bathroom (upper level); Includes 1 bathtub and 1 shower
- Heating & cooling: No heating; No cooling; Electric energy source
- Interior features: Water heater; No basement; Partially fenced (security feature)
- Laundry & utility: Electric water heater located in upstairs bathroom
Neighborhood map
What this means for you Summary
Snapshot
- This is a 2-bed/1.0-bath single-family listed at $165k.
Deal economics
- At list price, monthly cash flow is $-57 ($-690/yr) — negative.
- To cash-flow at today's rent, offer at most $155k (6.2% below list).
- Meets the 1% rule at list price ($2k rent vs $165k).
- Recommended offer: $150k (9.0% below list) — sets the bar for market timing.
- Cap rate 9.0% vs local median 3.1% in Shelton — top-decile yield for the area; either an underpriced asset or a hidden risk that comps aren't pricing in. Stress-test before assuming the spread holds.
Location & tenants
- Location reads 73/100 on livability (#203 in WA) — a middle-class / working-renter tenant base. Strengths: housing A+, health & safety A+, amenities A-; Watch: employment D+, crime F, commute F.
- Shelton School District (town): math 31% / reading 43% proficiency, ranked #237 of 291 in WA (top 81%) — families likely to look elsewhere, expect single-tenant / working-renter base with shorter leases.
- Zoned schools: Evergreen Elementary School (429 students, 86% FRL); Shelton High School (1,473 students, 62% FRL) — zoned schools average 74% FRL vs 59% district-wide (16 pts higher); higher-poverty schools than district average — tighter screening recommended.
- Market conditions: 439 active listings in the ZIP; solid renter incomes; 299 units permitted in Mason County in 2024 (0 in 5+ unit buildings).
Forward outlook
- Local home prices are declining (-3.0%/yr); year-one equity from $1k of loan paydown is wiped out by about $5k of value loss. Plan a longer hold.
- Mason County population projected at -14% by 2050 — secular population decline; favor cash flow + early exit over multi-decade hold.
Negotiation context
- It's been on market 98 days — a 9% lower offer ($150k) is reasonable based on typical stale-listing flexibility.
- 3 sale attempts since 15y ago with the ask held roughly flat each time — persistent listings suggest the price (not the market) is what's stuck; bring a comps-based counter.
- Current owner paid $35k; list at $165k implies a 371% gain — meaningful room to come down on a strong offer.
Risks & watch-outs
- Watch-outs: flood insurance adds $427/mo; built in 1893 — expect roof / HVAC / electrical / plumbing capex.
- Climate carrying-cost: in FEMA flood zone AE (mandatory federal flood insurance) — expect insurance premiums to compound above CPI over the hold.
Questions for the listing agent
- What do current leases actually rent for vs. the listed asking? Can we see a recent rent roll and the last 12 months of T-12 income?
- It's been on market 98 days. Have you received any prior offers? Is the seller open to a 9% concession, seller financing, or rate buy-down credit?
- Built in 1893 — when were the roof, HVAC, electrical panel, plumbing, and water heater last replaced?
- What's the actual annual flood-insurance premium (NFIP or private), and is the property in a SFHA with mandatory coverage?
- Why hasn't it sold? Are there any deal-killer items the seller is aware of (foundation, flood, title, zoning, code violations)?
- Is there a deadline driving the sale (1031 exchange, divorce, estate, relocation)? That informs how much negotiation room exists.
- Schools are D-rated, which usually means shorter tenancies and higher turnover. Who's the typical renter profile here, and what's been the actual vacancy rate?
- Crime grade is F in this area — have there been break-ins, vandalism, or insurance claims at this property in the last 3 years? What carrier currently insures it and at what premium?
- What's the average days-on-market for RENTAL listings here right now (not sales)? A rising rental-DOM trend means longer vacancies and softer asking-rent achievability than the comps imply.
- What's the recent tenant-quality profile in this submarket — average credit score on applications, eviction rate, late-payment / NSF rate, and stable-employment percentage? A property-management company in the area should have these aggregated.
- How much new for-sale + rental construction is in the pipeline within 1–3 miles? Heavy new supply typically softens prices + rents 12–24 months out; constrained supply supports both.
Investment metrics
- 1% rule
- 1.04% ✓
- Cap rate
- 8.98%
- Cash-on-cash
- 9.59%
- DSCR
- 1.43
- GRM
- 8.0
CMA / ARV
- ARV (on-the-fly)
- $390,240
- Comps found
- 12
Show comp detail 12 sales within ~0.75 mi
| Address | Dist | Beds/Ba | Sqft | Sold | Price | $/sf | Match |
|---|---|---|---|---|---|---|---|
| 414 W Wyandotte Ave | 0.56mi | 3/2.0 (+1) | 1,325 (-2%) | 7mo | $369,500 | $279 | 55 |
| 607 S 14th St | 0.75mi | 3/1.5 (+1) | 1,338 (-1%) | 1mo | $367,000 | $274 | 55 |
| 903 Kineo Ave | 0.63mi | 2/1.0 | 1,220 (-10%) | 9mo | $315,000 | $258 | 47 |
| 447 Chestnut St | 0.62mi | 3/2.0 (+1) | 1,496 (+10%) | 0mo | $420,000 | $281 | 44 |
| 1226 W Birch St | 0.73mi | 3/2.0 (+1) | 1,266 (-7%) | 2mo | $399,000 | $315 | 44 |
| 722 718 W Franklin St | 0.36mi | 3/2.0 (+1) | 1,156 (-15%) | 8mo | $220,000 | $190 | 43 |
| 429 Chestnut St | 0.61mi | 3/2.0 (+1) | 1,246 (-8%) | 8mo | $402,500 | $323 | 42 |
| 40 E Sylvan Heights Ln | 0.66mi | 3/2.0 (+1) | 1,225 (-10%) | 4mo | $390,000 | $318 | 41 |
| 645 Ellinor Ave | 0.72mi | 2/1.0 | 1,164 (-14%) | 3mo | $335,000 | $288 | 41 |
| 420 W University Ave | 0.75mi | 3/2.0 (+1) | 1,452 (+7%) | 9mo | $425,000 | $293 | 36 |
| 605 W Euclid Ave | 0.57mi | 3/2.0 (+1) | 1,556 (+15%) | 6mo | $380,000 | $244 | 35 |
| 20 E Tall Timber Ln | 0.68mi | 3/2.0 (+1) | 1,530 (+13%) | 5mo | $499,000 | $326 | 34 |
Match score weights: distance 35% · size 25% · config 20% · recency 20%. Top-matched comps best support the ARV.
Projected returns pro-forma
-3.0% appreciation · 3.0% rent growth · sell at horizon
- IRR
- -18.6%
- Equity multiple
- 0.35×
- Total profit
- $-30,203
- Equity at exit
- $24,602
- IRR
- -10.7%
- Equity multiple
- 0.35×
- Total profit
- $-30,220
- Equity at exit
- $14,266
Cash invested: $46,200 (down + closing). Projections, not guarantees.
Landlord ↔ Tenant lean methodology
- Overall (STATE)
- 28 Tenant-Leaning
- State Washington
- 28 Tenant-Leaning · D+8
- County
- — inherits STATE
- City
- — inherits STATE
ZIP-level market 98584
- Active inventory
- 439
- Price-to-rent
- 8.0×
Monthly cashflow live
- Estimated rent
- $1,721 medium interval (Pro) →
- Mortgage (P&I)
- −$865
- Tax from tax record
- −$56 /mo · $674/yr
- Insurance
- −$69
- Flood insurance flood zone
- −$427 /mo · $5,118/yr
- HOA
- −$0
- Vacancy / Maint / Mgmt
- −$361
- Net cashflow
- $-57
Break-even live
UW: 25.0% down · 7.5% · 30yr · 1.5% tax · 5.0% vac · 8.0% maint · 8.0% mgmt
Financing live
Cash to close
- Down payment
- $41,250
- Closing costs
- $4,950
- Reserves months
- —
- Total cash needed
- —
Loan-product check · same deal, 3 products live
Conventional
25% down · 7.5% · 30yr
- Down + closing
- —
- Monthly P&I
- —
- Monthly cashflow
- —
- DSCR
- —
- Eligible?
- —
Personal DTI + credit; lowest rate.
DSCR
20% down · 8.5% · 30yr
- Down + closing
- —
- Monthly P&I
- —
- Monthly cashflow
- —
- DSCR
- —
- Eligible?
- —
No personal income docs; deal must DSCR.
Hard money
10% down · 12.0% · 12mo
- Down + closing
- —
- Monthly P&I
- —
- Monthly cashflow
- —
- DSCR
- —
- Eligible?
- —
Short-term bridge; refi at stabilization.
Listing history 23 events
-
2026-06-19days on market $165,000 Active 98 DOM
-
2026-06-18days on market $165,000 Active 97 DOM
-
2026-06-17days on market $165,000 Active 96 DOM
-
2026-06-16days on market $165,000 Active 95 DOM
-
2026-06-15days on market $165,000 Active 94 DOM
-
2026-06-14days on market $165,000 Active 92 DOM
-
2026-06-12days on market $165,000 Active 91 DOM
-
2026-06-09days on market $165,000 Active 88 DOM
-
2026-06-08days on market $165,000 Active 87 DOM
-
2026-06-07days on market $165,000 Active 86 DOM
-
2026-06-02days on market $165,000 Active 81 DOM
-
2026-06-01days on market $165,000 Active 80 DOM
-
2026-05-31days on market $165,000 Active 79 DOM
-
2026-05-30days on market $165,000 Active 78 DOM
-
2026-03-13$165,000 Active
-
2013-04-02historical
-
2013-04-01soldstatus $35,000 Sold
-
2013-03-29soldstatus $35,000
-
2012-06-18price $39,900
-
2012-03-02status Active
-
2012-02-26status Pending Inspection
-
2012-02-18price $45,000
-
2011-05-18$59,000 Active
ⓘ Source: listings_history table (triggers on properties + properties_extension) + one-shot
backfill from property_details.listing_events for pre-trigger history.
Tax reassessment forecast WA · Resets to sale price
- Current annual tax
- $674 · $56/mo
- Projected year-2 tax
- $1,617 · $135/mo
- Expected delta
- +$943/yr (+$79/mo · 139.8%)
ⓘ Screening estimate from a state-policy table — verify with the county assessor before closing.
Climate risk First Street
- Flood 7/10 Severe FEMA zone AE · 99% chance over 30 yrs
- Wildfire 3/10 Moderate
- Heat 3/10 Moderate 7 d/yr ≥88°F today · 15 d/yr by 30 yrs out
- Wind 1/10 Low
- Air quality 7/10 Severe 9 unhealthy d/yr today · 10 by 30 yrs out
Nearby sold comps map
Loading sold comps map…
Walkable amenities ~0.75 mi
Loading nearby amenities…
Taxation est. · year 1
- Rental income
- $20,647
- − Mortgage interest
- −$9,243
- − Property taxes
- −$674
- − Insurance
- −$5,944
- − Repairs & maintenance
- −$1,652
- − Management
- −$1,652
- − Depreciation
- −$4,800
- Taxable loss
- −$3,317
- Est. tax savings @ 24.0%
- +$796
- After-tax cash flow
- $106/yr
For passive investors: Depreciation is non-cash, so a rental often shows a tax loss while cash-flowing — sheltering income. Rental losses are passive: they offset passive income freely, and up to $25,000/yr can offset ordinary (W-2) income if you actively participate and your MAGI is under $100k (phasing out to $0 by $150k); unused losses carry forward. On sale, claimed depreciation is recaptured at up to 25%, and gains may owe capital-gains tax (a 1031 exchange can defer both). Figures are a year-1 estimate at your 24.0% rate — not tax advice; consult a CPA.
Schools (NCES district)
- District
- Shelton School District
- NCES district ID
- 5307900
- Math proficiency
- 31% ▼ -1.00%
- Reading proficiency
- 43% ▼ -3.00%
- Median HH income
- $45,467
- Composite
- 34.1/100
- National rank
- #10288
- State rank
- #237 of 291 in WA
Livability — Shelton
- Score
- 73/100
- State rank
- #203
- US rank
- #5586
Category grades
Schools grade is shown separately in the Schools card above.
Census & demographics
- Census place
- Shelton, WA
- County
- Mason County · 40,606 people
- City population
- 40,606
- Metro
- Shelton, WA
- Population (ZIP)
- 40,606
- Household income
- $78,610
- Rent vs Own
- Severe rent burden
- 687.0
Population outlook (Mason County) Hauer SSP2
- Today (2025)
- 60,005 people
- By 2030
- 58,567 · -2.4%
- By 2040
- 54,735 · -8.8%
- By 2050
- 51,470 · -14.2%
- By 2075
- 46,276 · -22.9%
- By 2100
- 39,883 · -33.5%
Race, ethnicity, and origin ACS 2023
- Neighborhood character
- Predominantly White (72%)
- Race & ethnicity
- White 72% Hispanic / Latino 15% Two or more races 11% Native American 3%
- Hispanic origin (detail)
- Mexican 8%
- Common ancestry
- Portuguese 4% Slovak 3% Italian 2%
- Foreign-born
- 8% · Canada
- Languages at home
- 88% English-only · Spanish 10%
Political lean MEDSL · Mason
- 2024 margin
- Toss-up / Even · D 47.2% · R 49.7% · Other 3.2%
- 2008→2024 swing
- -11.2pp toward R · 2008: 8.7pp · 2024: -2.5pp
- All cycles
- 2024: R+2.5 2020: R+3.9 2016: R+6.0 2012: D+6.9 2008: D+8.7
Not yet ingested
- Civics
- —
Market trends
- HPI YoY
- ▼ -232.42%
- Current HPI
- 199.0698
- Rent YoY
- —
- Metro
- Shelton, WA
- State GDP YoY
- ▲ 4.65%
- F500 in state
- 22
Industry mix (Fortune 500 HQ in WA)
| Industry | F500 HQs | Revenue |
|---|---|---|
| Retail | 2 | $269B |
|
||
| Technology / Retail | 1 | $638B |
|
||
| Technology | 1 | $245B |
|
||
| Telecommunications | 1 | $38B |
|
||
| Food / Beverage | 1 | $36B |
|
||
| Automotive / Trucks | 1 | $34B |
|
||
Price history
+179.7% since first listed9 events — show timeline
- 2026-03-13 Listed $165,000 NWMLS as Distributed by MLS Grid
- 2013-04-02 Delisted — NWMLS as Distributed by MLS Grid
- 2013-04-01 Sold (MLS) $35,000 NWMLS as Distributed by MLS Grid
- 2013-03-29 Sold (Public Records) $35,000 Public Records
- 2012-06-18 Price Changed $39,900 NWMLS as Distributed by MLS Grid
- 2012-03-02 Relisted — NWMLS as Distributed by MLS Grid
- 2012-02-26 Pending — NWMLS as Distributed by MLS Grid
- 2012-02-18 Price Changed $45,000 NWMLS as Distributed by MLS Grid
- 2011-05-18 Listed $59,000 NWMLS as Distributed by MLS Grid
Property tax history
-1.7%/yrLatest (2026): $674 · -29.2% YoY. Source: county tax records.
Cash-flow waterfall
monthlySold comps — $/sqft
last 12 mo · ≤1 miLoading sold comps…