1757 Edeline Ave · McKinleyville, CA
Flood risk 1/10 · Minimal
- FEMA flood zone
- X (unshaded)
- Chance of flooding over 30 yrs
- 0.0%
- Est. flood insurance / yr
- $507 – $1,088
Fire risk 1/10 · Minimal
- Est. fire insurance / yr
- $659 – $1,223
Heat risk 1/10 · Minimal
- Hot days now (above 71°F)
- 8 days/yr
- Hot days in 30 yrs
- 22 days/yr
Wind risk 1/10 · Minimal
- Chance of severe wind over 30 yrs
- —
Air-quality risk 6/10 · Moderate
- Unhealthy air days now
- 9 days/yr
- Unhealthy air days in 30 yrs
- 9 days/yr
Risk factors via First Street. Map © Google.
Why this score? — see what drove the C- grade
The composite is a weighted blend of 9 inputs, each scored 0–100. Each bar is that input's sub-score; the figure is the points it added to the 100-point composite (weight × sub-score).
- Cash flow +16.1/30.0
- ARV discount +15.0/15.0
- DSCR +5.0/10.0
- 1% rule +3.5/10.0
- Schools +3.5/10.0
- Livability +2.6/5.0
- Rent growth +2.5/5.0
- Condition / age +2.5/5.0
- Appreciation +0.0/10.0
$239,000
🖨 Deal sheet (PDF) 📄 Offer letter ✓ Due diligence
Listing remarks
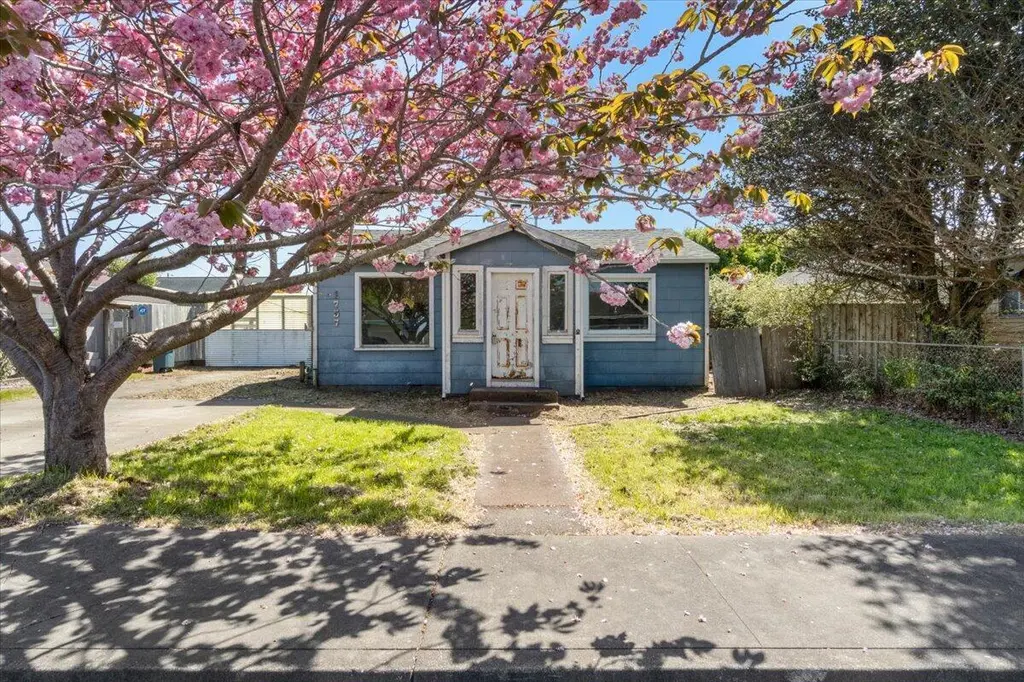
Excellent location just a few doors away from newer homes and Central Estates Subdivision, this adorable Coastal home has a newer roof, beautiful flat lot with a big backyard and a gorgeous welcoming cherry tree in the front yard to greet you. This home has a great floorplan with both a family room, and living room, 3 bedrooms, and a full bath that also has access to the primary bedroom. Centrally located, there are new homes and subdivisions a block away in 3 directions, within 10 minutes from Cal Poly Humboldt, and easy access to town, walking/biking paths, but off the main street in a low traffic location.
Key facts
- Big backyard
- Cherry tree
- Living room
Tags
Property features AI
Finance
- Other: Property listed by Forbes & Associates - Eric Cecchin
Exterior
- Parking: RV access/parking
- Utilities: Public water; Public sewer; Electricity connected with circuit breakers; Natural gas connected/available
- Home design: Single family residence; One story
- Construction: Frame construction; Shingle roof; Concrete perimeter foundation; Slab foundation; Built on a 0.13-acre lot; Zoned for single family
- Exterior features: Partial fencing; Level lot; Concrete road access, publicly maintained
Interior
- Heating & cooling: Wall furnace; Has heating
- Interior features: Wood burning stove; Five total rooms
Neighborhood map
What this means for you Summary
Snapshot
- This is a 3-bed/1.0-bath single-family listed at $239k.
Deal economics
- At list price, monthly cash flow is $122 ($1k/yr) — positive.
- The deal already cash-flows at list — no discount required.
- To meet the 1% rule (rent ≥ 1% of price), the offer needs to be $203k (15.1% below list).
- Recommended offer: $203k (15.1% below list) — sets the bar for 1% rule.
- Cap rate 6.9% vs local median 2.8% in McKinleyville — top-decile yield for the area; either an underpriced asset or a hidden risk that comps aren't pricing in. Stress-test before assuming the spread holds.
Location & tenants
- Location reads 52/100 on livability (#1,028 in CA) — a working-class tenant base; expect higher turnover. Watch: employment C-, health & safety C-, crime F.
- Mckinleyville Union Elementary (town): math 34% / reading 42% proficiency, ranked #789 of 1,400 in CA (top 56%) — families likely to look elsewhere, expect single-tenant / working-renter base with shorter leases.
- Zoned schools: Morris Elementary (292 students, 59% FRL); Mckinleyville Middle (360 students, 54% FRL); Mckinleyville High (math 10% / reading 50%, grade F, #723 of 1,170 statewide, top 64%, 556 students, 51% FRL).
- Market conditions: 98 active listings in the ZIP; 1 comparable units currently listed for rent nearby; 188 units permitted in Humboldt County in 2024 (17 in 5+ unit buildings).
- This rent runs 33% of the median local income ($73k/yr) — at the standard rent-burdened threshold; future hikes will face affordability resistance.
Forward outlook
- Local home prices are declining (-3.0%/yr); year-one equity from $2k of loan paydown is wiped out by about $7k of value loss. Plan a longer hold.
- Humboldt County population projected to shrink 4% by 2050 — rents likely to lag national; underwrite the cash flow, not the appreciation.
Negotiation context
- It's been on market 35 days — a 3% lower offer ($232k) is reasonable based on typical stale-listing flexibility.
Risks & watch-outs
- Watch-outs: built in 1954 — expect roof / HVAC / electrical / plumbing capex.
Questions for the listing agent
- It's been on market 35 days. Have you received any prior offers? Is the seller open to a 15% concession, seller financing, or rate buy-down credit?
- Built in 1954 — when were the roof, HVAC, electrical panel, plumbing, and water heater last replaced?
- Is there a deadline driving the sale (1031 exchange, divorce, estate, relocation)? That informs how much negotiation room exists.
- Schools are D-rated, which usually means shorter tenancies and higher turnover. Who's the typical renter profile here, and what's been the actual vacancy rate?
- Crime grade is F in this area — have there been break-ins, vandalism, or insurance claims at this property in the last 3 years? What carrier currently insures it and at what premium?
- What's the average days-on-market for RENTAL listings here right now (not sales)? A rising rental-DOM trend means longer vacancies and softer asking-rent achievability than the comps imply.
- What's the recent tenant-quality profile in this submarket — average credit score on applications, eviction rate, late-payment / NSF rate, and stable-employment percentage? A property-management company in the area should have these aggregated.
- How much new for-sale + rental construction is in the pipeline within 1–3 miles? Heavy new supply typically softens prices + rents 12–24 months out; constrained supply supports both.
Investment metrics
- 1% rule
- 0.85% ✗
- Cap rate
- 6.91%
- Cash-on-cash
- 2.19%
- DSCR
- 1.10
- GRM
- 9.8
CMA / ARV
- ARV (on-the-fly)
- $412,972
- Comps found
- 12
Show comp detail 12 sales within ~0.75 mi
| Address | Dist | Beds/Ba | Sqft | Sold | Price | $/sf | Match |
|---|---|---|---|---|---|---|---|
| 1938 Sagewood Way | 0.24mi | 3/2.0 | 1,203 (-0%) | 1mo | $405,000 | $337 | 84 |
| 1345 Worth Ave | 0.08mi | 3/1.0 | 1,100 (-9%) | 4mo | $190,000 | $173 | 78 |
| 1936 Arbor Way | 0.14mi | 3/2.0 | 1,163 (-3%) | 7mo | $390,000 | $335 | 78 |
| 1779 Oakdale Dr | 0.15mi | 3/2.0 | 1,269 (+5%) | 6mo | $415,000 | $327 | 74 |
| 1305 Hedge Rose Ct | 0.26mi | 3/2.0 | 1,332 (+11%) | 5mo | $499,000 | $375 | 62 |
| 2099 Silkwood St | 0.55mi | 3/2.0 | 1,240 (+3%) | 6mo | $425,000 | $343 | 61 |
| 1760 Sitka Ct | 0.44mi | 3/2.0 | 1,336 (+11%) | 1mo | $525,000 | $393 | 56 |
| 1291 Railroad Dr | 0.57mi | 2/2.0 (-1) | 1,264 (+5%) | 2mo | $480,000 | $380 | 55 |
| 1932 Mckinleyville Ave | 0.37mi | 3/2.0 | 1,040 (-14%) | 2mo | $420,000 | $404 | 54 |
| 1905 Juniper Ave | 0.61mi | 3/2.0 | 1,324 (+10%) | 7mo | $425,000 | $321 | 45 |
| 2070 Thiel Ave | 0.65mi | 3/2.0 | 1,080 (-10%) | 7mo | $392,000 | $363 | 43 |
| 1015 Oakwood Ct | 0.73mi | 4/2.0 (+1) | 1,302 (+8%) | 2mo | $422,000 | $324 | 42 |
Match score weights: distance 35% · size 25% · config 20% · recency 20%. Top-matched comps best support the ARV.
Projected returns pro-forma
-3.0% appreciation · 3.0% rent growth · sell at horizon
- IRR
- -12.9%
- Equity multiple
- 0.54×
- Total profit
- $-31,017
- Equity at exit
- $35,636
- IRR
- -3.9%
- Equity multiple
- 0.74×
- Total profit
- $-17,288
- Equity at exit
- $20,664
Cash invested: $66,920 (down + closing). Projections, not guarantees.
Landlord ↔ Tenant lean methodology
- Overall (STATE)
- 18 Strongly Tenant-Friendly
- State California
- 18 Strongly Tenant-Friendly · D+13
- County
- — inherits STATE
- City
- — inherits STATE
ZIP-level market 95519
- Active inventory
- 98
- Price-to-rent
- 9.8×
Monthly cashflow live
- Estimated rent
- $2,028 medium interval (Pro) →
- Mortgage (P&I)
- −$1,253
- Tax from tax record
- −$127 /mo · $1,525/yr
- Insurance
- −$100
- HOA
- −$0
- Vacancy / Maint / Mgmt
- −$426
- Net cashflow
- $122
Break-even live
Sensitivity live
| Price | -10% $258 | -5% $190 | +0% $122 | +5% $55 | +10% $-13 |
|---|---|---|---|---|---|
| Rent | -10% $-38 | -5% $42 | +0% $122 | +5% $202 | +10% $282 |
| Rate | -1.0pp $243 | -0.5pp $183 | base $122 | +0.5pp $60 | +1.0pp $-3 |
UW: 25.0% down · 7.5% · 30yr · 1.5% tax · 5.0% vac · 8.0% maint · 8.0% mgmt
Financing live
Cash to close
- Down payment
- $59,750
- Closing costs
- $7,170
- Reserves months
- —
- Total cash needed
- —
Loan-product check · same deal, 3 products live
Conventional
25% down · 7.5% · 30yr
- Down + closing
- —
- Monthly P&I
- —
- Monthly cashflow
- —
- DSCR
- —
- Eligible?
- —
Personal DTI + credit; lowest rate.
DSCR
20% down · 8.5% · 30yr
- Down + closing
- —
- Monthly P&I
- —
- Monthly cashflow
- —
- DSCR
- —
- Eligible?
- —
No personal income docs; deal must DSCR.
Hard money
10% down · 12.0% · 12mo
- Down + closing
- —
- Monthly P&I
- —
- Monthly cashflow
- —
- DSCR
- —
- Eligible?
- —
Short-term bridge; refi at stabilization.
Rent comps 1 comps
| Address | Beds | Baths | Sqft | Rent | $/sqft | DOM | Units | Dist |
|---|---|---|---|---|---|---|---|---|
| 2345 Bates Ln Unit 3 McKinleyville, CA | 2.0 | 1.0 | 840 | $1,400 | $1.67 | 45d | 1 | 0.84mi |
Listing history 13 events
-
2026-06-21days on market $239,000 Active 35 DOM
-
2026-06-19days on market $239,000 Active 33 DOM
-
2026-06-18days on market $239,000 Active 32 DOM
-
2026-06-17days on market $239,000 Active 31 DOM
-
2026-06-16days on market $239,000 Active 30 DOM
-
2026-06-15days on market $239,000 Active 29 DOM
-
2026-06-14days on market $239,000 Active 27 DOM
-
2026-06-13days on market $239,000 Active 26 DOM
-
2026-06-10days on market $239,000 Active 24 DOM
-
2026-06-09days on market $239,000 Active 23 DOM
-
2026-06-09status $239,000 Active 22 DOM
-
2026-06-03remarks 616-char remark
-
2026-05-01$239,000 Active
ⓘ Source: listings_history table (triggers on properties + properties_extension) + one-shot
backfill from property_details.listing_events for pre-trigger history.
Tax reassessment forecast CA · Resets to sale price
- Current annual tax
- $1,525 · $127/mo
- Projected year-2 tax
- $1,816 · $151/mo
- Expected delta
- +$291/yr (+$24/mo · 19.1%)
ⓘ Screening estimate from a state-policy table — verify with the county assessor before closing.
Climate risk First Street
- Flood 1/10 Low FEMA zone X (unshaded) · 0% chance over 30 yrs
- Wildfire 1/10 Low
- Heat 1/10 Low 8 d/yr ≥71°F today · 22 d/yr by 30 yrs out
- Wind 1/10 Low
- Air quality 6/10 Major 9 unhealthy d/yr today · 9 by 30 yrs out
Nearby sold comps map
Loading sold comps map…
Walkable amenities ~0.75 mi
Loading nearby amenities…
Taxation est. · year 1
- Rental income
- $24,338
- − Mortgage interest
- −$13,388
- − Property taxes
- −$1,525
- − Insurance
- −$1,195
- − Repairs & maintenance
- −$1,947
- − Management
- −$1,947
- − Depreciation
- −$6,953
- Taxable loss
- −$2,616
- Est. tax savings @ 24.0%
- +$628
- After-tax cash flow
- $2,095/yr
For passive investors: Depreciation is non-cash, so a rental often shows a tax loss while cash-flowing — sheltering income. Rental losses are passive: they offset passive income freely, and up to $25,000/yr can offset ordinary (W-2) income if you actively participate and your MAGI is under $100k (phasing out to $0 by $150k); unused losses carry forward. On sale, claimed depreciation is recaptured at up to 25%, and gains may owe capital-gains tax (a 1031 exchange can defer both). Figures are a year-1 estimate at your 24.0% rate — not tax advice; consult a CPA.
Schools (NCES district)
- District
- Mckinleyville Union Elementary
- NCES district ID
- 0624300
- Math proficiency
- 34% ▲ 2.00%
- Reading proficiency
- 42% ▲ 4.00%
- Median HH income
- $48,399
- Composite
- 35.18/100
- National rank
- #9872
- State rank
- #789 of 1400 in CA
Livability — McKinleyville
- Score
- 52/100
- State rank
- #1028
- US rank
- #25015
Category grades
Schools grade is shown separately in the Schools card above.
Census & demographics
- Census place
- McKinleyville, CA
- County
- Humboldt County · 88,652 people
- City population
- 18,728
- Metro
- Eureka-Arcata, CA
- Population (ZIP)
- 18,728
- Household income
- $73,280
- Rent vs Own
- Severe rent burden
- 730.0
Population outlook (Humboldt County) Hauer SSP2
- Today (2025)
- 135,550 people
- By 2030
- 134,798 · -0.6%
- By 2040
- 132,222 · -2.5%
- By 2050
- 130,850 · -3.5%
- By 2075
- 128,656 · -5.1%
- By 2100
- 120,238 · -11.3%
Race, ethnicity, and origin ACS 2023
- Neighborhood character
- Predominantly White (72%)
- Race & ethnicity
- White 72% Two or more races 14% Hispanic / Latino 11% Native American 4% Asian 3%
- Hispanic origin (detail)
- Mexican 8%
- Common ancestry
- Slovak 3% Serbian 3% Lithuanian 3%
- Foreign-born
- 4% · Canada, China
- Languages at home
- 94% English-only · Spanish 4% Other Indo-European 1%
Political lean MEDSL · Humboldt
- 2024 margin
- Strong D (+28.4) · D 62.0% · R 33.6% · Other 4.5%
- 2008→2024 swing
- +0.2pp no change · 2008: 28.2pp · 2024: 28.4pp
- All cycles
- 2024: D+28.4 2020: D+33.4 2016: D+25.9 2012: D+26.2 2008: D+28.2
Not yet ingested
- Civics
- —
Market trends
- HPI YoY
- ▼ -385.83%
- Current HPI
- 197.0133
- Rent YoY
- —
- Metro
- Eureka-Arcata, CA
- State GDP YoY
- ▲ 3.21%
- F500 in state
- 116
Industry mix (Fortune 500 HQ in CA)
| Industry | F500 HQs | Revenue |
|---|---|---|
| Technology | 27 | $1,492B |
|
||
| Financial Services | 3 | $174B |
|
||
| Retail | 3 | $44B |
|
||
| Insurance | 3 | $26B |
|
||
| Media / Entertainment | 2 | $115B |
|
||
| Pharmaceuticals / Biotech | 2 | $62B |
|
||
Price history
1 event — show timeline
- 2026-05-01 Listed $239,000 HAR
Property tax history
+3.0%/yrLatest (2025): $1,525 · +5.3% YoY. Source: county tax records.
Cash-flow waterfall
monthlySold comps — $/sqft
last 12 mo · ≤1 miLoading sold comps…