3039 Going to The Sun St · Sebring, FL
Flood risk 1/10 · Minimal
- FEMA flood zone
- X (unshaded)
- Chance of flooding over 30 yrs
- 0.0%
- Est. flood insurance / yr
- $507 – $1,088
Fire risk 5/10 · Moderate
- Est. fire insurance / yr
- $947 – $1,759
Heat risk 8/10 · Major
- Hot days now (above 108°F)
- 7 days/yr
- Hot days in 30 yrs
- 25 days/yr
Wind risk 9/10 · Severe
- Chance of severe wind over 30 yrs
- 99.0%
Air-quality risk 2/10 · Minimal
- Unhealthy air days now
- 2 days/yr
- Unhealthy air days in 30 yrs
- 2 days/yr
Risk factors via First Street. Map © Google.
Why this score? — see what drove the B+ grade
The composite is a weighted blend of 9 inputs, each scored 0–100. Each bar is that input's sub-score; the figure is the points it added to the 100-point composite (weight × sub-score).
- Cash flow +30.0/30.0
- ARV discount +15.0/15.0
- DSCR +10.0/10.0
- 1% rule +9.8/10.0
- Schools +3.6/10.0
- Livability +3.3/5.0
- Rent growth +2.9/5.0
- Condition / age +2.5/5.0
- Appreciation +0.0/10.0
$108,900
🖨 Deal sheet 📄 Offer letter ✓ Due diligence
Listing remarks
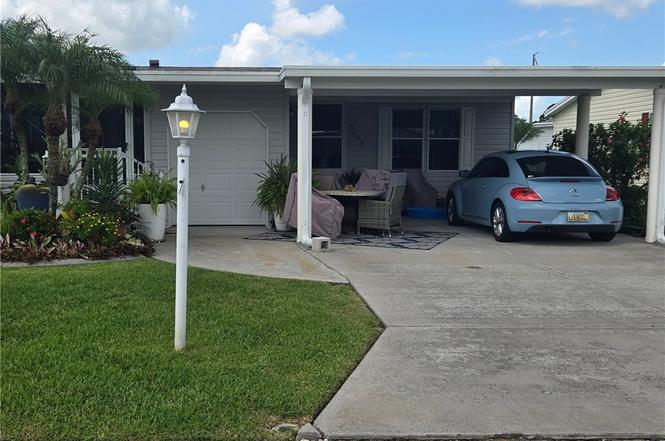
Resort style living at its finest. State of the art amenities here are endless. Clubhouse with unlimited activities such as dinner events, concerts, card games and workout gym and more. Tennis and shuffleboard might be appealing to you or just relaxing in the pool. Either way you will have lots to do in this community. The Home has a new roof in 2022 and the refrigerator is new within the last year per seller. There is laminate and vinyl flooring throughout the home. The patio furniture on the screen room and front patio stay with the home. Master bedroom furniture stays with the home as well. Monthly lot rent is $985 and includes trash pickup in front of the home twice weekly and all park
Key facts
- Laminate flooring
- Vinyl flooring
- New refrigerator
Tags
Property features AI
Finance
- Other: Property is in a mobile home park (Tanglewood Home Ame)
- Financial info: Land is leased (land lease $985/month)
- HOA & community: Clubhouse; Fitness center; Senior community
Exterior
- Parking: 2 parking spaces; Driveway; Golf cart garage; On-street parking
- Utilities: Public water; Public sewer; Cable available
- Home design: Manufactured in-park home (double wide); One level; Vinyl siding; Frame construction
- Construction: Metal and shingle roof
- Exterior features: Screened porch; Side porch; Community pool (community access); Paved road access; Pets allowed
Interior
- Flooring: Carpet; Vinyl
- Bathrooms: 2 full bathrooms
- Heating & cooling: Central electric heating; Central electric cooling
- Interior features: Ceiling fans; High-speed internet; Blinds
Neighborhood map
What this means for you Summary
Snapshot
- This is a 2-bed/2.0-bath manufactured listed at $109k.
Deal economics
- At list price, monthly cash flow is $524 ($6k/yr) — positive.
- The deal already cash-flows at list — no discount required.
- Meets the 1% rule at list price ($2k rent vs $109k).
- Recommended offer: $96k (12.0% below list) — sets the bar for market timing.
- Cap rate 12.1% vs local median 4.3% in Sebring — top-decile yield for the area; either an underpriced asset or a hidden risk that comps aren't pricing in. Stress-test before assuming the spread holds.
Location & tenants
- Location reads 66/100 on livability (#618 in FL) — a middle-class / working-renter tenant base. Strengths: cost of living A+, housing A+, health & safety A; Watch: amenities F, commute F, employment F.
- Highlands (other): math 45% / reading 43% proficiency, ranked #54 of 73 in FL (top 74%) — families likely to look elsewhere, expect single-tenant / working-renter base with shorter leases; 68% free/reduced lunch — lower-income household profile, screen leases tightly.
- Zoned schools: Sebring Middle School (math 52% / reading 40%, grade D+, #300 of 571 statewide, top 53%, 815 students, 64% FRL); Sebring High School (math 32% / reading 48%, grade F, #296 of 667 statewide, top 45%, 1,809 students, 56% FRL).
- Market conditions: Rents rising (+1.6%/yr); 700 active listings in the ZIP; 980 units permitted in Highlands County in 2024 (80 in 5+ unit buildings).
Forward outlook
- Local home prices are declining (-3.0%/yr); year-one equity from $753 of loan paydown is wiped out by about $3k of value loss. Plan a longer hold.
- At projected returns (-3.0% appreciation + 1.6% rent growth), your $30k cash investment doubles in ~7 years — after that, you're playing with house money.
Negotiation context
- It's been on market 356 days — a 12% lower offer ($96k) is reasonable based on typical stale-listing flexibility.
- 2 sale attempts; this cycle's ask has dropped $6k (5%) from the opening price — seller is motivated, your offer sets the floor, not the list.
Risks & watch-outs
- Climate carrying-cost: severe wind risk, 99% chance of damaging wind over 30y; moderate wildfire risk; extreme-heat days projected 7→25/yr by 2055 (HVAC capex compounding) — expect insurance premiums to compound above CPI over the hold.
Questions for the listing agent
- It's been on market 356 days. Have you received any prior offers? Is the seller open to a 12% concession, seller financing, or rate buy-down credit?
- Why hasn't it sold? Are there any deal-killer items the seller is aware of (foundation, flood, title, zoning, code violations)?
- Is there a deadline driving the sale (1031 exchange, divorce, estate, relocation)? That informs how much negotiation room exists.
- Schools are D-rated, which usually means shorter tenancies and higher turnover. Who's the typical renter profile here, and what's been the actual vacancy rate?
- What's the average days-on-market for RENTAL listings here right now (not sales)? A rising rental-DOM trend means longer vacancies and softer asking-rent achievability than the comps imply.
- What's the recent tenant-quality profile in this submarket — average credit score on applications, eviction rate, late-payment / NSF rate, and stable-employment percentage? A property-management company in the area should have these aggregated.
- How much new for-sale + rental construction is in the pipeline within 1–3 miles? Heavy new supply typically softens prices + rents 12–24 months out; constrained supply supports both.
Investment metrics
- 1% rule
- 1.48% ✓
- Cap rate
- 12.07%
- Cash-on-cash
- 20.62%
- DSCR
- 1.92
- GRM
- 5.6
CMA / ARV
- ARV (on-the-fly)
- $151,524
- Comps found
- 12
Show comp detail 12 sales within ~0.75 mi
| Address | Dist | Beds/Ba | Sqft | Sold | Price | $/sf | Match |
|---|---|---|---|---|---|---|---|
| 3353 Delaware Ave | 0.37mi | 3/2.0 (+1) | 1,200 (-3%) | 3mo | $160,000 | $133 | 70 |
| 3510 Delaware Ave | 0.30mi | 2/2.0 | 1,152 (-7%) | 8mo | $130,000 | $113 | 68 |
| 3352 Delaware Ave | 0.37mi | 2/2.0 | 1,300 (+5%) | 14mo | $157,000 | $121 | 63 |
| 3446 Michigan Ave | 0.34mi | 2/2.0 | 1,124 (-10%) | 8mo | $120,000 | $107 | 62 |
| 2317 Georgia St | 0.22mi | 2/2.0 | 1,080 (-13%) | 8mo | $150,000 | $139 | 61 |
| 3527 Delaware Ave | 0.28mi | 2/2.0 | 1,152 (-7%) | 21mo | $85,000 | $74 | 57 |
| 2556 Georgia St | 0.35mi | 2/2.0 | 1,396 (+12%) | 11mo | $172,000 | $123 | 54 |
| 3248 Fairmount Dr | 0.44mi | 2/2.0 | 1,056 (-15%) | 6mo | $140,000 | $133 | 49 |
| 2349 Georgia St | 0.24mi | 3/1.5 (+1) | 1,086 (-13%) | 17mo | $133,000 | $122 | 46 |
| 2602 Georgia St | 0.37mi | 2/2.0 | 1,056 (-15%) | 14mo | $178,000 | $169 | 46 |
| 3201 New York Ave | 0.49mi | 3/2.0 (+1) | 1,344 (+8%) | 16mo | $150,000 | $112 | 45 |
| 3248 New York Ave | 0.44mi | 3/2.0 (+1) | 1,344 (+8%) | 21mo | $135,500 | $101 | 44 |
Match score weights: distance 35% · size 25% · config 20% · recency 20%. Top-matched comps best support the ARV.
Projected returns pro-forma
-3.0% appreciation · 1.65% rent growth · sell at horizon
- IRR
- 11.4%
- Equity multiple
- 1.45×
- Total profit
- $13,578
- Equity at exit
- $16,237
- IRR
- 19.3%
- Equity multiple
- 2.52×
- Total profit
- $46,238
- Equity at exit
- $9,416
Cash invested: $30,492 (down + closing). Projections, not guarantees.
Landlord ↔ Tenant lean methodology
- Overall (STATE)
- 87 Strongly Landlord-Friendly
- State Florida
- 87 Strongly Landlord-Friendly · R+3
- County
- — inherits STATE
- City
- — inherits STATE
ZIP-level market 33872
- Home prices YoY
- -25.8%
- Rents YoY
- 1.6%
- Active inventory
- 700
- Price-to-rent
- 5.6×
Monthly cashflow live
- Estimated rent
- $1,616 medium interval (Pro) →
- Mortgage (P&I)
- −$571
- Tax est. 1.5%
- −$136 /mo · $1,634/yr
- Insurance
- −$45
- HOA
- −$0
- Vacancy / Maint / Mgmt
- −$339
- Net cashflow
- $524
Break-even live
UW: 25.0% down · 7.5% · 30yr · 1.5% tax · 5.0% vac · 8.0% maint · 8.0% mgmt
Financing live
Cash to close
- Down payment
- $27,225
- Closing costs
- $3,267
- Reserves months
- —
- Total cash needed
- —
Loan-product check · same deal, 3 products live
Conventional
25% down · 7.5% · 30yr
- Down + closing
- —
- Monthly P&I
- —
- Monthly cashflow
- —
- DSCR
- —
- Eligible?
- —
Personal DTI + credit; lowest rate.
DSCR
20% down · 8.5% · 30yr
- Down + closing
- —
- Monthly P&I
- —
- Monthly cashflow
- —
- DSCR
- —
- Eligible?
- —
No personal income docs; deal must DSCR.
Hard money
10% down · 12.0% · 12mo
- Down + closing
- —
- Monthly P&I
- —
- Monthly cashflow
- —
- DSCR
- —
- Eligible?
- —
Short-term bridge; refi at stabilization.
Listing history 19 events
-
2026-06-19days on market $108,900 Active 356 DOM
-
2026-06-18days on market $108,900 Active 355 DOM
-
2026-06-17days on market $108,900 Active 354 DOM
-
2026-06-16days on market $108,900 Active 353 DOM
-
2026-06-15days on market $108,900 Active 352 DOM
-
2026-06-14days on market $108,900 Active 350 DOM
-
2026-06-10days on market $108,900 Active 347 DOM
-
2026-06-09days on market $108,900 Active 346 DOM
-
2026-06-08days on market $108,900 Active 345 DOM
-
2026-06-07days on market $108,900 Active 344 DOM
-
2026-06-02days on market $108,900 Active 339 DOM
-
2026-06-01days on market $108,900 Active 338 DOM
-
2026-05-31days on market $108,900 Active 337 DOM
-
2026-05-30days on market $108,900 Active 336 DOM
-
2026-02-24price $108,900
-
2025-12-27status Active
-
2025-12-20historical
-
2025-08-23price $109,900
-
2025-06-19$115,000 Active
ⓘ Source: listings_history table (triggers on properties + properties_extension) + one-shot
backfill from property_details.listing_events for pre-trigger history.
Climate risk First Street
- Flood 1/10 Low FEMA zone X (unshaded) · 0% chance over 30 yrs
- Wildfire 5/10 Major
- Heat 8/10 Severe 7 d/yr ≥108°F today · 25 d/yr by 30 yrs out
- Wind 9/10 Extreme 99% chance of damaging wind over 30 yrs
- Air quality 2/10 Low 2 unhealthy d/yr today · 2 by 30 yrs out
Nearby sold comps map
Loading sold comps map…
Walkable amenities ~0.75 mi
Loading nearby amenities…
Taxation est. · year 1
- Rental income
- $19,389
- − Mortgage interest
- −$6,100
- − Property taxes
- −$1,634
- − Insurance
- −$544
- − Repairs & maintenance
- −$1,551
- − Management
- −$1,551
- − Depreciation
- −$3,168
- Taxable income
- $4,841
- Est. tax owed @ 24.0%
- −$1,162
- After-tax cash flow
- $5,125/yr
For passive investors: Depreciation is non-cash, so a rental often shows a tax loss while cash-flowing — sheltering income. Rental losses are passive: they offset passive income freely, and up to $25,000/yr can offset ordinary (W-2) income if you actively participate and your MAGI is under $100k (phasing out to $0 by $150k); unused losses carry forward. On sale, claimed depreciation is recaptured at up to 25%, and gains may owe capital-gains tax (a 1031 exchange can defer both). Figures are a year-1 estimate at your 24.0% rate — not tax advice; consult a CPA.
Schools (NCES district)
- District
- Highlands
- NCES district ID
- 1200840
- Math proficiency
- 45% ▼ -7.00%
- Reading proficiency
- 43% ▼ -3.00%
- Median HH income
- $35,276
- Composite
- 36.42/100
- National rank
- #4672
- State rank
- #54 of 73 in FL
Livability — Sebring
- Score
- 66/100
- State rank
- #618
- US rank
- #11992
Category grades
Schools grade is shown separately in the Schools card above.
Census & demographics
- County
- Highlands County · 98,898 people
- City population
- 50,797
- Metro
- Sebring-Avon Park, FL
- Population (ZIP)
- 13,746
- Household income
- $69,578
- Rent vs Own
- Severe rent burden
- 222.0
Population outlook (Highlands County) Hauer SSP2
- Today (2025)
- 99,674 people
- By 2030
- 99,615 · -0.1%
- By 2040
- 99,342 · -0.3%
- By 2050
- 98,242 · -1.4%
- By 2075
- 93,291 · -6.4%
- By 2100
- 79,894 · -19.8%
Race, ethnicity, and origin ACS 2023
- Neighborhood character
- Majority White (65%)
- Race & ethnicity
- White 65% Hispanic / Latino 22% Two or more races 11% Black 5% Asian 4% Native American 1%
- Hispanic origin (detail)
- Mexican 5% Puerto Rican 9% Cuban 3%
- Common ancestry
- Romanian 2% Russian 2% Slovak 2%
- Foreign-born
- 12% · Canada, Jamaica
- Languages at home
- 79% English-only · Spanish 16% Other Asian/Pacific 2% Other Indo-European 1%
Political lean MEDSL · Highlands
- 2024 margin
- Solid R (+40.8) · D 29.3% · R 70.1%
- 2008→2024 swing
- -22.7pp toward R · 2008: -18.1pp · 2024: -40.8pp
- All cycles
- 2024: R+40.8 2020: R+34.4 2016: R+32.0 2012: R+23.0 2008: R+18.1
Not yet ingested
- Civics
- —
Market trends
- HPI YoY
- ▼ -78.20%
- Current HPI
- 225.3761
- Rent YoY
- ▲ 1.65%
- Metro
- Sebring-Avon Park, FL
- State GDP YoY
- ▲ 3.28%
- F500 in state
- 36
Industry mix (Fortune 500 HQ in FL)
| Industry | F500 HQs | Revenue |
|---|---|---|
| Industrial Technology | 2 | $29B |
|
||
| Insurance | 2 | $17B |
|
||
| Retail | 1 | $60B |
|
||
| Technology Distribution | 1 | $58B |
|
||
| Homebuilding | 1 | $35B |
|
||
| Technology Manufacturing | 1 | $35B |
|
||
Price history
-5.3% since first listed5 events — show timeline
- 2026-02-24 Price Changed $108,900 HAOR as distributed by MLS GRID
- 2025-12-27 Relisted — HAOR as distributed by MLS GRID
- 2025-12-20 Delisted — HAOR as distributed by MLS GRID
- 2025-08-23 Price Changed $109,900 HAOR as distributed by MLS GRID
- 2025-06-19 Listed $115,000 HAOR as distributed by MLS GRID
Cash-flow waterfall
monthlySold comps — $/sqft
last 12 mo · ≤1 miLoading sold comps…