3374 Marlin Dr SE · Oak Island, NC
Flood risk 1/10 · Minimal
- FEMA flood zone
- X (unshaded)
- Chance of flooding over 30 yrs
- 0.0%
- Est. flood insurance / yr
- $507 – $1,088
Fire risk 4/10 · Minor
- Est. fire insurance / yr
- $906 – $1,684
Heat risk 9/10 · Severe
- Hot days now (above 103°F)
- 7 days/yr
- Hot days in 30 yrs
- 19 days/yr
Wind risk 9/10 · Severe
- Chance of severe wind over 30 yrs
- 99.0%
Air-quality risk 2/10 · Minimal
- Unhealthy air days now
- 1 days/yr
- Unhealthy air days in 30 yrs
- 1 days/yr
Risk factors via First Street. Map © Google.
Why this score? — see what drove the F grade
The composite is a weighted blend of 9 inputs, each scored 0–100. Each bar is that input's sub-score; the figure is the points it added to the 100-point composite (weight × sub-score).
- Cash flow +13.2/30.0
- DSCR +4.0/10.0
- Schools +3.9/10.0
- Livability +3.4/5.0
- 1% rule +2.9/10.0
- Rent growth +2.5/5.0
- Condition / age +2.5/5.0
- ARV discount +1.3/15.0
- Appreciation +0.0/10.0
$199,900
🖨 Deal sheet (PDF) 📄 Offer letter ✓ Due diligence
Listing remarks MLS
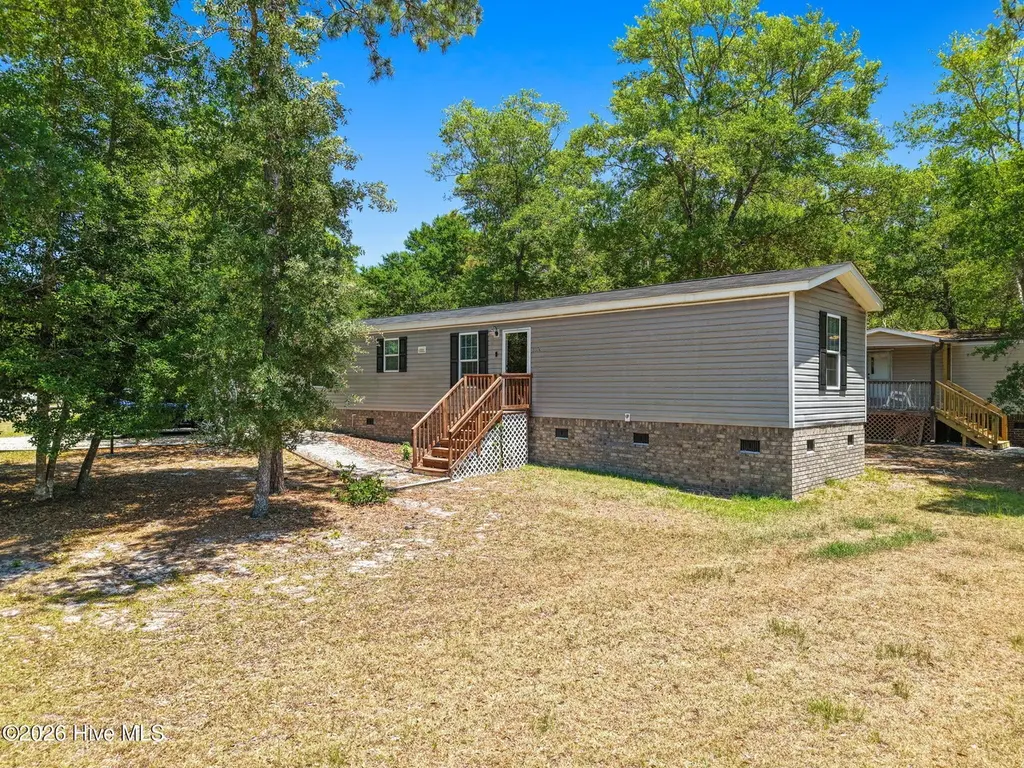
Welcome to your dream home in the gated community of River Run Plantation! This brand-new, 3-bedroom, 2-bathroom home was just completed in May 2023, offering modern features and a desirable open living floor plan. As you step inside, you'll be greeted by wood-look vinyl floors that flow seamlessly throughout the home, providing a warm and inviting atmosphere. The spacious living area is perfect for entertaining guests or enjoying quality time with family. The beautiful kitchen offers modern appliances, and stylish cabinetry. Additionally, the master bedroom boasts an en-suite bathroom and a walk-in closet, providing a private retreat within the home. Situated on a spacious corner lot, this property offers plenty of space for outdoor activities and showcases the mature trees that provide shade and a touch of natural beauty to the landscape. Living in River Run Plantation comes with a wealth of amenities. You'll have access to a boat ramp and boat storage, making it convenient for avid boaters and water enthusiasts. The large pool is perfect for relaxing on hot summer days, and the tennis and basketball courts offer opportunities for friendly competition and staying active. Fishing enthusiasts will be thrilled with the two large docks available for casting lines and reeling in memorable catches. With its desirable location, modern features, and exceptional community amenities, this home is sure to attract attention. Don't miss your chance to make this your forever home. Act quickly, as this gem won't stay on the market for long!''
Key facts
- Gated community
- Community pool
- Tennis courts
Tags
Property features AI
Finance
- Other: Subdivision: River Run Plantation
- HOA & community: Community pool; Street lights; Homeowners association with amenities including boat dock, gated entry, maintained grounds, park, storage and tennis courts; Annual association fee of $765 (about $63.75/month)
Exterior
- Parking: Gravel parking
- Security: Smoke detector(s)
- Utilities: Public water; Water connected; Septic tank
- Home design: Manufactured home; One level / single-story; Entry on level 1
- Construction: Brick veneer, vinyl siding and frame construction; Shingle roof; Crawl space foundation; Built as a manufactured home
- Exterior features: Porch; Corner lot; Wooded lot; Paved road access; Has a view; No pool
Interior
- Kitchen: Electric oven; Refrigerator; Dishwasher
- Bedrooms: Master bedroom located downstairs
- Flooring: Vinyl
- Bathrooms: 2 full bathrooms
- Heating & cooling: Electric heating; Heat pump; Central air; Whole house fan
- Interior features: Master suite on the main level; Walk-in closet(s); Window coverings; Unfurnished
- Laundry & utility: Washer hookup in hall; Electric water heater
Neighborhood map
What this means for you Summary
Snapshot
- This is a 3-bed/2.0-bath manufactured listed at $200k.
Deal economics
- At list price, monthly cash flow is $-4 ($-50/yr) — negative.
- To cash-flow at today's rent, offer at most $199k (0.4% below list).
- To meet the 1% rule (rent ≥ 1% of price), the offer needs to be $157k (21.5% below list).
- Recommended offer: $157k (21.5% below list) — sets the bar for 1% rule.
- Cap rate 6.3% vs local median 2.8% in Oak Island — top-decile yield for the area; either an underpriced asset or a hidden risk that comps aren't pricing in. Stress-test before assuming the spread holds.
Location & tenants
- Location reads 67/100 on livability (#233 in NC) — a middle-class / working-renter tenant base. Strengths: crime A+, housing A+, employment A; Watch: health & safety D, amenities F, commute F.
- Brunswick County Schools (rural): math 45% / reading 47% proficiency, ranked #82 of 178 in NC (top 46%) — families likely to look elsewhere, expect single-tenant / working-renter base with shorter leases.
- Zoned schools: Virginia Williamson Elem (math 50% / reading 49%, grade D, #417 of 1,410 statewide, top 32%, 502 students, 99% FRL); South Brunswick Middle (math 41% / reading 49%, grade D, #160 of 475 statewide, top 35%, 572 students, 100% FRL); South Brunswick High (math 62% / reading 57%, grade C+, #216 of 535 statewide, top 43%, 1,172 students, 100% FRL) — zoned schools average 100% FRL vs 53% district-wide (46 pts higher); higher-poverty schools than district average — tighter screening recommended.
- Market conditions: 575 active listings in the ZIP; 6,112 units permitted in Brunswick County in 2024 (990 in 5+ unit buildings).
Forward outlook
- Local home prices are declining (-3.0%/yr); year-one equity from $1k of loan paydown is wiped out by about $6k of value loss. Plan a longer hold.
- Brunswick County population projected at +36% by 2050 — long-run rental-demand tailwind backs the buy-and-hold thesis.
Negotiation context
- Only 8 days on market — expect competitive offers; lowballing is unlikely to land.
- 5 sale attempts since 4y ago with the ask held roughly flat each time — persistent listings suggest the price (not the market) is what's stuck; bring a comps-based counter.
Risks & watch-outs
- Climate carrying-cost: severe wind risk, 99% chance of damaging wind over 30y; extreme-heat days projected 7→19/yr by 2055 (HVAC capex compounding) — expect insurance premiums to compound above CPI over the hold.
Questions for the listing agent
- What do current leases actually rent for vs. the listed asking? Can we see a recent rent roll and the last 12 months of T-12 income?
- What does the HOA fee cover, when was the last increase, and are there any pending special assessments or reserve-fund shortfalls?
- Is there a deadline driving the sale (1031 exchange, divorce, estate, relocation)? That informs how much negotiation room exists.
- Schools are D-rated, which usually means shorter tenancies and higher turnover. Who's the typical renter profile here, and what's been the actual vacancy rate?
- The area grade is low — what's the realistic commute time and amenity access for the typical tenant pool here? Any planned neighborhood developments (good or bad) we should know about?
- What's the average days-on-market for RENTAL listings here right now (not sales)? A rising rental-DOM trend means longer vacancies and softer asking-rent achievability than the comps imply.
- What's the recent tenant-quality profile in this submarket — average credit score on applications, eviction rate, late-payment / NSF rate, and stable-employment percentage? A property-management company in the area should have these aggregated.
- How much new for-sale + rental construction is in the pipeline within 1–3 miles? Heavy new supply typically softens prices + rents 12–24 months out; constrained supply supports both.
Investment metrics
- 1% rule
- 0.79% ✗
- Cap rate
- 6.27%
- Cash-on-cash
- -0.09%
- DSCR
- 1.00
- GRM
- 10.6
CMA / ARV
- ARV (on-the-fly)
- $175,560
- Comps found
- 5
Show comp detail 5 sales within ~0.75 mi
| Address | Dist | Beds/Ba | Sqft | Sold | Price | $/sf | Match |
|---|---|---|---|---|---|---|---|
| 3477 Tarpon Ct SE | 0.20mi | 3/2.0 | 923 (-0%) | 1mo | $220,000 | $238 | 89 |
| 644 Harbor Dr SE | 0.36mi | 3/2.0 | 923 (-0%) | 3mo | $175,500 | $190 | 80 |
| 3440 Dolphin Dr | 0.15mi | 3/2.0 | 1,015 (+10%) | 1mo | $199,000 | $196 | 76 |
| 612 Bayshore Dr SE | 0.40mi | 3/2.0 | 924 (0%) | 6mo | $175,000 | $189 | 76 |
| 3517 Tarpon Ct SE | 0.28mi | 2/2.0 (-1) | 924 (0%) | 20mo | $160,000 | $173 | 65 |
Match score weights: distance 35% · size 25% · config 20% · recency 20%. Top-matched comps best support the ARV.
Projected returns pro-forma
-3.0% appreciation · 3.0% rent growth · sell at horizon
- IRR
- -16.5%
- Equity multiple
- 0.42×
- Total profit
- $-32,717
- Equity at exit
- $29,806
- IRR
- -8.3%
- Equity multiple
- 0.48×
- Total profit
- $-29,075
- Equity at exit
- $17,284
Cash invested: $55,972 (down + closing). Projections, not guarantees.
Landlord ↔ Tenant lean methodology
- Overall (STATE)
- 85 Strongly Landlord-Friendly
- State North Carolina
- 85 Strongly Landlord-Friendly · R+3
- County
- — inherits STATE
- City
- — inherits STATE
ZIP-level market 28422
- Home prices YoY
- -23.8%
- Active inventory
- 575
- Price-to-rent
- 10.6×
Monthly cashflow live
- Estimated rent
- $1,570 medium interval (Pro) →
- Mortgage (P&I)
- −$1,048
- Tax from tax record
- −$49 /mo · $584/yr
- Insurance
- −$83
- HOA
- −$64
- Lot rent leased land?
- −$0
- Vacancy / Maint / Mgmt
- −$330
- Net cashflow
- $-4
Break-even live
Sensitivity live
| Price | -10% $109 | -5% $52 | +0% $-4 | +5% $-61 | +10% $-117 |
|---|---|---|---|---|---|
| Rent | -10% $-128 | -5% $-66 | +0% $-4 | +5% $58 | +10% $120 |
| Rate | -1.0pp $97 | -0.5pp $47 | base $-4 | +0.5pp $-56 | +1.0pp $-109 |
UW: 25.0% down · 7.5% · 30yr · 1.5% tax · 5.0% vac · 8.0% maint · 8.0% mgmt
Financing live
Cash to close
- Down payment
- $49,975
- Closing costs
- $5,997
- Reserves months
- —
- Total cash needed
- —
Loan-product check · same deal, 3 products live
Conventional
25% down · 7.5% · 30yr
- Down + closing
- —
- Monthly P&I
- —
- Monthly cashflow
- —
- DSCR
- —
- Eligible?
- —
Personal DTI + credit; lowest rate.
DSCR
20% down · 8.5% · 30yr
- Down + closing
- —
- Monthly P&I
- —
- Monthly cashflow
- —
- DSCR
- —
- Eligible?
- —
No personal income docs; deal must DSCR.
Hard money
10% down · 12.0% · 12mo
- Down + closing
- —
- Monthly P&I
- —
- Monthly cashflow
- —
- DSCR
- —
- Eligible?
- —
Short-term bridge; refi at stabilization.
HOA detail
- Monthly dues
- $64 · $768/yr
- Likely covers
- waterpoolsecurity
Listing history 7 events
-
2026-06-22days on market $199,900 Active 8 DOM
-
2026-06-18days on market $199,900 Active 5 DOM
-
2026-06-17days on market $199,900 Active 4 DOM
-
2026-06-16days on market $199,900 Active 3 DOM
-
2026-06-15days on market $199,900 Active 2 DOM
-
2026-06-14remarks 699-char remark
-
2026-06-14$199,900 Active 1 DOM
ⓘ Source: listings_history table (triggers on properties + properties_extension) + one-shot
backfill from property_details.listing_events for pre-trigger history.
Tax reassessment forecast NC · Resets to sale price
- Current annual tax
- $584 · $49/mo
- Projected year-2 tax
- $1,639 · $137/mo
- Expected delta
- +$1,055/yr (+$88/mo · 180.8%)
ⓘ Screening estimate from a state-policy table — verify with the county assessor before closing.
Climate risk First Street
- Flood 1/10 Low FEMA zone X (unshaded) · 0% chance over 30 yrs
- Wildfire 4/10 Moderate
- Heat 9/10 Extreme 7 d/yr ≥103°F today · 19 d/yr by 30 yrs out
- Wind 9/10 Extreme 99% chance of damaging wind over 30 yrs
- Air quality 2/10 Low 1 unhealthy d/yr today · 1 by 30 yrs out
Nearby sold comps map
Loading sold comps map…
Walkable amenities ~0.75 mi
Loading nearby amenities…
Taxation est. · year 1
- Rental income
- $18,837
- − Mortgage interest
- −$11,198
- − Property taxes
- −$584
- − Insurance
- −$1,000
- − Repairs & maintenance
- −$1,507
- − Management
- −$1,507
- − HOA
- −$768
- − Depreciation
- −$5,815
- Taxable loss
- −$3,541
- Est. tax savings @ 24.0%
- +$850
- After-tax cash flow
- $800/yr
For passive investors: Depreciation is non-cash, so a rental often shows a tax loss while cash-flowing — sheltering income. Rental losses are passive: they offset passive income freely, and up to $25,000/yr can offset ordinary (W-2) income if you actively participate and your MAGI is under $100k (phasing out to $0 by $150k); unused losses carry forward. On sale, claimed depreciation is recaptured at up to 25%, and gains may owe capital-gains tax (a 1031 exchange can defer both). Figures are a year-1 estimate at your 24.0% rate — not tax advice; consult a CPA.
Schools (NCES district)
- District
- Brunswick County Schools
- NCES district ID
- 3700420
- Math proficiency
- 45% ▲ 4.00%
- Reading proficiency
- 47% ▲ 4.00%
- Median HH income
- $47,494
- Composite
- 39.23/100
- National rank
- #4011
- State rank
- #82 of 178 in NC
Livability — Oak Island
- Score
- 67/100
- State rank
- #233
- US rank
- #10757
Category grades
Schools grade is shown separately in the Schools card above.
Census & demographics
- County
- Brunswick County · 131,536 people
- City population
- 8,756
- Metro
- Myrtle Beach-Conway-North Myrtle Beach, SC-NC
- Population (ZIP)
- 10,059
- Household income
- $69,412
- Rent vs Own
- Severe rent burden
- 243.0
Population outlook (Brunswick County) Hauer SSP2
- Today (2025)
- 152,111 people
- By 2030
- 165,705 · +8.9%
- By 2040
- 188,494 · +23.9%
- By 2050
- 206,228 · +35.6%
- By 2075
- 237,876 · +56.4%
- By 2100
- 251,451 · +65.3%
Race, ethnicity, and origin ACS 2023
- Neighborhood character
- Predominantly White (80%)
- Race & ethnicity
- White 80% Black 9% Two or more races 8% Hispanic / Latino 3% Native American 1%
- Common ancestry
- Slovak 4% Lithuanian 3% Romanian 2%
- Foreign-born
- 3% · Canada
- Languages at home
- 95% English-only · Spanish 4%
Political lean MEDSL · Brunswick
- 2024 margin
- Strong R (+24.9) · D 37.2% · R 62.0%
- 2008→2024 swing
- -6.9pp toward R · 2008: -17.9pp · 2024: -24.9pp
- All cycles
- 2024: R+24.9 2020: R+25.0 2016: R+28.7 2012: R+22.2 2008: R+17.9
Not yet ingested
- Civics
- —
Market trends
- HPI YoY
- ▼ -44.19%
- Current HPI
- 141.1956
- Rent YoY
- —
- Metro
- Myrtle Beach-Conway-North Myrtle Beach, SC-NC
- State GDP YoY
- ▲ 3.28%
- F500 in state
- 26
Industry mix (Fortune 500 HQ in NC)
| Industry | F500 HQs | Revenue |
|---|---|---|
| Financial Services | 2 | $213B |
|
||
| Retail | 2 | $95B |
|
||
| Industrial Conglomerate | 1 | $38B |
|
||
| Metals / Steel | 1 | $35B |
|
||
| Utilities | 1 | $30B |
|
||
| Industrial Machinery | 1 | $19B |
|
||
Price history
+3534.5% since first listed14 events — show timeline
- 2026-06-12 Listed $199,900 Hive MLS
- 2023-08-18 Sold (MLS) $193,000 Hive MLS
- 2023-08-15 Sold (Public Records) $193,000 Public Records
- 2023-07-13 Pending — Hive MLS
- 2023-06-13 Relisted — Hive MLS
- 2023-06-08 Pending — Hive MLS
- 2023-05-24 Listed $199,000 Hive MLS
- 2022-11-15 Sold (MLS) $33,000 Hive MLS
- 2022-11-02 Pending — Hive MLS
- 2022-10-26 Relisted — Hive MLS
- 2022-06-27 Pending — Hive MLS
- 2022-06-18 Listed $39,000 Hive MLS
- 2022-06-02 Sold (Public Records) $10,000 Public Records
- 1988-03-01 Sold (Public Records) $5,500 Public Records
Property tax history
+32.6%/yrLatest (2025): $584 · +0.0% YoY. Source: county tax records.
Cash-flow waterfall
monthlySold comps — $/sqft
last 12 mo · ≤1 miLoading sold comps…