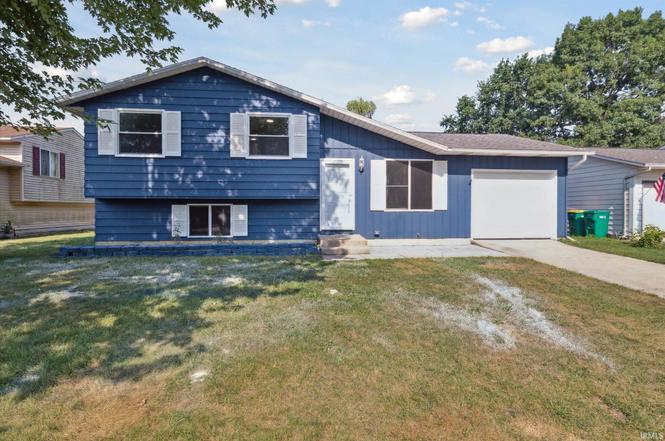
1529 Hampton Ct · Mishawaka, IN
Flood risk 1/10 · Minimal
- FEMA flood zone
- X (unshaded)
- Chance of flooding over 30 yrs
- 0.0%
- Est. flood insurance / yr
- $507 – $1,088
Fire risk 1/10 · Minimal
- Est. fire insurance / yr
- $717 – $1,331
Heat risk 3/10 · Minor
- Hot days now (above 99°F)
- 7 days/yr
- Hot days in 30 yrs
- 16 days/yr
Wind risk 2/10 · Minimal
- Chance of severe wind over 30 yrs
- —
Air-quality risk 2/10 · Minimal
- Unhealthy air days now
- 1 days/yr
- Unhealthy air days in 30 yrs
- 2 days/yr
Risk factors via First Street. Map © Google.
Why this score? — see what drove the F grade
The composite is a weighted blend of 9 inputs, each scored 0–100. Each bar is that input's sub-score; the figure is the points it added to the 100-point composite (weight × sub-score).
- Cash flow +7.6/30.0
- ARV discount +5.0/15.0
- Rent growth +4.8/5.0
- Livability +3.8/5.0
- Condition / age +2.5/5.0
- Schools +2.2/10.0
- DSCR +1.7/10.0
- 1% rule +1.5/10.0
- Appreciation +0.0/10.0
$235,000
🖨 Deal sheet (PDF) 📄 Offer letter ✓ Due diligence
Listing remarks MLS
Investor alert: 3 bedroom, 2 bath home in popular subdivision has good bones and the furnace, AC and water heater were new in 2023. House has a strong pet odor and will need all new flooring. Sold as is, seller is unable to make any repairs
Key facts
- Large backyard
- Freshly painted
- Storage shed
Tags
Property features AI
Exterior
- Parking: Attached garage (1 car)
- Utilities: Public water; Public sewer
- Home design: Single-family residence; Site-built home
- Construction: Aluminum siding
- Exterior features: Irregular lot; Lot dimensions approximately 60 x 150
Interior
- Kitchen: Dishwasher; Microwave; Refrigerator; Gas Range
- Bedrooms: Total of 7 rooms (bedroom count not specified)
- Bathrooms: 2 full bathrooms
- Interior features: Dishwasher; Microwave; Refrigerator; Gas Range; Partial finished basement; Crawl space
- Laundry & utility: Laundry on lower level
Neighborhood map
What this means for you Summary
Snapshot
- This is a 3-bed/2.0-bath single-family listed at $235k.
Deal economics
- At list price, monthly cash flow is $-280 ($-3k/yr) — negative.
- To cash-flow at today's rent, offer at most $186k (21.1% below list).
- To meet the 1% rule (rent ≥ 1% of price), the offer needs to be $153k (34.8% below list).
- Recommended offer: $153k (34.8% below list) — sets the bar for 1% rule.
Location & tenants
- Location reads 76/100 on livability (#53 in IN, #3,586 nationally) — a middle-class / working-renter tenant base. Strengths: cost of living A+, housing A+, health & safety B; Watch: amenities F, employment F.
- School City Of Mishawaka (urban): math 23% / reading 30% proficiency, ranked #260 of 301 in IN (top 86%) — low school quality limits family demand, transient renter base, plan for 1-2y turnover.
- Zoned schools: Fred J Hums Elementary School (math 47% / reading 42%, grade F, #379 of 994 statewide, top 41%, 325 students, 47% FRL); John J Young Middle School (math 17% / reading 30%, grade F, #257 of 330 statewide, top 79%, 735 students, 74% FRL); Mishawaka High School (math 24% / reading 60%, grade F, #197 of 369 statewide, top 57%, 1,488 students, 65% FRL).
- Market conditions: Rents rising fast (+9.1%/yr); 141 active listings in the ZIP; 1 comparable units currently listed for rent nearby; 754 units permitted in St. Joseph County in 2024 (460 in 5+ unit buildings).
- This rent runs 31% of the median local income ($59k/yr) — at the standard rent-burdened threshold; future hikes will face affordability resistance.
Forward outlook
- Local home prices are declining (-3.0%/yr); year-one equity from $2k of loan paydown is wiped out by about $7k of value loss. Plan a longer hold.
Negotiation context
- It's been on market 61 days — a 6% lower offer ($221k) is reasonable based on typical stale-listing flexibility.
- 5 sale attempts since 7y ago; this cycle's ask has dropped $13k (5%) from the opening price — seller is motivated, your offer sets the floor, not the list.
- Current owner paid $170k; 38% above their basis — modest negotiation headroom, anchor on the comps not their cost.
Questions for the listing agent
- What do current leases actually rent for vs. the listed asking? Can we see a recent rent roll and the last 12 months of T-12 income?
- It's been on market 61 days. Have you received any prior offers? Is the seller open to a 35% concession, seller financing, or rate buy-down credit?
- Built in 1974 — when were the roof, HVAC, electrical panel, plumbing, and water heater last replaced?
- Why hasn't it sold? Are there any deal-killer items the seller is aware of (foundation, flood, title, zoning, code violations)?
- Is there a deadline driving the sale (1031 exchange, divorce, estate, relocation)? That informs how much negotiation room exists.
- The area grade is low — what's the realistic commute time and amenity access for the typical tenant pool here? Any planned neighborhood developments (good or bad) we should know about?
- What's the average days-on-market for RENTAL listings here right now (not sales)? A rising rental-DOM trend means longer vacancies and softer asking-rent achievability than the comps imply.
- What's the recent tenant-quality profile in this submarket — average credit score on applications, eviction rate, late-payment / NSF rate, and stable-employment percentage? A property-management company in the area should have these aggregated.
- How much new for-sale + rental construction is in the pipeline within 1–3 miles? Heavy new supply typically softens prices + rents 12–24 months out; constrained supply supports both.
Investment metrics
- 1% rule
- 0.65% ✗
- Cap rate
- 4.86%
- Cash-on-cash
- -5.11%
- DSCR
- 0.77
- GRM
- 12.8
CMA / ARV
- ARV (on-the-fly)
- $222,404
- Comps found
- 12
Show comp detail 12 sales within ~0.75 mi
| Address | Dist | Beds/Ba | Sqft | Sold | Price | $/sf | Match |
|---|---|---|---|---|---|---|---|
| 1315 Providence Ct | 0.16mi | 3/1.0 | 1,316 (0%) | 7mo | $207,000 | $157 | 83 |
| 1426 Quincy Dr | 0.12mi | 3/1.0 | 1,316 (0%) | 16mo | $221,000 | $168 | 77 |
| 2603 Dawes Pl | 0.21mi | 3/1.5 | 1,224 (-7%) | 7mo | $235,000 | $192 | 71 |
| 2632 Prescott Dr | 0.36mi | 4/2.0 (+1) | 1,356 (+3%) | 9mo | $246,000 | $181 | 66 |
| 2610 Lexington Blvd | 0.28mi | 4/1.5 (+1) | 1,392 (+6%) | 7mo | $238,000 | $171 | 65 |
| 2508 Prescott Dr | 0.29mi | 3/1.5 | 1,456 (+11%) | 12mo | $237,000 | $163 | 57 |
| 2732 Prescott Dr | 0.34mi | 4/1.5 (+1) | 1,484 (+13%) | 5mo | $219,900 | $148 | 52 |
| 2644 Prescott Dr | 0.37mi | 3/2.0 | 1,480 (+12%) | 14mo | $250,000 | $169 | 51 |
| 2615 Castine Walk | 0.28mi | 4/1.5 (+1) | 1,462 (+11%) | 15mo | $226,500 | $155 | 49 |
| 1116 Bennington Dr | 0.38mi | 4/1.5 (+1) | 1,462 (+11%) | 10mo | $250,000 | $171 | 49 |
| 2649 Prescott Dr | 0.34mi | 4/1.5 (+1) | 1,462 (+11%) | 15mo | $234,000 | $160 | 46 |
| 1530 Shelton Dr | 0.73mi | 3/2.0 | 1,428 (+8%) | 12mo | $279,900 | $196 | 42 |
Match score weights: distance 35% · size 25% · config 20% · recency 20%. Top-matched comps best support the ARV.
Projected returns pro-forma
-3.0% appreciation · 8.0% rent growth · sell at horizon
- IRR
- -20.1%
- Equity multiple
- 0.27×
- Total profit
- $-47,879
- Equity at exit
- $35,039
- IRR
- -5.5%
- Equity multiple
- 0.57×
- Total profit
- $-28,027
- Equity at exit
- $20,319
Cash invested: $65,800 (down + closing). Projections, not guarantees.
Landlord ↔ Tenant lean methodology
- Overall (STATE)
- 90 Strongly Landlord-Friendly
- State Indiana
- 90 Strongly Landlord-Friendly · R+11
- County
- — inherits STATE
- City
- — inherits STATE
ZIP-level market 46544
- Rents YoY
- 9.1%
- Active inventory
- 141
- Price-to-rent
- 12.8×
Monthly cashflow live
- Estimated rent
- $1,533 medium interval (Pro) →
- Mortgage (P&I)
- −$1,232
- Tax from tax record
- −$161 /mo · $1,934/yr
- Insurance
- −$98
- HOA
- −$0
- Vacancy / Maint / Mgmt
- −$322
- Net cashflow
- $-280
Break-even live
Sensitivity live
| Price | -10% $-147 | -5% $-214 | +0% $-280 | +5% $-347 | +10% $-413 |
|---|---|---|---|---|---|
| Rent | -10% $-401 | -5% $-341 | +0% $-280 | +5% $-220 | +10% $-159 |
| Rate | -1.0pp $-162 | -0.5pp $-220 | base $-280 | +0.5pp $-341 | +1.0pp $-403 |
UW: 25.0% down · 7.5% · 30yr · 1.5% tax · 5.0% vac · 8.0% maint · 8.0% mgmt
Financing live
Cash to close
- Down payment
- $58,750
- Closing costs
- $7,050
- Reserves months
- —
- Total cash needed
- —
Loan-product check · same deal, 3 products live
Conventional
25% down · 7.5% · 30yr
- Down + closing
- —
- Monthly P&I
- —
- Monthly cashflow
- —
- DSCR
- —
- Eligible?
- —
Personal DTI + credit; lowest rate.
DSCR
20% down · 8.5% · 30yr
- Down + closing
- —
- Monthly P&I
- —
- Monthly cashflow
- —
- DSCR
- —
- Eligible?
- —
No personal income docs; deal must DSCR.
Hard money
10% down · 12.0% · 12mo
- Down + closing
- —
- Monthly P&I
- —
- Monthly cashflow
- —
- DSCR
- —
- Eligible?
- —
Short-term bridge; refi at stabilization.
Rent comps 1 comps
| Address | Beds | Baths | Sqft | Rent | $/sqft | DOM | Units | Dist |
|---|---|---|---|---|---|---|---|---|
| 1434 Fallcreek Dr Mishawaka, IN | 2.0–3.0 | 1.0–2.0 | 1176 | $1,529 | $1.30 | 15d | 1 | 1.02mi |
Listing history 13 events
-
2026-04-29status Pending
-
2026-04-24status Active
-
2026-03-18status Pending
-
2026-02-27price $235,000
-
2026-01-20$247,900 Active
-
2025-09-22price $249,900
-
2025-08-04price $254,900
-
2025-07-16$259,900 Active
-
2025-06-10soldstatus $170,000 Closed 241-char remark
Show marketing remark (241 chars)
Investor alert: 3 bedroom, 2 bath home in popular subdivision has good bones and the furnace, AC and water heater were new in 2023. House has a strong pet odor and will need all new flooring. Sold as is, seller is unable to make any repairs
-
2025-05-21status Pending 241-char remark
Show marketing remark (241 chars)
Investor alert: 3 bedroom, 2 bath home in popular subdivision has good bones and the furnace, AC and water heater were new in 2023. House has a strong pet odor and will need all new flooring. Sold as is, seller is unable to make any repairs
-
2025-05-15$179,900 Active 241-char remark
Show marketing remark (241 chars)
Investor alert: 3 bedroom, 2 bath home in popular subdivision has good bones and the furnace, AC and water heater were new in 2023. House has a strong pet odor and will need all new flooring. Sold as is, seller is unable to make any repairs
-
2019-07-16soldstatus $135,000
-
2019-06-13$135,000
ⓘ Source: listings_history table (triggers on properties + properties_extension) + one-shot
backfill from property_details.listing_events for pre-trigger history.
Tax reassessment forecast IN · Partial reset (capped growth)
- Current annual tax
- $1,934 · $161/mo
- Projected year-2 tax
- $1,966 · $164/mo
- Expected delta
- +$32/yr (+$3/mo · 1.7%)
ⓘ Screening estimate from a state-policy table — verify with the county assessor before closing.
Climate risk First Street
- Flood 1/10 Low FEMA zone X (unshaded) · 0% chance over 30 yrs
- Wildfire 1/10 Low
- Heat 3/10 Moderate 7 d/yr ≥99°F today · 16 d/yr by 30 yrs out
- Wind 2/10 Low
- Air quality 2/10 Low 1 unhealthy d/yr today · 2 by 30 yrs out
Nearby sold comps map
Loading sold comps map…
Walkable amenities ~0.75 mi
Loading nearby amenities…
Taxation est. · year 1
- Rental income
- $18,399
- − Mortgage interest
- −$13,164
- − Property taxes
- −$1,934
- − Insurance
- −$1,175
- − Repairs & maintenance
- −$1,472
- − Management
- −$1,472
- − Depreciation
- −$6,836
- Taxable loss
- −$7,654
- Est. tax savings @ 24.0%
- +$1,837
- After-tax cash flow
- $-1,525/yr
For passive investors: Depreciation is non-cash, so a rental often shows a tax loss while cash-flowing — sheltering income. Rental losses are passive: they offset passive income freely, and up to $25,000/yr can offset ordinary (W-2) income if you actively participate and your MAGI is under $100k (phasing out to $0 by $150k); unused losses carry forward. On sale, claimed depreciation is recaptured at up to 25%, and gains may owe capital-gains tax (a 1031 exchange can defer both). Figures are a year-1 estimate at your 24.0% rate — not tax advice; consult a CPA.
Schools (NCES district)
- District
- School City Of Mishawaka
- NCES district ID
- 1806840
- Math proficiency
- 23% ▼ -9.00%
- Reading proficiency
- 30% ▼ -7.00%
- Median HH income
- $39,290
- Composite
- 22.26/100
- National rank
- #8143
- State rank
- #260 of 301 in IN
Livability — Mishawaka
- Score
- 76/100
- State rank
- #53
- US rank
- #3586
Category grades
Schools grade is shown separately in the Schools card above.
Census & demographics
- Census place
- Mishawaka, IN
- County
- Saint Joseph County · 189,048 people
- City population
- 57,683
- Metro
- South Bend-Mishawaka, IN-MI
- Population (ZIP)
- 31,077
- Household income
- $58,829
- Rent vs Own
- Severe rent burden
- 685.0
Population outlook (St. Joseph County) Hauer SSP2
- Today (2025)
- 273,186 people
- By 2030
- 273,594 · +0.1%
- By 2040
- 271,641 · -0.6%
- By 2050
- 269,187 · -1.5%
- By 2075
- 263,136 · -3.7%
- By 2100
- 245,659 · -10.1%
Race, ethnicity, and origin ACS 2023
- Neighborhood character
- Predominantly White (79%)
- Race & ethnicity
- White 79% Black 9% Two or more races 7% Hispanic / Latino 6% Asian 1%
- Hispanic origin (detail)
- Mexican 5%
- Common ancestry
- Romanian 7% English 3% Lithuanian 2%
- Foreign-born
- 4% · Canada, Vietnam
- Languages at home
- 94% English-only · Spanish 3%
Political lean MEDSL · St. Joseph
- 2024 margin
- Toss-up / Even · D 50.0% · R 48.5% · Other 1.5%
- 2008→2024 swing
- -15.6pp toward R · 2008: 17.1pp · 2024: 1.5pp
- All cycles
- 2024: D+1.5 2020: D+5.8 2016: D+0.2 2012: D+3.5 2008: D+17.1
Not yet ingested
- Civics
- —
Market trends
- HPI YoY
- ▼ -116.74%
- Current HPI
- 188.9996
- Rent YoY
- ▲ 9.10%
- Metro
- South Bend-Mishawaka, IN-MI
- State GDP YoY
- ▲ 2.90%
- F500 in state
- 18
Industry mix (Fortune 500 HQ in IN)
| Industry | F500 HQs | Revenue |
|---|---|---|
| Industrial Machinery | 2 | $37B |
|
||
| Healthcare | 1 | $177B |
|
||
| Pharmaceuticals | 1 | $45B |
|
||
| Metals / Steel | 1 | $18B |
|
||
| Agriculture | 1 | $17B |
|
||
| Packaging | 1 | $12B |
|
||
Price history
+74.1% since first listed13 events — show timeline
- 2026-04-29 Pending — IRMLS
- 2026-04-24 Relisted — IRMLS
- 2026-03-18 Pending — IRMLS
- 2026-02-27 Price Changed $235,000 IRMLS
- 2026-01-20 Listed $247,900 IRMLS
- 2025-09-22 Price Changed $249,900 IRMLS
- 2025-08-04 Price Changed $254,900 IRMLS
- 2025-07-16 Listed $259,900 IRMLS
- 2025-06-10 Sold (MLS) $170,000 IRMLS
- 2025-05-21 Pending — IRMLS
- 2025-05-15 Listed $179,900 IRMLS
- 2019-07-16 Sold (MLS) $135,000 IRMLS
- 2019-06-13 Listed $135,000 IRMLS
Property tax history
+9.1%/yrLatest (2023): $1,934 · +0.6% YoY. Source: county tax records.
Cash-flow waterfall
monthlySold comps — $/sqft
last 12 mo · ≤1 miLoading sold comps…