2825 S Hampton Rd S · Columbus, OH
Flood risk 4/10 · Minor
- FEMA flood zone
- X (unshaded)
- Chance of flooding over 30 yrs
- 0.22%
- Est. flood insurance / yr
- $473 – $860
Fire risk 1/10 · Minimal
- Est. fire insurance / yr
- $713 – $1,323
Heat risk 4/10 · Minor
- Hot days now (above 101°F)
- 7 days/yr
- Hot days in 30 yrs
- 18 days/yr
Wind risk 2/10 · Minimal
- Chance of severe wind over 30 yrs
- 1.0%
Air-quality risk 2/10 · Minimal
- Unhealthy air days now
- 1 days/yr
- Unhealthy air days in 30 yrs
- 1 days/yr
Risk factors via First Street. Map © Google.
Why this score? — see what drove the C+ grade
The composite is a weighted blend of 9 inputs, each scored 0–100. Each bar is that input's sub-score; the figure is the points it added to the 100-point composite (weight × sub-score).
- Cash flow +20.9/30.0
- ARV discount +15.0/15.0
- DSCR +6.7/10.0
- 1% rule +6.0/10.0
- Livability +4.0/5.0
- Rent growth +3.1/5.0
- Schools +2.7/10.0
- Condition / age +2.5/5.0
- Appreciation +0.0/10.0
$155,000
🖨 Deal sheet (PDF) 📄 Offer letter ✓ Due diligence
Listing remarks
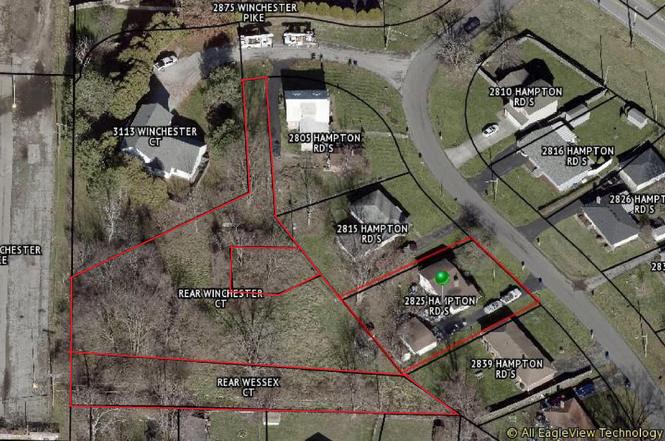
THE REALTOR IS THE RECEIVER APPOINTED BY THE FRANKLIN COUNTY MUNICIPAL COURT, ENVIRONMENTAL DIVISION. Back on the market, this property includes the main parcel plus 3 additional adjoining parcels, totaling 1.18 acres (see map in photos). Cleaned out and ready for your improvements, great opportunity to make this property your own. * * SEE AGENT TO AGENT REMARKS * *
Key facts
- 0.25 acre lot
- Garage
- Built 1968
Neighborhood map
What this means for you Summary
Snapshot
- This is a 3-bed/1.5-bath single-family listed at $155k.
Deal economics
- At list price, monthly cash flow is $216 ($3k/yr) — positive.
- The deal already cash-flows at list — no discount required.
- Meets the 1% rule at list price ($2k rent vs $155k).
- Recommended offer: $150k (3.0% below list) — sets the bar for market timing.
- Cap rate 8.0% vs local median 3.8% in Columbus — top-decile yield for the area; either an underpriced asset or a hidden risk that comps aren't pricing in. Stress-test before assuming the spread holds.
Location & tenants
- Location reads 81/100 on livability (#97 in OH, #1,491 nationally) — a professional / high-income tenant draw. Strengths: commute A+, cost of living A+, housing A+; Watch: employment C-, crime F.
- Groveport Madison Local (suburban): math 23% / reading 38% proficiency, ranked #573 of 656 in OH (top 87%) — families likely to look elsewhere, expect single-tenant / working-renter base with shorter leases; 65% free/reduced lunch — lower-income household profile, screen leases tightly.
- Zoned schools: Groveport Madison High School (math 14% / reading 46%, grade F, #616 of 781 statewide, top 79%, 1,831 students, 75% FRL).
- Market conditions: Rents rising (+2.4%/yr); 94 active listings in the ZIP; 9 comparable units currently listed for rent nearby; rentals at typical pace (median 25d on market — plan ~3-4 weeks tenant-placement turnaround); 8,139 units permitted in Franklin County in 2024 (5,940 in 5+ unit buildings).
- This rent runs 40% of the median local income ($51k/yr) — at the standard rent-burdened threshold; future hikes will face affordability resistance.
Forward outlook
- Local home prices are declining (-3.0%/yr); year-one equity from $1k of loan paydown is wiped out by about $5k of value loss. Plan a longer hold.
- Franklin County population projected at +34% by 2050 — long-run rental-demand tailwind backs the buy-and-hold thesis.
Negotiation context
- It's been on market 32 days — a 3% lower offer ($150k) is reasonable based on typical stale-listing flexibility.
Questions for the listing agent
- It's been on market 32 days. Have you received any prior offers? Is the seller open to a 3% concession, seller financing, or rate buy-down credit?
- Built in 1968 — when were the roof, HVAC, electrical panel, plumbing, and water heater last replaced?
- Is there a deadline driving the sale (1031 exchange, divorce, estate, relocation)? That informs how much negotiation room exists.
- Crime grade is F in this area — have there been break-ins, vandalism, or insurance claims at this property in the last 3 years? What carrier currently insures it and at what premium?
- What's the average days-on-market for RENTAL listings here right now (not sales)? A rising rental-DOM trend means longer vacancies and softer asking-rent achievability than the comps imply.
- What's the recent tenant-quality profile in this submarket — average credit score on applications, eviction rate, late-payment / NSF rate, and stable-employment percentage? A property-management company in the area should have these aggregated.
- How much new for-sale + rental construction is in the pipeline within 1–3 miles? Heavy new supply typically softens prices + rents 12–24 months out; constrained supply supports both.
Investment metrics
- 1% rule
- 1.10% ✓
- Cap rate
- 7.96%
- Cash-on-cash
- 5.97%
- DSCR
- 1.27
- GRM
- 7.6
CMA / ARV
- ARV (on-the-fly)
- $286,528
- Comps found
- 12
Show comp detail 12 sales within ~0.75 mi
| Address | Dist | Beds/Ba | Sqft | Sold | Price | $/sf | Match |
|---|---|---|---|---|---|---|---|
| 3075 Wessex Ct | 0.10mi | 3/1.0 | 1,590 (-2%) | 8mo | $185,000 | $116 | 83 |
| 2960 Schwartz Rd | 0.25mi | 3/2.5 | 1,621 (-0%) | 1mo | $275,000 | $170 | 83 |
| 3000 Westwick Rd | 0.32mi | 3/2.0 | 1,633 (+0%) | 13mo | $335,000 | $205 | 72 |
| 2935 Lake Park Dr | 0.20mi | 3/1.0 | 1,456 (-11%) | 12mo | $230,000 | $158 | 61 |
| 3037 Westwick Rd | 0.33mi | 3/2.0 | 1,700 (+4%) | 20mo | $350,000 | $206 | 58 |
| 2981 Stonebluff Dr | 0.50mi | 3/2.5 | 1,488 (-9%) | 4mo | $285,000 | $192 | 55 |
| 2949 Tracer Rd | 0.45mi | 4/2.5 (+1) | 1,611 (-1%) | 17mo | $280,000 | $174 | 54 |
| 3111 Briar Ridge Rd | 0.62mi | 3/2.0 | 1,508 (-7%) | 7mo | $279,000 | $185 | 51 |
| 2944 Remington Ridge Rd | 0.58mi | 3/2.5 | 1,720 (+6%) | 15mo | $290,000 | $169 | 47 |
| 3082 Remington Ridge Rd | 0.60mi | 3/2.0 | 1,532 (-6%) | 17mo | $243,000 | $159 | 46 |
| 3093 Briar Ridge Rd | 0.63mi | 3/2.5 | 1,464 (-10%) | 12mo | $287,000 | $196 | 40 |
| 3471 Marlin Dr | 0.65mi | 3/2.0 | 1,400 (-14%) | 7mo | $247,000 | $176 | 39 |
Match score weights: distance 35% · size 25% · config 20% · recency 20%. Top-matched comps best support the ARV.
Projected returns pro-forma
-3.0% appreciation · 2.36% rent growth · sell at horizon
- IRR
- -7.8%
- Equity multiple
- 0.71×
- Total profit
- $-12,390
- Equity at exit
- $23,111
- IRR
- 0.9%
- Equity multiple
- 1.06×
- Total profit
- $2,758
- Equity at exit
- $13,402
Cash invested: $43,400 (down + closing). Projections, not guarantees.
Landlord ↔ Tenant lean methodology
- Overall (STATE)
- 73 Landlord-Friendly
- State Ohio
- 73 Landlord-Friendly · R+6
- County
- — inherits STATE
- City
- — inherits STATE
ZIP-level market 43232
- Rents YoY
- 2.4%
- Active inventory
- 94
- Price-to-rent
- 7.6×
Monthly cashflow live
- Estimated rent
- $1,702 high interval (Pro) →
- Mortgage (P&I)
- −$813
- Tax from tax record
- −$251 /mo · $3,010/yr
- Insurance
- −$65
- HOA
- −$0
- Vacancy / Maint / Mgmt
- −$357
- Net cashflow
- $216
Break-even live
Sensitivity live
| Price | -10% $304 | -5% $260 | +0% $216 | +5% $172 | +10% $128 |
|---|---|---|---|---|---|
| Rent | -10% $82 | -5% $149 | +0% $216 | +5% $283 | +10% $350 |
| Rate | -1.0pp $294 | -0.5pp $255 | base $216 | +0.5pp $176 | +1.0pp $135 |
UW: 25.0% down · 7.5% · 30yr · 1.5% tax · 5.0% vac · 8.0% maint · 8.0% mgmt
Financing live
Cash to close
- Down payment
- $38,750
- Closing costs
- $4,650
- Reserves months
- —
- Total cash needed
- —
Loan-product check · same deal, 3 products live
Conventional
25% down · 7.5% · 30yr
- Down + closing
- —
- Monthly P&I
- —
- Monthly cashflow
- —
- DSCR
- —
- Eligible?
- —
Personal DTI + credit; lowest rate.
DSCR
20% down · 8.5% · 30yr
- Down + closing
- —
- Monthly P&I
- —
- Monthly cashflow
- —
- DSCR
- —
- Eligible?
- —
No personal income docs; deal must DSCR.
Hard money
10% down · 12.0% · 12mo
- Down + closing
- —
- Monthly P&I
- —
- Monthly cashflow
- —
- DSCR
- —
- Eligible?
- —
Short-term bridge; refi at stabilization.
Rent comps 9 comps
| Address | Beds | Baths | Sqft | Rent | $/sqft | DOM | Units | Dist |
|---|---|---|---|---|---|---|---|---|
| 3071 Rotunda Ct S Columbus, OH | 4.0 | 2.5 | 1147 | $1,400 | $1.22 | 45d | 1 | 0.80mi |
| 2209 Wabash Ct W Columbus, OH | 1.0–2.0 | 1.0–1.5 | 826 | $1,456 | $1.76 | 4d | 6 | 0.84mi |
| 2475 Lawndale Ave Columbus, OH | 3.0 | 2.0 | 1362 | $1,945 | $1.43 | 25d | 1 | 0.95mi |
| 2645 Travis Rd Columbus, OH | 1.0–3.0 | 1.0–1.5 | 1100 | $1,725 | $1.57 | 45d | 6 | 1.09mi |
| 1892 Somerset Ct E Columbus, OH | 4.0 | 2.0 | 1300 | $1,725 | $1.33 | 25d | 1 | 1.30mi |
| 2500 Waters Edge Blvd Unit 042 Columbus, OH | 2.0 | 2.0 | 1057 | $1,635 | $1.55 | 5d | 1 | 1.38mi |
| 3611 Bill of Rights Sq Columbus, OH | 3.0 | 1.5 | 1200 | $1,885 | $1.57 | 16d | 1 | 1.43mi |
| 3409 Bexvie Ave Columbus, OH | 2.0–3.0 | 1.5 | 990 | $1,400 | $1.41 | 3d | 3 | 1.49mi |
| 1728 Penfield Rd Columbus, OH | 3.0 | 1.0 | 1224 | $1,925 | $1.57 | 45d | 1 | 1.49mi |
Listing history 15 events
-
2026-06-17status $155,000 Pending 32 DOM
-
2026-06-17days on market $155,000 Active 32 DOM
-
2026-06-16days on market $155,000 Active 31 DOM
-
2026-06-15days on market $155,000 Active 30 DOM
-
2026-06-13days on market $155,000 Active 28 DOM
-
2026-06-13days on market $155,000 Active 27 DOM
-
2026-06-09days on market $155,000 Active 24 DOM
-
2026-06-08days on market $155,000 Active 23 DOM
-
2026-06-07days on market $155,000 Active 22 DOM
-
2026-06-03days on market $155,000 Active 18 DOM
-
2026-06-02days on market $155,000 Active 17 DOM
-
2026-06-01days on market $155,000 Active 16 DOM
-
2026-05-31days on market $155,000 Active 15 DOM
-
2025-10-03status Pending
-
2025-09-22$155,000 Active
ⓘ Source: listings_history table (triggers on properties + properties_extension) + one-shot
backfill from property_details.listing_events for pre-trigger history.
Tax reassessment forecast OH · Partial reset (capped growth)
- Current annual tax
- $3,010 · $251/mo
- Projected year-2 tax
- $3,010 · $251/mo
- Expected delta
- $0/yr ($0/mo · 0.0%)
ⓘ Screening estimate from a state-policy table — verify with the county assessor before closing.
Climate risk First Street
- Flood 4/10 Moderate FEMA zone X (unshaded) · 22% chance over 30 yrs
- Wildfire 1/10 Low
- Heat 4/10 Moderate 7 d/yr ≥101°F today · 18 d/yr by 30 yrs out
- Wind 2/10 Low 100% chance of damaging wind over 30 yrs
- Air quality 2/10 Low 1 unhealthy d/yr today · 1 by 30 yrs out
Nearby sold comps map
Loading sold comps map…
Walkable amenities ~0.75 mi
Loading nearby amenities…
Taxation est. · year 1
- Rental income
- $20,419
- − Mortgage interest
- −$8,682
- − Property taxes
- −$3,010
- − Insurance
- −$775
- − Repairs & maintenance
- −$1,633
- − Management
- −$1,633
- − Depreciation
- −$4,509
- Taxable income
- $175
- Est. tax owed @ 24.0%
- −$42
- After-tax cash flow
- $2,550/yr
For passive investors: Depreciation is non-cash, so a rental often shows a tax loss while cash-flowing — sheltering income. Rental losses are passive: they offset passive income freely, and up to $25,000/yr can offset ordinary (W-2) income if you actively participate and your MAGI is under $100k (phasing out to $0 by $150k); unused losses carry forward. On sale, claimed depreciation is recaptured at up to 25%, and gains may owe capital-gains tax (a 1031 exchange can defer both). Figures are a year-1 estimate at your 24.0% rate — not tax advice; consult a CPA.
Schools (NCES district)
- District
- Groveport Madison Local
- NCES district ID
- 3904697
- Math proficiency
- 23% ▼ -25.00%
- Reading proficiency
- 38% ▼ -16.00%
- Median HH income
- $49,549
- Composite
- 26.52/100
- National rank
- #7200
- State rank
- #573 of 656 in OH
Livability — Columbus
- Score
- 81/100
- State rank
- #97
- US rank
- #1491
Category grades
Schools grade is shown separately in the Schools card above.
Census & demographics
- Census place
- Columbus, OH
- County
- Franklin County · 1,351,780 people
- City population
- 612,189
- Metro
- Columbus, OH
- Population (ZIP)
- 47,364
- Household income
- $51,417
- Rent vs Own
- Severe rent burden
- 2584.0
Population outlook (Franklin County) Hauer SSP2
- Today (2025)
- 1,456,139 people
- By 2030
- 1,556,890 · +6.9%
- By 2040
- 1,757,349 · +20.7%
- By 2050
- 1,950,539 · +34.0%
- By 2075
- 2,376,171 · +63.2%
- By 2100
- 2,636,796 · +81.1%
Race, ethnicity, and origin ACS 2023
- Neighborhood character
- Diverse neighborhood (Simpson 0.58)
- Race & ethnicity
- Black 58% White 26% Hispanic / Latino 8% Two or more races 7% Asian 1%
- Hispanic origin (detail)
- Mexican 2% Puerto Rican 1% Dominican 1%
- Common ancestry
- Swiss 1% Slovak 1% Italian 1%
- Foreign-born
- 13% · Canada, China
- Languages at home
- 86% English-only · Spanish 6% French/Haitian/Cajun 1%
Political lean MEDSL · Franklin
- 2024 margin
- Strong D (+28.4) · D 63.7% · R 35.3% · Other 1.0%
- 2008→2024 swing
- +7.7pp toward D · 2008: 20.7pp · 2024: 28.4pp
- All cycles
- 2024: D+28.4 2020: D+31.4 2016: D+25.9 2012: D+21.7 2008: D+20.7
Not yet ingested
- Civics
- —
Market trends
- HPI YoY
- ▼ -203.49%
- Current HPI
- 249.3708
- Rent YoY
- ▲ 2.36%
- Metro
- Columbus, OH
- State GDP YoY
- ▲ 1.98%
- F500 in state
- 48
Industry mix (Fortune 500 HQ in OH)
| Industry | F500 HQs | Revenue |
|---|---|---|
| Insurance | 3 | $145B |
|
||
| Industrial Machinery | 3 | $49B |
|
||
| Financial Services | 3 | $24B |
|
||
| Consumer Goods | 2 | $93B |
|
||
| Aerospace / Defense | 2 | $47B |
|
||
| Utilities | 2 | $33B |
|
||
Price history
2 events — show timeline
- 2025-10-03 Pending — CBRMLS
- 2025-09-22 Listed $155,000 CBRMLS
Property tax history
+9.4%/yrLatest (2024): $3,010 · +4.1% YoY. Source: county tax records.
Cash-flow waterfall
monthlySold comps — $/sqft
last 12 mo · ≤1 miLoading sold comps…