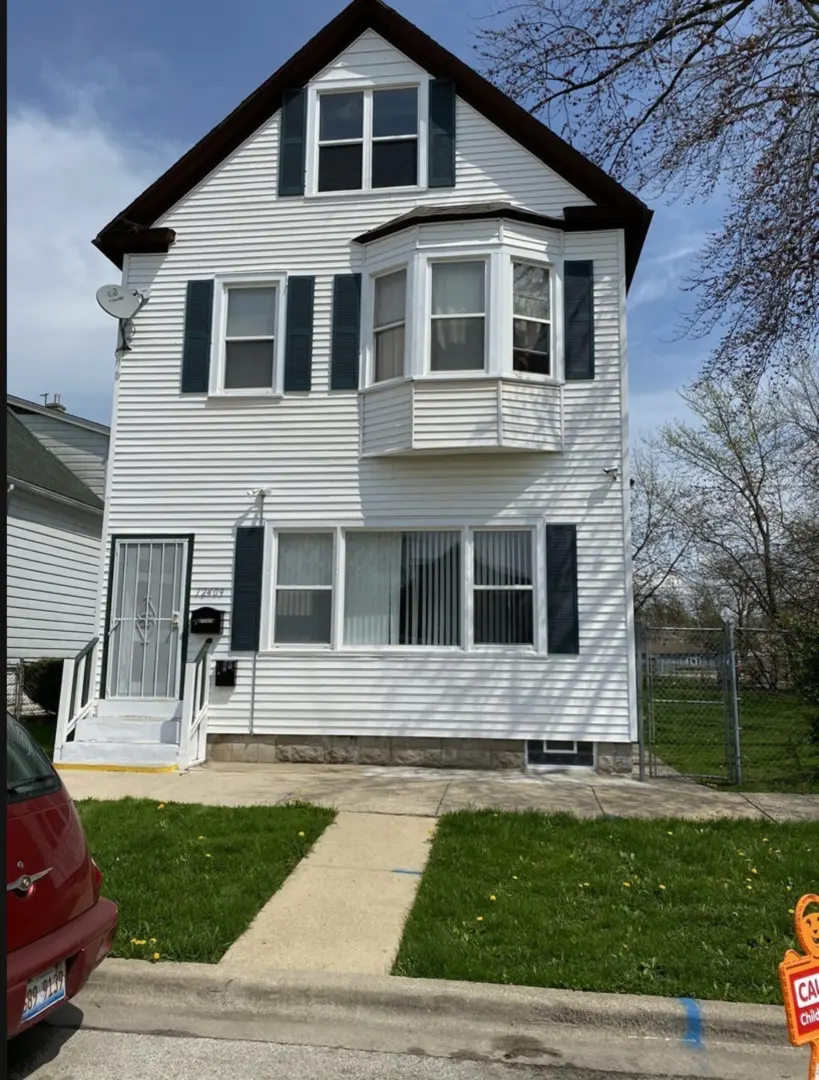
 Duplex
12409 S Green St · Calumet Park, IL
Flood risk 1/10 · Minimal
- FEMA flood zone
- X (unshaded)
- Chance of flooding over 30 yrs
- 0.0%
- Est. flood insurance / yr
- $473 – $860
Fire risk 1/10 · Minimal
- Est. fire insurance / yr
- $804 – $1,492
Heat risk 3/10 · Minor
- Hot days now (above 101°F)
- 7 days/yr
- Hot days in 30 yrs
- 15 days/yr
Wind risk 2/10 · Minimal
- Chance of severe wind over 30 yrs
- —
Air-quality risk 4/10 · Minor
- Unhealthy air days now
- 4 days/yr
- Unhealthy air days in 30 yrs
- 6 days/yr
Risk factors via First Street. Map © Google.
Why this score? — see what drove the B+ grade
The composite is a weighted blend of 9 inputs, each scored 0–100. Each bar is that input's sub-score; the figure is the points it added to the 100-point composite (weight × sub-score).
- Cash flow +30.0/30.0
- ARV discount +15.0/15.0
- 1% rule +10.0/10.0
- DSCR +10.0/10.0
- Rent growth +4.5/5.0
- Livability +3.6/5.0
- Condition / age +2.5/5.0
- Schools +1.6/10.0
- Appreciation +0.0/10.0
$175,000
🖨 Deal sheet 📄 Offer letter ✓ Due diligence
Multi-family units
County records classify this as Multi-Family (2-4 Unit). Listing-text estimate: 2 units. confirmed
Listing remarks MLS
An investor's dream opportunity! Spacious 2-unit property situated on an oversized lot with 2 PINs. Renovations have been started-perfect for a buyer looking to step in and complete the project. A must-see investment!
Key facts
- 2 unit property
- Oversized lot
- Renovations started
Tags
Neighborhood map
What this means for you Summary
Snapshot
- This is a 2 × 3-bed/1.0-bath units multifamily listed at $175k.
Deal economics
- At list price, monthly cash flow is $2k ($29k/yr) — positive. Per door: $1k/mo.
- The deal already cash-flows at list — no discount required.
- Meets the 1% rule at list price ($5k rent vs $175k).
- Recommended offer: $154k (12.0% below list) — sets the bar for market timing.
- Cap rate 23.0% vs local median 6.7% in Calumet Park — top-decile yield for the area; either an underpriced asset or a hidden risk that comps aren't pricing in. Stress-test before assuming the spread holds.
Location & tenants
- Location reads 72/100 on livability (#308 in IL) — a middle-class / working-renter tenant base. Strengths: commute A+, cost of living A+, housing A+; Watch: employment C-, schools F, crime F.
- Chsd 218 (suburban): math 14% / reading 20% proficiency, ranked #454 of 620 in IL (top 73%) — low school quality limits family demand, transient renter base, plan for 1-2y turnover.
- Market conditions: Rents rising fast (+7.8%/yr); 76 active listings in the ZIP; 1 comparable units currently listed for rent nearby; lower-income renter base — watch delinquency; 6,272 units permitted in Cook County in 2024 (4,658 in 5+ unit buildings).
- At $4,624/mo this rent would consume 149% of the median local household income ($37k/yr) (locally 1868% of renters already pay >50% of income on rent) — very limited rent-growth headroom before tenants either downsize or default.
Forward outlook
- Local home prices are declining (-3.0%/yr); year-one equity from $1k of loan paydown is wiped out by about $5k of value loss. Plan a longer hold.
- At projected returns (-3.0% appreciation + 7.8% rent growth), your $49k cash investment doubles in ~2 years — after that, you're playing with house money.
Negotiation context
- It's been on market 140 days — a 12% lower offer ($154k) is reasonable based on typical stale-listing flexibility.
- 10 sale attempts since 20y ago with the ask held roughly flat each time — persistent listings suggest the price (not the market) is what's stuck; bring a comps-based counter.
- Current owner paid $140k; 25% above their basis — modest negotiation headroom, anchor on the comps not their cost.
Risks & watch-outs
- Watch-outs: built in 1924 — expect roof / HVAC / electrical / plumbing capex.
Questions for the listing agent
- It's been on market 140 days. Have you received any prior offers? Is the seller open to a 12% concession, seller financing, or rate buy-down credit?
- Can we see the unit-by-unit rent roll, current vacancy, and any below-market leases? What's the average tenancy length?
- What capital expenditures (roof, boiler, parking lot, exteriors) have been made in the last 5 years, and what's planned in the next 2?
- Built in 1924 — when were the roof, HVAC, electrical panel, plumbing, and water heater last replaced?
- Why hasn't it sold? Are there any deal-killer items the seller is aware of (foundation, flood, title, zoning, code violations)?
- Is there a deadline driving the sale (1031 exchange, divorce, estate, relocation)? That informs how much negotiation room exists.
- Schools are F-rated, which usually means shorter tenancies and higher turnover. Who's the typical renter profile here, and what's been the actual vacancy rate?
- Crime grade is F in this area — have there been break-ins, vandalism, or insurance claims at this property in the last 3 years? What carrier currently insures it and at what premium?
- What's the average days-on-market for RENTAL listings here right now (not sales)? A rising rental-DOM trend means longer vacancies and softer asking-rent achievability than the comps imply.
- What's the recent tenant-quality profile in this submarket — average credit score on applications, eviction rate, late-payment / NSF rate, and stable-employment percentage? A property-management company in the area should have these aggregated.
- How much new apartment / multifamily construction is in the pipeline within 1–3 miles? Heavy new supply (>2% of stock underway) typically softens rents 12–24 months out; light construction supports rent growth.
Investment metrics
- 1% rule
- 2.64% ✓
- Cap rate
- 23.05%
- Cash-on-cash
- 59.84%
- DSCR
- 3.66
- GRM
- 3.2
CMA / ARV
- ARV (median comp)
- $304,864
- List price
- $175,000
- Delta
- -42.60%
- Verdict
- UNDERPRICED
- Comps
- 7 within 1.0 mi
Projected returns pro-forma
-3.0% appreciation · 7.82% rent growth · sell at horizon
- IRR
- 64.0%
- Equity multiple
- 4.08×
- Total profit
- $150,860
- Equity at exit
- $26,093
- IRR
- 70.0%
- Equity multiple
- 9.95×
- Total profit
- $438,673
- Equity at exit
- $15,131
Cash invested: $49,000 (down + closing). Projections, not guarantees.
Landlord ↔ Tenant lean methodology
- Overall (STATE)
- 43 Moderately Tenant-Leaning
- State Illinois
- 43 Moderately Tenant-Leaning · D+7
- County
- — inherits STATE
- City
- — inherits STATE
ZIP-level market 60827
- Home prices YoY
- -31.8%
- Rents YoY
- 7.8%
- Active inventory
- 76
- Price-to-rent
- 6.3×
Monthly cashflow live
- Estimated rent
- $4,624 high interval (Pro) →
- Mortgage (P&I)
- −$918
- Tax est. 1.5%
- −$219 /mo · $2,625/yr
- Insurance
- −$73
- HOA
- −$0
- Vacancy / Maint / Mgmt
- −$971
- Net cashflow
- $2,444
Break-even live
2-unit breakdown (identical units grouped — click to expand)
| Units | Beds | Baths | Est. rent |
|---|---|---|---|
| 2× units | 3 | 1 | $4,624 |
| #1 | 3 | 1 | $2,312 |
| #2 | 3 | 1 | $2,312 |
| Total (2 units) | $4,624 | ||
UW: 25.0% down · 7.5% · 30yr · 1.5% tax · 5.0% vac · 8.0% maint · 8.0% mgmt
Financing live
Cash to close
- Down payment
- $43,750
- Closing costs
- $5,250
- Reserves months
- —
- Total cash needed
- —
Loan-product check · same deal, 3 products live
Conventional
25% down · 7.5% · 30yr
- Down + closing
- —
- Monthly P&I
- —
- Monthly cashflow
- —
- DSCR
- —
- Eligible?
- —
Personal DTI + credit; lowest rate.
DSCR
20% down · 8.5% · 30yr
- Down + closing
- —
- Monthly P&I
- —
- Monthly cashflow
- —
- DSCR
- —
- Eligible?
- —
No personal income docs; deal must DSCR.
Hard money
10% down · 12.0% · 12mo
- Down + closing
- —
- Monthly P&I
- —
- Monthly cashflow
- —
- DSCR
- —
- Eligible?
- —
Short-term bridge; refi at stabilization.
Rent comps 1 comps
| Address | Beds | Baths | Sqft | Rent | $/sqft | DOM | Units | Dist |
|---|---|---|---|---|---|---|---|---|
| 11444 S Carpenter St Chicago, IL | 7.0 | 2.0 | 2300 | $4,500 | $1.96 | 18d | 1 | 1.24mi |
Listing history 50 events
-
2026-06-18days on market $175,000 Active 140 DOM
-
2026-06-17days on market $175,000 Active 139 DOM
-
2026-06-16days on market $175,000 Active 138 DOM
-
2026-06-15days on market $175,000 Active 137 DOM
-
2026-06-13days on market $175,000 Active 135 DOM
-
2026-06-09days on market $175,000 Active 131 DOM
-
2026-06-08days on market $175,000 Active 130 DOM
-
2026-06-07days on market $175,000 Active 129 DOM
-
2026-06-04days on market $175,000 Active 126 DOM
-
2026-06-03days on market $175,000 Active 125 DOM
-
2026-06-02days on market $175,000 Active 124 DOM
-
2026-06-01days on market $175,000 Active 123 DOM
-
2026-05-31days on market $175,000 Active 122 DOM
-
2026-01-29$175,000 Active 217-char remark
Show marketing remark (217 chars)
An investor's dream opportunity! Spacious 2-unit property situated on an oversized lot with 2 PINs. Renovations have been started-perfect for a buyer looking to step in and complete the project. A must-see investment!
-
2021-01-25soldstatus $140,000
-
2020-12-17soldstatus $127,500 Closed Sale 890-char remark
Show marketing remark (890 chars)
Both tenants paying rent. Opportunity to duplex up to partially finished attic for large master bedroom suite. Opportunity to add air conditioning to existing forced air furnaces for both units. First floor recently updated and the whole building was updated as of 2008. Tenants pay heat, electric and gas and they each have their own laundry hookup in the full basement attached to their own utilities. Hardwood floors and large kitchens accompany 3 bedrooms on the first floor. 2 bay window and 3 bedrooms with a large eat in kitchen on the second floor. Tear off roof in 2018 so you won't need to worry about that until 2038. Electric is on breaker boxes. Both the wide building lot and double side lot are fenced together. Taxes are being contested. Everything is ready for the new investor to start collecting rent or make some easy upgrades to increase rent once the contracts expire.
-
2020-09-09status Contingent (Do Not Show) 890-char remark
Show marketing remark (890 chars)
Both tenants paying rent. Opportunity to duplex up to partially finished attic for large master bedroom suite. Opportunity to add air conditioning to existing forced air furnaces for both units. First floor recently updated and the whole building was updated as of 2008. Tenants pay heat, electric and gas and they each have their own laundry hookup in the full basement attached to their own utilities. Hardwood floors and large kitchens accompany 3 bedrooms on the first floor. 2 bay window and 3 bedrooms with a large eat in kitchen on the second floor. Tear off roof in 2018 so you won't need to worry about that until 2038. Electric is on breaker boxes. Both the wide building lot and double side lot are fenced together. Taxes are being contested. Everything is ready for the new investor to start collecting rent or make some easy upgrades to increase rent once the contracts expire.
-
2020-08-15$140,000 New 890-char remark
Show marketing remark (890 chars)
Both tenants paying rent. Opportunity to duplex up to partially finished attic for large master bedroom suite. Opportunity to add air conditioning to existing forced air furnaces for both units. First floor recently updated and the whole building was updated as of 2008. Tenants pay heat, electric and gas and they each have their own laundry hookup in the full basement attached to their own utilities. Hardwood floors and large kitchens accompany 3 bedrooms on the first floor. 2 bay window and 3 bedrooms with a large eat in kitchen on the second floor. Tear off roof in 2018 so you won't need to worry about that until 2038. Electric is on breaker boxes. Both the wide building lot and double side lot are fenced together. Taxes are being contested. Everything is ready for the new investor to start collecting rent or make some easy upgrades to increase rent once the contracts expire.
-
2020-07-01soldstatus $127,500
-
2020-05-28soldstatus $127,500 Closed Sale
-
2020-05-20status Pending
-
2020-05-16status Contingent
-
2020-04-17price $139,900
-
2020-04-03price $144,900
-
2020-03-24price $147,500
-
2020-03-13price $149,900
-
2020-03-13status Reactivated
-
2020-02-12status Pending
-
2020-01-30historical Contingent
-
2020-01-26price $147,900
-
2019-11-28price $148,500
-
2019-11-20price $149,900
-
2019-11-19status Reactivated
-
2019-11-12historical Contingent
-
2019-11-09price $159,900
-
2019-10-19$148,500 New
-
2019-10-19historical
-
2019-10-03price
-
2019-09-19price
-
2019-09-09price
-
2019-09-01price
-
2019-08-26status Reactivated
-
2019-08-21historical Contingent
-
2019-08-13New
-
2009-08-11price Cancelled
-
2009-08-11historical
-
2009-07-15price Price Change
-
2009-07-12status Active
-
2009-07-12historical
-
2009-07-01New
ⓘ Source: listings_history table (triggers on properties + properties_extension) + one-shot
backfill from property_details.listing_events for pre-trigger history.
Climate risk First Street
- Flood 1/10 Low FEMA zone X (unshaded) · 0% chance over 30 yrs
- Wildfire 1/10 Low
- Heat 3/10 Moderate 7 d/yr ≥101°F today · 15 d/yr by 30 yrs out
- Wind 2/10 Low
- Air quality 4/10 Moderate 4 unhealthy d/yr today · 6 by 30 yrs out
Nearby sold comps map
Loading sold comps map…
Walkable amenities ~0.75 mi
Loading nearby amenities…
Taxation est. · year 1
- Rental income
- $55,488
- − Mortgage interest
- −$9,803
- − Property taxes
- −$2,625
- − Insurance
- −$875
- − Repairs & maintenance
- −$4,439
- − Management
- −$4,439
- − Depreciation
- −$5,091
- Taxable income
- $28,216
- Est. tax owed @ 24.0%
- −$6,772
- After-tax cash flow
- $22,551/yr
For passive investors: Depreciation is non-cash, so a rental often shows a tax loss while cash-flowing — sheltering income. Rental losses are passive: they offset passive income freely, and up to $25,000/yr can offset ordinary (W-2) income if you actively participate and your MAGI is under $100k (phasing out to $0 by $150k); unused losses carry forward. On sale, claimed depreciation is recaptured at up to 25%, and gains may owe capital-gains tax (a 1031 exchange can defer both). Figures are a year-1 estimate at your 24.0% rate — not tax advice; consult a CPA.
Schools (NCES district)
- District
- Chsd 218
- NCES district ID
- 1706540
- Math proficiency
- 14% ▼ -4.00%
- Reading proficiency
- 20% ▼ -1.00%
- Median HH income
- $57,166
- Composite
- 16.09/100
- National rank
- #9235
- State rank
- #454 of 620 in IL
Livability — Calumet Park
- Score
- 72/100
- State rank
- #308
- US rank
- #6048
Category grades
Schools grade is shown separately in the Schools card above.
Census & demographics
- Census place
- Calumet Park, IL
- County
- Cook County · 4,486,803 people
- Metro
- Chicago-Naperville-Elgin, IL-IN-WI
- Population (ZIP)
- 24,713
- Household income
- $37,217
- Rent vs Own
- Severe rent burden
- 1868.0
Population outlook (Cook County) Hauer SSP2
- Today (2025)
- 5,347,519 people
- By 2030
- 5,357,703 · +0.2%
- By 2040
- 5,324,924 · -0.4%
- By 2050
- 5,230,762 · -2.2%
- By 2075
- 4,785,735 · -10.5%
- By 2100
- 4,188,836 · -21.7%
Race, ethnicity, and origin ACS 2023
- Neighborhood character
- Predominantly Black (88%)
- Race & ethnicity
- Black 88% Two or more races 5% Hispanic / Latino 5% White 2%
- Common ancestry
- Iranian 1%
- Foreign-born
- 2% · Canada
- Languages at home
- 96% English-only · Spanish 3%
Political lean MEDSL · Cook
- 2024 margin
- Solid D (+42.0) · D 70.4% · R 28.4% · Other 1.2%
- 2008→2024 swing
- -11.4pp toward R · 2008: 53.4pp · 2024: 42.0pp
- All cycles
- 2024: D+42.0 2020: D+50.3 2016: D+53.0 2012: D+49.4 2008: D+53.4
Not yet ingested
- Civics
- —
Market trends
- HPI YoY
- ▼ -76.39%
- Current HPI
- 163.7725
- Rent YoY
- ▲ 7.82%
- Metro
- Chicago-Naperville-Elgin, IL-IN-WI
- State GDP YoY
- ▲ 1.59%
- F500 in state
- 60
Industry mix (Fortune 500 HQ in IL)
| Industry | F500 HQs | Revenue |
|---|---|---|
| Insurance | 4 | $201B |
|
||
| Consumer Goods | 4 | $87B |
|
||
| Industrial Machinery | 3 | $64B |
|
||
| Healthcare | 2 | $55B |
|
||
| Retail / Pharmacy | 1 | $148B |
|
||
| Agriculture / Food | 1 | $86B |
|
||
Price history
+75.2% since first listed40 events — show timeline
- 2026-01-29 Listed $175,000 MRED as Distributed by MLS Grid
- 2021-01-25 Sold (Public Records) $140,000 Public Records
- 2020-12-17 Sold (MLS) $127,500 MRED as Distributed by MLS Grid
- 2020-09-09 Pending — MRED as Distributed by MLS Grid
- 2020-08-15 Listed $140,000 MRED as Distributed by MLS Grid
- 2020-07-01 Sold (Public Records) $127,500 Public Records
- 2020-05-28 Sold (MLS) $127,500 MRED as Distributed by MLS Grid
- 2020-05-20 Pending — MRED as Distributed by MLS Grid
- 2020-05-16 Pending — MRED as Distributed by MLS Grid
- 2020-04-17 Price Changed $139,900 MRED as Distributed by MLS Grid
- 2020-04-03 Price Changed $144,900 MRED as Distributed by MLS Grid
- 2020-03-24 Price Changed $147,500 MRED as Distributed by MLS Grid
- 2020-03-13 Price Changed $149,900 MRED as Distributed by MLS Grid
- 2020-03-13 Relisted — MRED as Distributed by MLS Grid
- 2020-02-12 Pending — MRED as Distributed by MLS Grid
- 2020-01-30 Contingent — MRED as Distributed by MLS Grid
- 2020-01-26 Price Changed $147,900 MRED as Distributed by MLS Grid
- 2019-11-28 Price Changed $148,500 MRED as Distributed by MLS Grid
- 2019-11-20 Price Changed $149,900 MRED as Distributed by MLS Grid
- 2019-11-19 Relisted — MRED as Distributed by MLS Grid
- 2019-11-12 Contingent — MRED as Distributed by MLS Grid
- 2019-11-09 Price Changed $159,900 MRED as Distributed by MLS Grid
- 2019-10-19 Listing Removed — MRED as Distributed by MLS Grid
- 2019-10-19 Listed $148,500 MRED as Distributed by MLS Grid
- 2019-10-03 Price Changed — MRED as Distributed by MLS Grid
- 2019-09-19 Price Changed — MRED as Distributed by MLS Grid
- 2019-09-09 Price Changed — MRED as Distributed by MLS Grid
- 2019-09-01 Price Changed — MRED as Distributed by MLS Grid
- 2019-08-26 Relisted — MRED as Distributed by MLS Grid
- 2019-08-21 Contingent — MRED as Distributed by MLS Grid
- 2019-08-13 Listed — MRED as Distributed by MLS Grid
- 2009-08-11 Listing Removed — MRED as Distributed by MLS Grid
- 2009-08-11 Price Changed — MRED as Distributed by MLS Grid
- 2009-07-15 Price Changed — MRED as Distributed by MLS Grid
- 2009-07-12 Relisted — MRED as Distributed by MLS Grid
- 2009-07-12 Listing Removed — MRED as Distributed by MLS Grid
- 2009-07-01 Listed — MRED as Distributed by MLS Grid
- 2008-02-01 Sold (MLS) $87,000 MRED as Distributed by MLS Grid
- 2007-10-18 Listing Removed — MRED as Distributed by MLS Grid
- 2006-12-15 Listed $99,900 MRED as Distributed by MLS Grid
Property tax history
+3.9%/yrLatest (2023): $9,552 · +4.1% YoY. Source: county tax records.
Cash-flow waterfall
monthlySold comps — $/sqft
last 12 mo · ≤1 miLoading sold comps…