26810 Scarlet Willow Dr · Houston, TX
Flood risk No data
- FEMA flood zone
- —
- Chance of flooding over 30 yrs
- —
- Est. flood insurance / yr
- —
Fire risk No data
- Est. fire insurance / yr
- —
Heat risk No data
- Hot days now (above threshold)
- —
- Hot days in 30 yrs
- —
Wind risk No data
- Chance of severe wind over 30 yrs
- —
Air-quality risk No data
- Unhealthy air days now
- —
- Unhealthy air days in 30 yrs
- —
Risk factors via First Street. Map © Google.
Why this score? — see what drove the C grade
The composite is a weighted blend of 9 inputs, each scored 0–100. Each bar is that input's sub-score; the figure is the points it added to the 100-point composite (weight × sub-score).
- Cash flow +19.1/30.0
- ARV discount +15.0/15.0
- DSCR +6.0/10.0
- Schools +5.7/10.0
- 1% rule +4.7/10.0
- Livability +3.7/5.0
- Condition / age +2.5/5.0
- Rent growth +2.3/5.0
- Appreciation +0.0/10.0
$237,990
🖨 Deal sheet 📄 Offer letter ✓ Due diligence
Listing remarks MLS
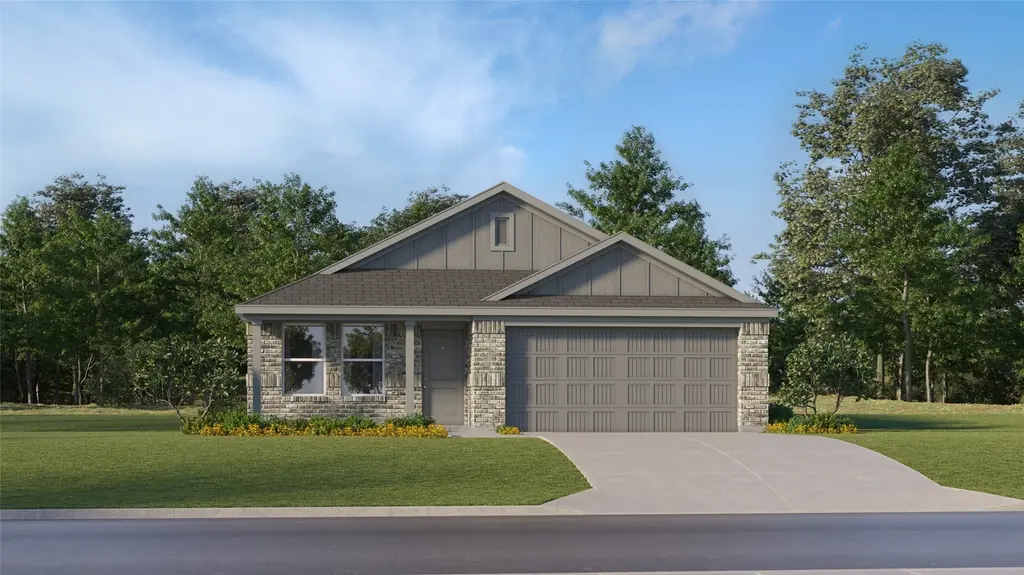
The Beckman Floor Plan - This new home is conveniently laid out on a single floor for maximum comfort and convenience. At its heart stands an open-concept layout connecting a spacious family room, a multi-functional kitchen and lovely dining area. The owner’s suite is situated in a private corner and comes complete with an adjoining bathroom, while the two secondary bedrooms are located near the foyer. The completion date, prices and features may vary and are subject to change. Please verify with Lennar directly. Photos are for illustrative purposes only.
Key facts
- Lovely dining area
- Adjoining bathroom
- Owner's suite
Tags
Neighborhood map
What this means for you Summary
Snapshot
- This is a 3-bed/2.0-bath land listed at $238k.
Deal economics
- At list price, monthly cash flow is $253 ($3k/yr) — positive.
- The deal already cash-flows at list — no discount required.
- To meet the 1% rule (rent ≥ 1% of price), the offer needs to be $231k (3.0% below list).
- Recommended offer: $224k (6.0% below list) — sets the bar for market timing.
- Cap rate 7.6% vs local median 3.2% in Houston — top-decile yield for the area; either an underpriced asset or a hidden risk that comps aren't pricing in. Stress-test before assuming the spread holds.
Location & tenants
- Location reads 74/100 on livability (#184 in TX, #4,771 nationally) — a middle-class / working-renter tenant base. Strengths: amenities A+, cost of living A+, housing A+; Watch: schools D, crime F.
- Katy ISD (suburban): math 61% / reading 63% proficiency, ranked #29 of 826 in TX (top 4%) — acceptable for families but not a draw, mixed tenant base, ~2y average lease.
- Market conditions: Rents soft (-0.8%/yr); 2696 active listings in the ZIP; 17 comparable units currently listed for rent nearby; rentals at typical pace (median 24d on market — plan ~3-4 weeks tenant-placement turnaround); 47% of comp listings sitting > 30 days — soft ceiling on asking rent; high-income renter base; 29,883 units permitted in Harris County in 2024 (8,621 in 5+ unit buildings).
Forward outlook
- Local home prices are declining (-3.0%/yr); year-one equity from $2k of loan paydown is wiped out by about $7k of value loss. Plan a longer hold.
- Harris County population projected at +47% by 2050 — long-run rental-demand tailwind backs the buy-and-hold thesis.
Negotiation context
- It's been on market 79 days — a 6% lower offer ($224k) is reasonable based on typical stale-listing flexibility.
- 3 sale attempts with the ask held roughly flat each time — persistent listings suggest the price (not the market) is what's stuck; bring a comps-based counter.
Questions for the listing agent
- It's been on market 79 days. Have you received any prior offers? Is the seller open to a 6% concession, seller financing, or rate buy-down credit?
- What does the HOA fee cover, when was the last increase, and are there any pending special assessments or reserve-fund shortfalls?
- Why hasn't it sold? Are there any deal-killer items the seller is aware of (foundation, flood, title, zoning, code violations)?
- Is there a deadline driving the sale (1031 exchange, divorce, estate, relocation)? That informs how much negotiation room exists.
- Schools are D-rated, which usually means shorter tenancies and higher turnover. Who's the typical renter profile here, and what's been the actual vacancy rate?
- Crime grade is F in this area — have there been break-ins, vandalism, or insurance claims at this property in the last 3 years? What carrier currently insures it and at what premium?
- What's the average days-on-market for RENTAL listings here right now (not sales)? A rising rental-DOM trend means longer vacancies and softer asking-rent achievability than the comps imply.
- What's the recent tenant-quality profile in this submarket — average credit score on applications, eviction rate, late-payment / NSF rate, and stable-employment percentage? A property-management company in the area should have these aggregated.
- How much new for-sale + rental construction is in the pipeline within 1–3 miles? Heavy new supply typically softens prices + rents 12–24 months out; constrained supply supports both.
Investment metrics
- 1% rule
- 0.97% ✗
- Cap rate
- 7.57%
- Cash-on-cash
- 4.56%
- DSCR
- 1.20
- GRM
- 8.6
CMA / ARV
- ARV (median comp)
- $286,675
- List price
- $237,990
- Delta
- -16.98%
- Verdict
- UNDERPRICED
- Comps
- 20 within 1.0 mi
Projected returns pro-forma
-3.0% appreciation · 0.0% rent growth · sell at horizon
- IRR
- -12.5%
- Equity multiple
- 0.56×
- Total profit
- $-29,208
- Equity at exit
- $35,485
- IRR
- -8.5%
- Equity multiple
- 0.54×
- Total profit
- $-30,849
- Equity at exit
- $20,577
Cash invested: $66,637 (down + closing). Projections, not guarantees.
Landlord ↔ Tenant lean methodology
- Overall (STATE)
- 87 Strongly Landlord-Friendly
- State Texas
- 87 Strongly Landlord-Friendly · R+5
- County
- — inherits STATE
- City
- — inherits STATE
ZIP-level market 77493
- Rents YoY
- -0.8%
- Active inventory
- 2696
- Price-to-rent
- 8.6×
Monthly cashflow live
- Estimated rent
- $2,308 high interval (Pro) →
- Mortgage (P&I)
- −$1,248
- Tax from tax record
- −$40 /mo · $482/yr
- Insurance
- −$99
- HOA
- −$183
- Vacancy / Maint / Mgmt
- −$485
- Net cashflow
- $253
Break-even live
UW: 25.0% down · 7.5% · 30yr · 1.5% tax · 5.0% vac · 8.0% maint · 8.0% mgmt
Financing live
Cash to close
- Down payment
- $59,498
- Closing costs
- $7,140
- Reserves months
- —
- Total cash needed
- —
Loan-product check · same deal, 3 products live
Conventional
25% down · 7.5% · 30yr
- Down + closing
- —
- Monthly P&I
- —
- Monthly cashflow
- —
- DSCR
- —
- Eligible?
- —
Personal DTI + credit; lowest rate.
DSCR
20% down · 8.5% · 30yr
- Down + closing
- —
- Monthly P&I
- —
- Monthly cashflow
- —
- DSCR
- —
- Eligible?
- —
No personal income docs; deal must DSCR.
Hard money
10% down · 12.0% · 12mo
- Down + closing
- —
- Monthly P&I
- —
- Monthly cashflow
- —
- DSCR
- —
- Eligible?
- —
Short-term bridge; refi at stabilization.
Rent comps 17 comps
| Address | Beds | Baths | Sqft | Rent | $/sqft | DOM | Units | Dist |
|---|---|---|---|---|---|---|---|---|
| 6303 Marigold Blaze Dr Katy, TX | 3.0 | 2.0 | 1474 | $2,250 | $1.53 | 43d | 1 | 0.54mi |
| 26811 Prairie Smoke Ln Katy, TX | 4.0 | 2.0 | 1656 | $2,250 | $1.36 | 43d | 1 | 0.64mi |
| 6758 Sunset Velvet Dr Katy, TX | 3.0 | 2.0 | 1580 | $2,350 | $1.49 | 43d | 1 | 0.87mi |
| 27064 Beach Ball Dr Katy, TX | 3.0–4.0 | 2.5–3.5 | 1705 | $2,406 | $1.41 | 1d | 25 | 0.93mi |
| 3081 Fantasy Terrace Dr Katy, TX | 4.0 | 2.0 | 1670 | $2,275 | $1.36 | 24d | 1 | 1.03mi |
| 26802 Cenzontle Dr Katy, TX | 3.0 | 2.0 | 1470 | $1,850 | $1.26 | 43d | 1 | 1.08mi |
| 3064 Dawn Sound Dr Katy, TX | 3.0 | 2.0 | 1464 | $1,950 | $1.33 | 43d | 1 | 1.10mi |
| 3056 Sea Turtle Dr Katy, TX | 4.0 | 2.0 | 1500 | $2,200 | $1.47 | 43d | 1 | 1.14mi |
| 7402 Clover Chase Dr Katy, TX | 4.0 | 3.0 | 1840 | $2,400 | $1.30 | 43d | 1 | 1.18mi |
| 27022 Euphonia Green Ln Katy, TX | 3.0 | 2.0 | 1186 | $1,939 | $1.63 | 2d | 1 | 1.35mi |
| 3057 Majestic Sunrise Dr Katy, TX | 4.0 | 2.0 | 1644 | $2,252 | $1.37 | 24d | 1 | 1.38mi |
| 3048 Majestic Sunrise Dr Katy, TX | 4.0 | 2.0 | 1670 | $2,275 | $1.36 | 24d | 1 | 1.43mi |
| 3004 Majestic Sunrise Dr Katy, TX | 3.0 | 2.0 | 1474 | $1,942 | $1.32 | 43d | 1 | 1.45mi |
| 3020 Wild Dunes Dr Katy, TX | 4.0 | 2.0 | 1776 | $2,355 | $1.33 | 12d | 1 | 1.46mi |
| 3071 Wild Dunes Dr Katy, TX | 3.0 | 2.0 | 1538 | $2,164 | $1.41 | 24d | 1 | 1.48mi |
| 3083 Wild Dunes Dr Katy, TX | 3.0 | 2.0 | 1538 | $2,185 | $1.42 | 12d | 1 | 1.49mi |
| 3037 Wild Dunes Dr Katy, TX | 3.0 | 2.0 | 1538 | $2,164 | $1.41 | 24d | 1 | 1.50mi |
HOA detail
- Monthly dues
- $183 · $2,196/yr
Listing history 20 events
-
2026-06-18days on market $237,990 Active 79 DOM
-
2026-06-17days on market $237,990 Active 78 DOM
-
2026-06-16days on market $237,990 Active 77 DOM
-
2026-06-15remarks 600-char remark
-
2026-06-15days on market $237,990 Active 76 DOM
-
2026-06-13days on market $237,990 Active 74 DOM
-
2026-06-09days on market $237,990 Active 70 DOM
-
2026-06-08days on market $237,990 Active 69 DOM
-
2026-06-07days on market $237,990 Active 68 DOM
-
2026-06-04days on market $237,990 Active 65 DOM
-
2026-06-03days on market $237,990 Active 64 DOM
-
2026-06-02days on market $237,990 Active 63 DOM
-
2026-06-01days on market $237,990 Active 62 DOM
-
2026-05-31days on market $237,990 Active 61 DOM
-
2026-04-09price $237,990 567-char remark
Show marketing remark (567 chars)
The Beckman Floor Plan - This new home is conveniently laid out on a single floor for maximum comfort and convenience. At its heart stands an open-concept layout connecting a spacious family room, a multi-functional kitchen and lovely dining area. The owner’s suite is situated in a private corner and comes complete with an adjoining bathroom, while the two secondary bedrooms are located near the foyer. The completion date, prices and features may vary and are subject to change. Please verify with Lennar directly. Photos are for illustrative purposes only.
-
2026-03-31$247,990 Active 567-char remark
Show marketing remark (567 chars)
The Beckman Floor Plan - This new home is conveniently laid out on a single floor for maximum comfort and convenience. At its heart stands an open-concept layout connecting a spacious family room, a multi-functional kitchen and lovely dining area. The owner’s suite is situated in a private corner and comes complete with an adjoining bathroom, while the two secondary bedrooms are located near the foyer. The completion date, prices and features may vary and are subject to change. Please verify with Lennar directly. Photos are for illustrative purposes only.
-
2026-03-31historical
Show marketing remark (567 chars)
The Beckman Floor Plan - This new home is conveniently laid out on a single floor for maximum comfort and convenience. At its heart stands an open-concept layout connecting a spacious family room, a multi-functional kitchen and lovely dining area. The owner’s suite is situated in a private corner and comes complete with an adjoining bathroom, while the two secondary bedrooms are located near the foyer. The completion date, prices and features may vary and are subject to change. Please verify with Lennar directly. Photos are for illustrative purposes only.
-
2026-03-16$247,990 Active
-
2026-03-16historical
-
2026-03-16$291,990 Active
ⓘ Source: listings_history table (triggers on properties + properties_extension) + one-shot
backfill from property_details.listing_events for pre-trigger history.
Tax reassessment forecast TX · Resets to sale price
- Current annual tax
- $482 · $40/mo
- Projected year-2 tax
- $4,355 · $363/mo
- Expected delta
- +$3,873/yr (+$323/mo · 803.1%)
ⓘ Screening estimate from a state-policy table — verify with the county assessor before closing.
Nearby sold comps map
Loading sold comps map…
Walkable amenities ~0.75 mi
Loading nearby amenities…
Taxation est. · year 1
- Rental income
- $27,702
- − Mortgage interest
- −$13,331
- − Property taxes
- −$482
- − Insurance
- −$1,190
- − Repairs & maintenance
- −$2,216
- − Management
- −$2,216
- − HOA
- −$2,196
- − Depreciation
- −$6,923
- Taxable loss
- −$853
- Est. tax savings @ 24.0%
- +$205
- After-tax cash flow
- $3,244/yr
For passive investors: Depreciation is non-cash, so a rental often shows a tax loss while cash-flowing — sheltering income. Rental losses are passive: they offset passive income freely, and up to $25,000/yr can offset ordinary (W-2) income if you actively participate and your MAGI is under $100k (phasing out to $0 by $150k); unused losses carry forward. On sale, claimed depreciation is recaptured at up to 25%, and gains may owe capital-gains tax (a 1031 exchange can defer both). Figures are a year-1 estimate at your 24.0% rate — not tax advice; consult a CPA.
Schools (NCES district)
- District
- Katy ISD
- NCES district ID
- 4825170
- Math proficiency
- 61% ▼ -7.00%
- Reading proficiency
- 63% ▼ -3.00%
- Median HH income
- $90,312
- Composite
- 56.59/100
- National rank
- #1146
- State rank
- #29 of 826 in TX
Livability — Houston
- Score
- 74/100
- State rank
- #184
- US rank
- #4771
Category grades
Schools grade is shown separately in the Schools card above.
Census & demographics
- County
- Harris County · 4,702,590 people
- City population
- 3,226,434
- Metro
- Houston-The Woodlands-Sugar Land, TX
- Population (ZIP)
- 71,484
- Household income
- $118,464
- Rent vs Own
- Severe rent burden
- 913.0
Population outlook (Harris County) Hauer SSP2
- Today (2025)
- 5,571,493 people
- By 2030
- 6,089,821 · +9.3%
- By 2040
- 7,142,806 · +28.2%
- By 2050
- 8,185,864 · +46.9%
- By 2075
- 10,574,329 · +89.8%
- By 2100
- 12,109,958 · +117.4%
Race, ethnicity, and origin ACS 2023
- Neighborhood character
- Highly diverse neighborhood (Simpson 0.73)
- Race & ethnicity
- White 36% Hispanic / Latino 33% Two or more races 16% Black 15% Asian 12%
- Hispanic origin (detail)
- Mexican 20%
- Common ancestry
- Lithuanian 2% Slovak 1% Italian 1%
- Foreign-born
- 21% · Canada, Vietnam, Jamaica
- Languages at home
- 64% English-only · Spanish 22% Vietnamese 5% French/Haitian/Cajun 4%
Political lean MEDSL · Harris
- 2024 margin
- Lean D (+5.5) · D 52.0% · R 46.4% · Other 1.6%
- 2008→2024 swing
- +3.9pp toward D · 2008: 1.6pp · 2024: 5.5pp
- All cycles
- 2024: D+5.5 2020: D+13.3 2016: D+12.4 2012: D+0.1 2008: D+1.6
Not yet ingested
- Civics
- —
Market trends
- HPI YoY
- ▼ -140.65%
- Current HPI
- 233.1683
- Rent YoY
- ▼ -0.80%
- Metro
- Houston-The Woodlands-Sugar Land, TX
- State GDP YoY
- ▲ 3.95%
- F500 in state
- 110
Industry mix (Fortune 500 HQ in TX)
| Industry | F500 HQs | Revenue |
|---|---|---|
| Energy | 16 | $1,198B |
|
||
| Technology | 5 | $198B |
|
||
| Engineering / Construction | 4 | $72B |
|
||
| Energy Services | 3 | $60B |
|
||
| Utilities | 3 | $41B |
|
||
| Healthcare | 2 | $330B |
|
||
Price history
-4.0% since first listed6 events — show timeline
- 2026-04-09 Price Changed $237,990 HARMLS
- 2026-03-31 Listing Removed — HARMLS
- 2026-03-31 Listed $247,990 HARMLS
- 2026-03-16 Listed $291,990 HARMLS
- 2026-03-16 Listing Removed — HARMLS
- 2026-03-16 Listed $247,990 HARMLS
Cash-flow waterfall
monthlySold comps — $/sqft
last 12 mo · ≤1 miLoading sold comps…