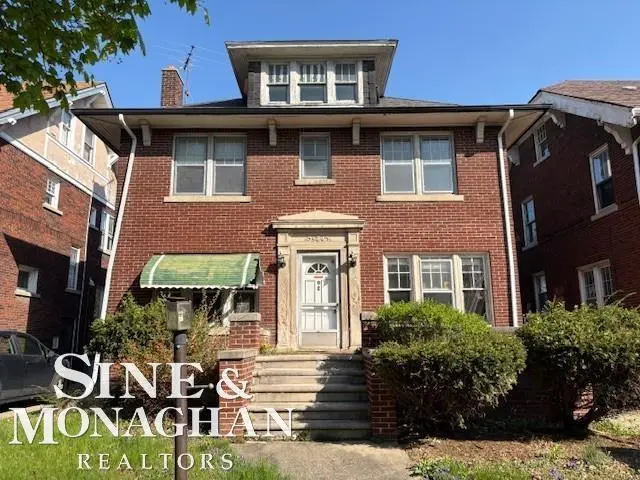
1234 Edison St · Detroit, MI
Flood risk 1/10 · Minimal
- FEMA flood zone
- X (unshaded)
- Chance of flooding over 30 yrs
- 0.0%
- Est. flood insurance / yr
- $507 – $1,088
Fire risk 1/10 · Minimal
- Est. fire insurance / yr
- $784 – $1,456
Heat risk 3/10 · Minor
- Hot days now (above 96°F)
- 7 days/yr
- Hot days in 30 yrs
- 15 days/yr
Wind risk 2/10 · Minimal
- Chance of severe wind over 30 yrs
- —
Air-quality risk 4/10 · Minor
- Unhealthy air days now
- 4 days/yr
- Unhealthy air days in 30 yrs
- 6 days/yr
Risk factors via First Street. Map © Google.
Why this score? — see what drove the C grade
The composite is a weighted blend of 9 inputs, each scored 0–100. Each bar is that input's sub-score; the figure is the points it added to the 100-point composite (weight × sub-score).
- Cash flow +25.2/30.0
- DSCR +8.3/10.0
- ARV discount +7.5/15.0
- 1% rule +6.6/10.0
- Livability +3.7/5.0
- Condition / age +2.5/5.0
- Schools +1.3/10.0
- Rent growth +1.2/5.0
- Appreciation +0.0/10.0
$199,900
🖨 Deal sheet (PDF) 📄 Offer letter ✓ Due diligence
Listing remarks MLS
Back on market due to buyer finance issue. Your chance to grab this deal!! This property is a rehab opportunity! For the owner occupant to create the home of their dreams. .. or for the investor to flip and make money. First come, first served! The Boston-Edison Historic District is anxious for you to be part of the neighborhood!
Key facts
- 5,227 sq ft lot
- 2 garage spots
- Built 1916
Neighborhood map
What this means for you Summary
Snapshot
- This is a 5-bed/2.0-bath single-family listed at $200k.
Deal economics
- At list price, monthly cash flow is $450 ($5k/yr) — positive.
- The deal already cash-flows at list — no discount required.
- Meets the 1% rule at list price ($2k rent vs $200k).
- Recommended offer: $176k (12.0% below list) — sets the bar for market timing.
Location & tenants
- Location reads 73/100 on livability (#218 in MI) — a middle-class / working-renter tenant base. Strengths: amenities A+, commute A+, cost of living A+; Watch: schools F, crime F, employment F.
- Detroit Public Schools Community District (urban): math 10% / reading 24% proficiency, ranked #499 of 540 in MI (top 92%) — low school quality limits family demand, transient renter base, plan for 1-2y turnover; 90% free/reduced lunch — lower-income household profile, screen leases tightly.
- Market conditions: Rents falling (-5.1%/yr); 257 active listings in the ZIP; 16 comparable units currently listed for rent nearby; rentals leasing fast (median 11d on market — plan ~1-2 weeks tenant-placement turnaround); lower-income renter base — watch delinquency; 2,639 units permitted in Wayne County in 2024 (1,216 in 5+ unit buildings).
- At $2,318/mo this rent would consume 64% of the median local household income ($44k/yr) (locally 1258% of renters already pay >50% of income on rent) — very limited rent-growth headroom before tenants either downsize or default.
Forward outlook
- Local home prices are declining (-3.0%/yr); year-one equity from $1k of loan paydown is wiped out by about $6k of value loss. Plan a longer hold.
- Wayne County population projected at -17% by 2050 — secular population decline; favor cash flow + early exit over multi-decade hold.
Negotiation context
- It's been on market 150 days — a 12% lower offer ($176k) is reasonable based on typical stale-listing flexibility.
- 12 sale attempts since 6y ago with the ask held roughly flat each time — persistent listings suggest the price (not the market) is what's stuck; bring a comps-based counter.
- Current owner paid $149k; 34% above their basis — modest negotiation headroom, anchor on the comps not their cost.
Risks & watch-outs
- Watch-outs: built in 1916 — expect roof / HVAC / electrical / plumbing capex.
Questions for the listing agent
- It's been on market 150 days. Have you received any prior offers? Is the seller open to a 12% concession, seller financing, or rate buy-down credit?
- Built in 1916 — when were the roof, HVAC, electrical panel, plumbing, and water heater last replaced?
- Why hasn't it sold? Are there any deal-killer items the seller is aware of (foundation, flood, title, zoning, code violations)?
- Is there a deadline driving the sale (1031 exchange, divorce, estate, relocation)? That informs how much negotiation room exists.
- Schools are F-rated, which usually means shorter tenancies and higher turnover. Who's the typical renter profile here, and what's been the actual vacancy rate?
- Crime grade is F in this area — have there been break-ins, vandalism, or insurance claims at this property in the last 3 years? What carrier currently insures it and at what premium?
- What's the average days-on-market for RENTAL listings here right now (not sales)? A rising rental-DOM trend means longer vacancies and softer asking-rent achievability than the comps imply.
- What's the recent tenant-quality profile in this submarket — average credit score on applications, eviction rate, late-payment / NSF rate, and stable-employment percentage? A property-management company in the area should have these aggregated.
- How much new for-sale + rental construction is in the pipeline within 1–3 miles? Heavy new supply typically softens prices + rents 12–24 months out; constrained supply supports both.
Investment metrics
- 1% rule
- 1.16% ✓
- Cap rate
- 8.99%
- Cash-on-cash
- 9.64%
- DSCR
- 1.43
- GRM
- 7.2
CMA / ARV
- ARV (median comp)
- $408,689
- List price
- $199,900
- Delta
- -51.09%
- Verdict
- UNDERPRICED
- Comps
- 20 within 1.0 mi
Show comp detail 12 sales within ~0.75 mi
| Address | Dist | Beds/Ba | Sqft | Sold | Price | $/sf | Match |
|---|---|---|---|---|---|---|---|
| 1419 Atkinson St | 0.12mi | 5/2.5 | 2,274 (+2%) | 1mo | $225,000 | $99 | 89 |
| 1441 Longfellow St | 0.10mi | 5/2.5 | 2,463 (+10%) | 2mo | $166,000 | $67 | 75 |
| 686 Atkinson St S | 0.38mi | 5/2.5 | 2,384 (+6%) | 1mo | $195,000 | $82 | 69 |
| 1727 Edison St | 0.34mi | 4/2.5 (-1) | 2,410 (+8%) | 4mo | $117,000 | $49 | 62 |
| 2041 Atkinson St | 0.53mi | 4/2.5 (-1) | 2,308 (+3%) | 2mo | $235,000 | $102 | 61 |
| 1667 Edison St | 0.28mi | 5/2.5 | 2,569 (+15%) | 2mo | $439,900 | $171 | 59 |
| 2011 Atkinson St | 0.50mi | 4/2.0 (-1) | 2,084 (-7%) | 3mo | $245,000 | $118 | 58 |
| 2016 Atkinson St | 0.50mi | 5/2.5 | 2,001 (-11%) | 3mo | $130,000 | $65 | 54 |
| 80 Glynn Ct | 0.63mi | 4/2.0 (-1) | 2,058 (-8%) | 0mo | $365,000 | $177 | 52 |
| 2281 Atkinson St | 0.66mi | 4/1.5 (-1) | 2,103 (-6%) | 4mo | $325,000 | $155 | 49 |
| 100 Taylor St | 0.57mi | 4/2.5 (-1) | 2,486 (+11%) | 3mo | $140,000 | $56 | 46 |
| 693 Calvert St | 0.50mi | 4/1.5 (-1) | 1,914 (-14%) | 4mo | $109,000 | $57 | 42 |
Match score weights: distance 35% · size 25% · config 20% · recency 20%. Top-matched comps best support the ARV.
Projected returns pro-forma
-3.0% appreciation · 0.0% rent growth · sell at horizon
- IRR
- -5.2%
- Equity multiple
- 0.81×
- Total profit
- $-10,520
- Equity at exit
- $29,806
- IRR
- 0.5%
- Equity multiple
- 1.03×
- Total profit
- $1,598
- Equity at exit
- $17,284
Cash invested: $55,972 (down + closing). Projections, not guarantees.
Landlord ↔ Tenant lean methodology
- Overall (STATE)
- 62 Landlord-Friendly
- State Michigan
- 62 Landlord-Friendly · EVEN
- County
- — inherits STATE
- City
- — inherits STATE
ZIP-level market 48202
- Rents YoY
- -5.1%
- Active inventory
- 257
- Price-to-rent
- 7.2×
Monthly cashflow live
- Estimated rent
- $2,318 high interval (Pro) →
- Mortgage (P&I)
- −$1,048
- Tax est. 1.5%
- −$250 /mo · $2,998/yr
- Insurance
- −$83
- HOA
- −$0
- Vacancy / Maint / Mgmt
- −$487
- Net cashflow
- $450
Break-even live
Sensitivity live
| Price | -10% $588 | -5% $519 | +0% $450 | +5% $380 | +10% $311 |
|---|---|---|---|---|---|
| Rent | -10% $266 | -5% $358 | +0% $450 | +5% $541 | +10% $633 |
| Rate | -1.0pp $550 | -0.5pp $500 | base $450 | +0.5pp $398 | +1.0pp $345 |
UW: 25.0% down · 7.5% · 30yr · 1.5% tax · 5.0% vac · 8.0% maint · 8.0% mgmt
Financing live
Cash to close
- Down payment
- $49,975
- Closing costs
- $5,997
- Reserves months
- —
- Total cash needed
- —
Loan-product check · same deal, 3 products live
Conventional
25% down · 7.5% · 30yr
- Down + closing
- —
- Monthly P&I
- —
- Monthly cashflow
- —
- DSCR
- —
- Eligible?
- —
Personal DTI + credit; lowest rate.
DSCR
20% down · 8.5% · 30yr
- Down + closing
- —
- Monthly P&I
- —
- Monthly cashflow
- —
- DSCR
- —
- Eligible?
- —
No personal income docs; deal must DSCR.
Hard money
10% down · 12.0% · 12mo
- Down + closing
- —
- Monthly P&I
- —
- Monthly cashflow
- —
- DSCR
- —
- Eligible?
- —
Short-term bridge; refi at stabilization.
Rent comps 16 comps
| Address | Beds | Baths | Sqft | Rent | $/sqft | DOM | Units | Dist |
|---|---|---|---|---|---|---|---|---|
| 1699 Glynn Ct Detroit, MI | 5.0 | 3.5 | 2542 | $2,500 | $0.98 | 22d | 1 | 0.42mi |
| 2028 Gladstone St Unit 1 Detroit, MI | 5.0 | 2.0 | 2500 | $2,850 | $1.14 | 3d | 1 | 0.62mi |
| 2080 Gladstone St #1 Detroit, MI | 4.0 | 2.0 | 2426 | $3,000 | $1.24 | 2d | 1 | 0.66mi |
| 8951 La Salle Blvd Detroit, MI | 4.0 | 2.5 | 2440 | $2,500 | $1.02 | 2d | 1 | 0.80mi |
| 8951 La Salle Blvd Detroit, MI | 5.0 | 2.5 | 2440 | $2,500 | $1.02 | 15d | 1 | 0.80mi |
| 8951 La Salle Blvd Unit NA Detroit, MI | 4.0 | 2.5 | 2440 | $2,500 | $1.02 | 10d | 1 | 0.80mi |
| 216 Holbrook St Detroit, MI | 4.0 | 2.0 | 2000 | $2,000 | $1.00 | 22d | 1 | 0.83mi |
| 216 Holbrook Unit Na Detroit, MI | 4.0 | 2.0 | 2000 | $2,200 | $1.10 | 2d | 1 | 0.83mi |
| 41 Richton St Highland Park, MI | 5.0 | 2.0 | 1871 | $1,800 | $0.96 | 2d | 1 | 0.99mi |
| 41 Richton St Highland Park, MI | 5.0 | 2.0 | 1871 | $1,800 | $0.96 | 15d | 1 | 0.99mi |
| 2655 Collingwood St Detroit, MI | 4.0 | 1.5 | 1881 | $2,700 | $1.44 | 2d | 1 | 1.04mi |
| 64 Glendale St Highland Park, MI | 4.0 | 1.0 | 1464 | $1,500 | $1.02 | 10d | 1 | 1.23mi |
| 3031 Lawrence St Detroit, MI | 4.0 | 1.0 | 1700 | $1,600 | $0.94 | 17d | 1 | 1.28mi |
| 101 Colorado St Unit NA Highland Park, MI | 4.0 | 1.5 | 1695 | $1,780 | $1.05 | 0d | 1 | 1.32mi |
| 165 Rhode Island St Highland Park, MI | 4.0 | 1.5 | 1639 | $1,200 | $0.73 | 18d | 1 | 1.34mi |
| 3241 Lawrence St Detroit, MI | 4.0 | 2.0 | 2636 | $1,800 | $0.68 | 17d | 1 | 1.35mi |
Listing history 37 events
-
2026-06-18days on market $199,900 Active 150 DOM
-
2026-06-17days on market $199,900 Active 149 DOM
-
2026-06-15days on market $199,900 Active 147 DOM
-
2026-06-13days on market $199,900 Active 145 DOM
-
2026-06-13days on market $199,900 Active 144 DOM
-
2026-06-09days on market $199,900 Active 141 DOM
-
2026-06-08days on market $199,900 Active 140 DOM
-
2026-06-07days on market $199,900 Active 139 DOM
-
2026-06-04days on market $199,900 Active 136 DOM
-
2026-06-03days on market $199,900 Active 135 DOM
-
2026-06-01days on market $199,900 Active 133 DOM
-
2026-05-31days on market $199,900 Active 132 DOM
-
2026-04-17status Active 332-char remark
Show marketing remark (332 chars)
Back on market due to buyer finance issue. Your chance to grab this deal!! This property is a rehab opportunity! For the owner occupant to create the home of their dreams. .. or for the investor to flip and make money. First come, first served! The Boston-Edison Historic District is anxious for you to be part of the neighborhood!
-
2026-04-17status Back on Market 332-char remark
Show marketing remark (332 chars)
Back on market due to buyer finance issue. Your chance to grab this deal!! This property is a rehab opportunity! For the owner occupant to create the home of their dreams. .. or for the investor to flip and make money. First come, first served! The Boston-Edison Historic District is anxious for you to be part of the neighborhood!
-
2026-03-17historical Active Under Contract 332-char remark
Show marketing remark (332 chars)
Back on market due to buyer finance issue. Your chance to grab this deal!! This property is a rehab opportunity! For the owner occupant to create the home of their dreams. .. or for the investor to flip and make money. First come, first served! The Boston-Edison Historic District is anxious for you to be part of the neighborhood!
-
2026-03-17historical Accepting Backup Offers 332-char remark
Show marketing remark (332 chars)
Back on market due to buyer finance issue. Your chance to grab this deal!! This property is a rehab opportunity! For the owner occupant to create the home of their dreams. .. or for the investor to flip and make money. First come, first served! The Boston-Edison Historic District is anxious for you to be part of the neighborhood!
-
2026-01-19$199,900 Active 332-char remark
Show marketing remark (332 chars)
Back on market due to buyer finance issue. Your chance to grab this deal!! This property is a rehab opportunity! For the owner occupant to create the home of their dreams. .. or for the investor to flip and make money. First come, first served! The Boston-Edison Historic District is anxious for you to be part of the neighborhood!
-
2023-04-04historical
-
2023-04-04historical
-
2022-12-19$399,000 Active
-
2022-12-19$399,000 Active
-
2022-07-20historical
-
2022-07-20historical
-
2022-04-10status Active
-
2022-03-18status Active
-
2022-03-10historical
-
2022-03-09historical
-
2022-03-05$324,900 Active
-
2022-03-05$324,900 Active
-
2021-01-25soldstatus $149,000 Sold
-
2021-01-25soldstatus $149,000 Closed
-
2020-12-21status Pending
-
2020-12-21historical
-
2020-12-01historical Accepting Backup Offers
-
2020-11-04$175,000 Active
-
2020-11-04$175,000
ⓘ Source: listings_history table (triggers on properties + properties_extension) + one-shot
backfill from property_details.listing_events for pre-trigger history.
Climate risk First Street
- Flood 1/10 Low FEMA zone X (unshaded) · 0% chance over 30 yrs
- Wildfire 1/10 Low
- Heat 3/10 Moderate 7 d/yr ≥96°F today · 15 d/yr by 30 yrs out
- Wind 2/10 Low
- Air quality 4/10 Moderate 4 unhealthy d/yr today · 6 by 30 yrs out
Nearby sold comps map
Loading sold comps map…
Walkable amenities ~0.75 mi
Loading nearby amenities…
Taxation est. · year 1
- Rental income
- $27,812
- − Mortgage interest
- −$11,198
- − Property taxes
- −$2,998
- − Insurance
- −$1,000
- − Repairs & maintenance
- −$2,225
- − Management
- −$2,225
- − Depreciation
- −$5,815
- Taxable income
- $2,352
- Est. tax owed @ 24.0%
- −$564
- After-tax cash flow
- $4,830/yr
For passive investors: Depreciation is non-cash, so a rental often shows a tax loss while cash-flowing — sheltering income. Rental losses are passive: they offset passive income freely, and up to $25,000/yr can offset ordinary (W-2) income if you actively participate and your MAGI is under $100k (phasing out to $0 by $150k); unused losses carry forward. On sale, claimed depreciation is recaptured at up to 25%, and gains may owe capital-gains tax (a 1031 exchange can defer both). Figures are a year-1 estimate at your 24.0% rate — not tax advice; consult a CPA.
Schools (NCES district)
- District
- Detroit Public Schools Community District
- NCES district ID
- 2601103
- Math proficiency
- 10% ▼ -2.00%
- Reading proficiency
- 24% ▲ 6.00%
- Median HH income
- $25,815
- Composite
- 13.06/100
- National rank
- #9564
- State rank
- #499 of 540 in MI
Livability — Detroit
- Score
- 73/100
- State rank
- #218
- US rank
- #5427
Category grades
Schools grade is shown separately in the Schools card above.
Census & demographics
- Census place
- Detroit, MI
- County
- Wayne County · 1,562,939 people
- City population
- 572,865
- Metro
- Detroit-Warren-Dearborn, MI
- Population (ZIP)
- 15,780
- Household income
- $43,627
- Rent vs Own
- Severe rent burden
- 1258.0
Population outlook (Wayne County) Hauer SSP2
- Today (2025)
- 1,675,273 people
- By 2030
- 1,620,300 · -3.3%
- By 2040
- 1,502,341 · -10.3%
- By 2050
- 1,384,039 · -17.4%
- By 2075
- 1,124,592 · -32.9%
- By 2100
- 881,193 · -47.4%
Race, ethnicity, and origin ACS 2023
- Neighborhood character
- Diverse neighborhood (Simpson 0.57)
- Race & ethnicity
- Black 60% White 26% Asian 6% Two or more races 4% Hispanic / Latino 3%
- Common ancestry
- Romanian 3% Slovak 1% Lithuanian 1%
- Foreign-born
- 8% · Canada, Vietnam
- Languages at home
- 90% English-only · Other Indo-European 3% Arabic 2% Spanish 2%
Political lean MEDSL · Wayne
- 2024 margin
- Strong D (+29.0) · D 62.7% · R 33.7% · Other 3.6%
- 2008→2024 swing
- -20.5pp toward R · 2008: 49.5pp · 2024: 29.0pp
- All cycles
- 2024: D+29.0 2020: D+38.1 2016: D+37.3 2012: D+46.9 2008: D+49.5
Not yet ingested
- Civics
- —
Market trends
- HPI YoY
- ▼ -239.24%
- Current HPI
- 145.5509
- Rent YoY
- ▼ -5.13%
- Metro
- Detroit-Warren-Dearborn, MI
- State GDP YoY
- ▲ 1.37%
- F500 in state
- 28
Industry mix (Fortune 500 HQ in MI)
| Industry | F500 HQs | Revenue |
|---|---|---|
| Automotive Parts | 3 | $48B |
|
||
| Automotive | 2 | $372B |
|
||
| Chemicals | 1 | $45B |
|
||
| Automotive Retail | 1 | $29B |
|
||
| Healthcare / Medical Devices | 1 | $23B |
|
||
| Automotive Technology | 1 | $20B |
|
||
Price history
+14.2% since first listed25 events — show timeline
- 2026-04-17 Relisted — REALCOMP
- 2026-04-17 Relisted — MiRealSource-MiMLS
- 2026-03-17 Contingent — REALCOMP
- 2026-03-17 Contingent — MiRealSource-MiMLS
- 2026-01-19 Listed $199,900 REALCOMP
- 2026-01-19 Listed $199,900 MiRealSource-MiMLS
- 2023-04-04 Listing Removed — MiRealSource-MiMLS
- 2023-04-04 Listing Removed — REALCOMP
- 2022-12-19 Listed $399,000 MiRealSource-MiMLS
- 2022-12-19 Listed $399,000 REALCOMP
- 2022-07-20 Listing Removed — REALCOMP
- 2022-07-20 Listing Removed — MiRealSource-MiMLS
- 2022-04-10 Relisted — MiRealSource-MiMLS
- 2022-03-18 Relisted — REALCOMP
- 2022-03-10 Listing Removed — MiRealSource-MiMLS
- 2022-03-09 Listing Removed — REALCOMP
- 2022-03-05 Listed $324,900 MiRealSource-MiMLS
- 2022-03-05 Listed $324,900 REALCOMP
- 2021-01-25 Sold (MLS) $149,000 MiRealSource-MiMLS
- 2021-01-25 Sold (MLS) $149,000 REALCOMP
- 2020-12-21 Pending — REALCOMP
- 2020-12-21 Listing Removed — MiRealSource-MiMLS
- 2020-12-01 Contingent — REALCOMP
- 2020-11-04 Listed $175,000 MiRealSource-MiMLS
- 2020-11-04 Listed $175,000 REALCOMP
Property tax history
+20.3%/yrLatest (2025): $12,565 · -54.7% YoY. Source: county tax records.
Cash-flow waterfall
monthlySold comps — $/sqft
last 12 mo · ≤1 miLoading sold comps…