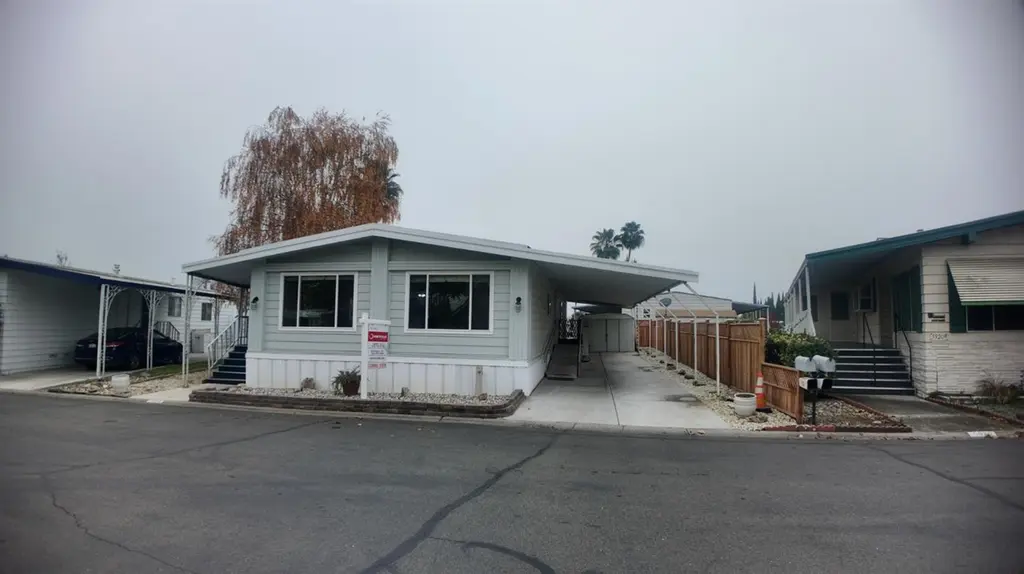
5924 Mallard Ln #231 · Citrus Heights, CA
Flood risk 1/10 · Minimal
- FEMA flood zone
- X (unshaded)
- Chance of flooding over 30 yrs
- 0.0%
- Est. flood insurance / yr
- $507 – $1,088
Fire risk 2/10 · Minimal
- Est. fire insurance / yr
- $659 – $1,223
Heat risk 7/10 · Major
- Hot days now (above 103°F)
- 7 days/yr
- Hot days in 30 yrs
- 15 days/yr
Wind risk 1/10 · Minimal
- Chance of severe wind over 30 yrs
- —
Air-quality risk 10/10 · Severe
- Unhealthy air days now
- 34 days/yr
- Unhealthy air days in 30 yrs
- 36 days/yr
Risk factors via First Street. Map © Google.
Why this score? — see what drove the B+ grade
The composite is a weighted blend of 9 inputs, each scored 0–100. Each bar is that input's sub-score; the figure is the points it added to the 100-point composite (weight × sub-score).
- Cash flow +30.0/30.0
- ARV discount +13.3/15.0
- 1% rule +10.0/10.0
- DSCR +10.0/10.0
- Schools +4.4/10.0
- Rent growth +3.0/5.0
- Livability +3.0/5.0
- Condition / age +2.5/5.0
- Appreciation +0.0/10.0
$129,850
🖨 Deal sheet 📄 Offer letter ✓ Due diligence
Listing remarks
Beautifully cared-for double-wide manufactured home located in the desirable Sierra Meadows Mobile Home Estates, a gated 55+ community (primary resident must be 55+, secondary 45+). A recent home inspection by a certified home inspector was completed, the home received a clean report, and the report is available to all buyers upon request. This home features numerous updates including dual-pane windows throughout, newer appliances, newer wood-style flooring, replaced water lines, and a newer central air conditioning system. The bright, open floor plan offers vaulted ceilings, generous natural light, and abundant built-in cabinetry. The spacious kitchen includes a dining bar, pantry closet,
Key facts
- Gated community
- Dual-pane windows
- Newer appliances
Tags
Neighborhood map
What this means for you Summary
Snapshot
- This is a 2-bed/2.0-bath manufactured listed at $130k.
Deal economics
- At list price, monthly cash flow is $848 ($10k/yr) — positive.
- The deal already cash-flows at list — no discount required.
- Meets the 1% rule at list price ($2k rent vs $130k).
- Recommended offer: $114k (12.0% below list) — sets the bar for market timing.
- Cap rate 14.1% vs local median 3.4% in Citrus Heights — top-decile yield for the area; either an underpriced asset or a hidden risk that comps aren't pricing in. Stress-test before assuming the spread holds.
Location & tenants
- Location reads 60/100 on livability (#614 in CA) — a middle-class / working-renter tenant base. Strengths: housing A+; Watch: schools D, crime D-, amenities F.
- San Juan Unified (suburban): math 40% / reading 62% proficiency, ranked #138 of 517 in CA (top 27%) — acceptable for families but not a draw, mixed tenant base, ~2y average lease.
- Market conditions: Rents rising (+1.9%/yr); 210 active listings in the ZIP; 18 comparable units currently listed for rent nearby; rentals leasing fast (median 11d on market — plan ~1-2 weeks tenant-placement turnaround); solid renter incomes; 6,825 units permitted in Sacramento County in 2024 (1,752 in 5+ unit buildings).
- This rent runs 32% of the median local income ($81k/yr) — at the standard rent-burdened threshold; future hikes will face affordability resistance.
Forward outlook
- Local home prices are declining (-3.0%/yr); year-one equity from $898 of loan paydown is wiped out by about $4k of value loss. Plan a longer hold.
- Sacramento County population projected at +17% by 2050 — long-run rental-demand tailwind backs the buy-and-hold thesis.
- At projected returns (-3.0% appreciation + 1.9% rent growth), your $36k cash investment doubles in ~5 years — after that, you're playing with house money.
Negotiation context
- It's been on market 168 days — a 12% lower offer ($114k) is reasonable based on typical stale-listing flexibility.
Risks & watch-outs
- Climate carrying-cost: extreme-heat days projected 7→15/yr by 2055 (HVAC capex compounding) — expect insurance premiums to compound above CPI over the hold.
Questions for the listing agent
- It's been on market 168 days. Have you received any prior offers? Is the seller open to a 12% concession, seller financing, or rate buy-down credit?
- Built in 1977 — when were the roof, HVAC, electrical panel, plumbing, and water heater last replaced?
- Why hasn't it sold? Are there any deal-killer items the seller is aware of (foundation, flood, title, zoning, code violations)?
- Is there a deadline driving the sale (1031 exchange, divorce, estate, relocation)? That informs how much negotiation room exists.
- Schools are D-rated, which usually means shorter tenancies and higher turnover. Who's the typical renter profile here, and what's been the actual vacancy rate?
- Crime grade is D in this area — have there been break-ins, vandalism, or insurance claims at this property in the last 3 years? What carrier currently insures it and at what premium?
- What's the average days-on-market for RENTAL listings here right now (not sales)? A rising rental-DOM trend means longer vacancies and softer asking-rent achievability than the comps imply.
- What's the recent tenant-quality profile in this submarket — average credit score on applications, eviction rate, late-payment / NSF rate, and stable-employment percentage? A property-management company in the area should have these aggregated.
- How much new for-sale + rental construction is in the pipeline within 1–3 miles? Heavy new supply typically softens prices + rents 12–24 months out; constrained supply supports both.
Investment metrics
- 1% rule
- 1.67% ✓
- Cap rate
- 14.13%
- Cash-on-cash
- 27.98%
- DSCR
- 2.24
- GRM
- 5.0
CMA / ARV
- ARV (median comp)
- $148,960
- List price
- $129,850
- Delta
- -12.83%
- Verdict
- UNDERPRICED
- Comps
- 20 within 1.0 mi
Show comp detail 12 sales within ~0.75 mi
| Address | Dist | Beds/Ba | Sqft | Sold | Price | $/sf | Match |
|---|---|---|---|---|---|---|---|
| 7547 Golden Eye Ln #123 | 0.10mi | 3/2.0 (+1) | 1,480 (+3%) | 2mo | $147,182 | $99 | 84 |
| 7633 Woodduck Ln #67 | 0.15mi | 3/2.0 (+1) | 1,440 (0%) | 7mo | $89,450 | $62 | 83 |
| 6008 Cackler Ln #88 | 0.13mi | 2/2.0 | 1,344 (-7%) | 3mo | $94,500 | $70 | 80 |
| 7412 Newport Ln #144 | 0.22mi | 3/2.0 (+1) | 1,440 (0%) | 9mo | $117,000 | $81 | 77 |
| 7508 Bufflehead Ln | 0.08mi | 3/2.0 (+1) | 1,560 (+8%) | 1mo | $165,000 | $106 | 77 |
| 5836 Stonyford | 0.28mi | 3/2.0 (+1) | 1,440 (0%) | 10mo | $155,900 | $108 | 74 |
| 7533 Pintail Cir | 0.02mi | 3/2.0 (+1) | 1,620 (+12%) | 1mo | $232,500 | $144 | 72 |
| 7625 Pintail Cir | 0.09mi | 3/2.0 (+1) | 1,550 (+8%) | 9mo | $114,500 | $74 | 71 |
| 5913 Cackler Ln #62 | 0.14mi | 2/2.0 | 1,244 (-14%) | 1mo | $126,000 | $101 | 70 |
| 7535 Golden Eye Ln #126 | 0.10mi | 3/2.0 (+1) | 1,608 (+12%) | 2mo | $199,800 | $124 | 70 |
| 6032 Canvasback Ln | 0.12mi | 2/2.0 | 1,582 (+10%) | 10mo | $119,000 | $75 | 69 |
| 7516 Scaup Ln | 0.09mi | 2/2.0 | 1,248 (-13%) | 7mo | $123,000 | $99 | 68 |
Match score weights: distance 35% · size 25% · config 20% · recency 20%. Top-matched comps best support the ARV.
Projected returns pro-forma
-3.0% appreciation · 1.9% rent growth · sell at horizon
- IRR
- 20.9%
- Equity multiple
- 1.84×
- Total profit
- $30,585
- Equity at exit
- $19,361
- IRR
- 28.3%
- Equity multiple
- 3.38×
- Total profit
- $86,668
- Equity at exit
- $11,227
Cash invested: $36,358 (down + closing). Projections, not guarantees.
Landlord ↔ Tenant lean methodology
- Overall (STATE)
- 18 Strongly Tenant-Friendly
- State California
- 18 Strongly Tenant-Friendly · D+13
- County
- — inherits STATE
- City
- — inherits STATE
ZIP-level market 95621
- Rents YoY
- 1.9%
- Active inventory
- 210
- Price-to-rent
- 5.0×
Monthly cashflow live
- Estimated rent
- $2,172 high interval (Pro) →
- Mortgage (P&I)
- −$681
- Tax from tax record
- −$133 /mo · $1,600/yr
- Insurance
- −$54
- HOA
- −$0
- Vacancy / Maint / Mgmt
- −$456
- Net cashflow
- $848
Break-even live
UW: 25.0% down · 7.5% · 30yr · 1.5% tax · 5.0% vac · 8.0% maint · 8.0% mgmt
Financing live
Cash to close
- Down payment
- $32,462
- Closing costs
- $3,896
- Reserves months
- —
- Total cash needed
- —
Loan-product check · same deal, 3 products live
Conventional
25% down · 7.5% · 30yr
- Down + closing
- —
- Monthly P&I
- —
- Monthly cashflow
- —
- DSCR
- —
- Eligible?
- —
Personal DTI + credit; lowest rate.
DSCR
20% down · 8.5% · 30yr
- Down + closing
- —
- Monthly P&I
- —
- Monthly cashflow
- —
- DSCR
- —
- Eligible?
- —
No personal income docs; deal must DSCR.
Hard money
10% down · 12.0% · 12mo
- Down + closing
- —
- Monthly P&I
- —
- Monthly cashflow
- —
- DSCR
- —
- Eligible?
- —
Short-term bridge; refi at stabilization.
Rent comps 18 comps
| Address | Beds | Baths | Sqft | Rent | $/sqft | DOM | Units | Dist |
|---|---|---|---|---|---|---|---|---|
| 7761 Pompei Ct Unit 7763 Citrus Heights, CA | 2.0 | 1.0 | 900 | $1,705 | $1.89 | 23d | 1 | 0.44mi |
| 6413 Tupelo Dr Citrus Heights, CA | 1.0–2.0 | 1.0–2.0 | 775 | $2,000 | $2.58 | 1d | 10 | 0.49mi |
| 7827 Zenith Dr Citrus Heights, CA | 2.0 | 2.0 | 1031 | $1,995 | $1.94 | 14d | 1 | 0.61mi |
| 7915 Zenith Dr Citrus Heights, CA | 2.0 | 1.0 | 1015 | $1,895 | $1.87 | 21d | 1 | 0.70mi |
| 5411 Vichy Cir Antelope, CA | 2.0 | 2.0 | 886 | $2,375 | $2.68 | 1d | 1 | 0.84mi |
| 6319 Misty Wood Way Citrus Heights, CA | 3.0 | 2.0 | 1454 | $2,500 | $1.72 | 43d | 1 | 0.87mi |
| 7613 Luzern Way Antelope, CA | 3.0 | 2.0 | 1401 | $2,500 | $1.78 | 11d | 1 | 0.97mi |
| 7629 Downing Place Way Antelope, CA | 3.0 | 2.0 | 1200 | $2,600 | $2.17 | 1d | 1 | 1.04mi |
| 7120 Van Maren Ln Citrus Heights, CA | 3.0 | 2.0 | 1292 | $2,495 | $1.93 | 17d | 1 | 1.07mi |
| 7135 Cobalt Way Citrus Heights, CA | 3.0 | 1.0 | 1200 | $1,995 | $1.66 | 3d | 1 | 1.16mi |
| 6940 Trailride Way Citrus Heights, CA | 3.0 | 2.0 | 1527 | $2,695 | $1.76 | 43d | 1 | 1.20mi |
| 7137 Reyn Oaks Way Sacramento, CA | 3.0 | 2.0 | 1279 | $2,450 | $1.92 | 1d | 1 | 1.28mi |
| 7137 Reyn Oaks Way Sacramento, CA | 3.0 | 2.0 | 1279 | $2,455 | $1.92 | 11d | 1 | 1.28mi |
| 7139 Baranga Dr Citrus Heights, CA | 3.0 | 1.5 | 1162 | $2,500 | $2.15 | 1d | 1 | 1.31mi |
| 6841 Concert Way Sacramento, CA | 2.0 | 2.0 | 1000 | $1,995 | $2.00 | 1d | 1 | 1.35mi |
| 4901 Adorn Ct Sacramento, CA | 3.0 | 2.0 | 1361 | $2,450 | $1.80 | 1d | 1 | 1.47mi |
| 5417 Olympic Way Sacramento, CA | 2.0 | 1.0 | 920 | $1,795 | $1.95 | 14d | 1 | 1.49mi |
| 7330 Stratford Pl #706 Sacramento, CA | 3.0 | 2.0 | 1322 | $2,600 | $1.97 | 1d | 1 | 1.50mi |
Listing history 1 events
-
2026-05-31status $129,850 Pending 168 DOM
ⓘ Source: listings_history table (triggers on properties + properties_extension) + one-shot
backfill from property_details.listing_events for pre-trigger history.
Tax reassessment forecast CA · Resets to sale price
- Current annual tax
- $1,600 · $133/mo
- Projected year-2 tax
- $1,600 · $133/mo
- Expected delta
- $0/yr ($0/mo · 0.0%)
ⓘ Screening estimate from a state-policy table — verify with the county assessor before closing.
Climate risk First Street
- Flood 1/10 Low FEMA zone X (unshaded) · 0% chance over 30 yrs
- Wildfire 2/10 Low
- Heat 7/10 Severe 7 d/yr ≥103°F today · 15 d/yr by 30 yrs out
- Wind 1/10 Low
- Air quality 10/10 Extreme 34 unhealthy d/yr today · 36 by 30 yrs out
Nearby sold comps map
Loading sold comps map…
Walkable amenities ~0.75 mi
Loading nearby amenities…
Taxation est. · year 1
- Rental income
- $26,067
- − Mortgage interest
- −$7,274
- − Property taxes
- −$1,600
- − Insurance
- −$649
- − Repairs & maintenance
- −$2,085
- − Management
- −$2,085
- − Depreciation
- −$3,777
- Taxable income
- $8,596
- Est. tax owed @ 24.0%
- −$2,063
- After-tax cash flow
- $8,109/yr
For passive investors: Depreciation is non-cash, so a rental often shows a tax loss while cash-flowing — sheltering income. Rental losses are passive: they offset passive income freely, and up to $25,000/yr can offset ordinary (W-2) income if you actively participate and your MAGI is under $100k (phasing out to $0 by $150k); unused losses carry forward. On sale, claimed depreciation is recaptured at up to 25%, and gains may owe capital-gains tax (a 1031 exchange can defer both). Figures are a year-1 estimate at your 24.0% rate — not tax advice; consult a CPA.
Schools (NCES district)
- District
- San Juan Unified
- NCES district ID
- 0634620
- Math proficiency
- 40% ▲ 3.00%
- Reading proficiency
- 62% ▲ 16.00%
- Median HH income
- $55,655
- Composite
- 44.07/100
- National rank
- #2878
- State rank
- #138 of 517 in CA
Livability — Citrus Heights
- Score
- 60/100
- State rank
- #614
- US rank
- #19580
Category grades
Schools grade is shown separately in the Schools card above.
Census & demographics
- Census place
- Citrus Heights, CA
- County
- Sacramento County · 1,539,646 people
- City population
- 89,370
- Metro
- Sacramento-Roseville-Folsom, CA
- Population (ZIP)
- 42,442
- Household income
- $80,901
- Rent vs Own
- Severe rent burden
- 1854.0
Population outlook (Sacramento County) Hauer SSP2
- Today (2025)
- 1,660,763 people
- By 2030
- 1,732,990 · +4.3%
- By 2040
- 1,855,755 · +11.7%
- By 2050
- 1,941,335 · +16.9%
- By 2075
- 2,046,162 · +23.2%
- By 2100
- 1,961,444 · +18.1%
Race, ethnicity, and origin ACS 2023
- Neighborhood character
- Predominantly White (66%)
- Race & ethnicity
- White 66% Hispanic / Latino 19% Two or more races 11% Asian 6% Black 2%
- Hispanic origin (detail)
- Mexican 16%
- Common ancestry
- Subsaharan African 3% Lithuanian 3% Scotch-Irish 2%
- Foreign-born
- 15% · Canada, Vietnam
- Languages at home
- 78% English-only · Spanish 10% Russian/Polish/Slavic 6% Other Indo-European 3%
Political lean MEDSL · Sacramento
- 2024 margin
- D (+19.7) · D 58.1% · R 38.4% · Other 3.5%
- 2008→2024 swing
- +0.7pp no change · 2008: 19.0pp · 2024: 19.7pp
- All cycles
- 2024: D+19.7 2020: D+25.3 2016: D+23.7 2012: D+16.3 2008: D+19.0
Not yet ingested
- Civics
- —
Market trends
- HPI YoY
- ▼ -408.14%
- Current HPI
- 351.9333
- Rent YoY
- ▲ 1.90%
- Metro
- Sacramento-Roseville-Folsom, CA
- State GDP YoY
- ▲ 3.21%
- F500 in state
- 116
Industry mix (Fortune 500 HQ in CA)
| Industry | F500 HQs | Revenue |
|---|---|---|
| Technology | 27 | $1,492B |
|
||
| Financial Services | 3 | $174B |
|
||
| Retail | 3 | $44B |
|
||
| Insurance | 3 | $26B |
|
||
| Media / Entertainment | 2 | $115B |
|
||
| Pharmaceuticals / Biotech | 2 | $62B |
|
||
Property tax history
+12.4%/yrLatest (2025): $1,600 · +383.8% YoY. Source: county tax records.
Cash-flow waterfall
monthlySold comps — $/sqft
last 12 mo · ≤1 miLoading sold comps…