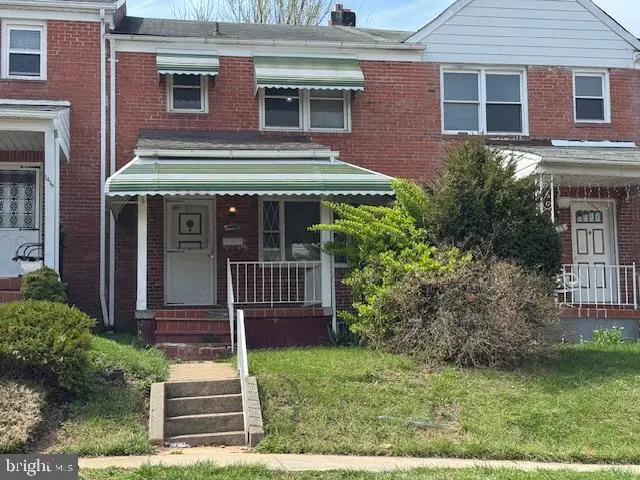
1418 N Linwood Ave · Baltimore, MD
Flood risk 1/10 · Minimal
- FEMA flood zone
- X (unshaded)
- Chance of flooding over 30 yrs
- 0.0%
- Est. flood insurance / yr
- $473 – $860
Fire risk 1/10 · Minimal
- Est. fire insurance / yr
- $755 – $1,403
Heat risk 7/10 · Major
- Hot days now (above 103°F)
- 7 days/yr
- Hot days in 30 yrs
- 15 days/yr
Wind risk 6/10 · Moderate
- Chance of severe wind over 30 yrs
- 27.0%
Air-quality risk 4/10 · Minor
- Unhealthy air days now
- 6 days/yr
- Unhealthy air days in 30 yrs
- 7 days/yr
Risk factors via First Street. Map © Google.
Why this score? — see what drove the B+ grade
The composite is a weighted blend of 9 inputs, each scored 0–100. Each bar is that input's sub-score; the figure is the points it added to the 100-point composite (weight × sub-score).
- Cash flow +28.7/30.0
- ARV discount +14.3/15.0
- DSCR +10.0/10.0
- 1% rule +8.7/10.0
- Appreciation +4.7/10.0
- Rent growth +3.8/5.0
- Livability +3.8/5.0
- Condition / age +2.5/5.0
- Schools +1.0/10.0
$130,000
🖨 Deal sheet 📄 Offer letter ✓ Due diligence
Listing remarks
INVESTORS PLEASE BE ALERT! Incredible opportunity to renovate and build equity in a classic colonial town home located at 1418 N Linwood Ave . This home is ready for a full renovation and offers outstanding superior potential for the right savvy buyer looking to create value. The main level features a nice size Living, Dining Room and Kitchen a great starting point for restoration. with access to rear fenced back yard The second level of the home does not disappoint with full size bath and 3 gracious size bed rooms featuring All Natural Hardwood floors throughout waiting your refinishing re-imagined and thoughtful renovation The lower level has a improved Basement with section of
Key facts
- Built 1945
- Listed 17 days
Neighborhood map
What this means for you Summary
Snapshot
- This is a 3-bed/2.0-bath townhouse listed at $130k.
Deal economics
- At list price, monthly cash flow is $432 ($5k/yr) — positive.
- The deal already cash-flows at list — no discount required.
- Meets the 1% rule at list price ($2k rent vs $130k).
- Recommended offer: $128k (1.5% below list) — sets the bar for market timing.
- Cap rate 10.3% vs local median 6.0% in Baltimore — top-decile yield for the area; either an underpriced asset or a hidden risk that comps aren't pricing in. Stress-test before assuming the spread holds.
Location & tenants
- Location reads 76/100 on livability (#90 in MD, #3,396 nationally) — a middle-class / working-renter tenant base. Strengths: amenities A+, commute A+, housing A+; Watch: schools D, crime F.
- Baltimore City Public Schools (urban): math 7% / reading 16% proficiency, ranked #24 of 24 in MD (top 100%) — low school quality limits family demand, transient renter base, plan for 1-2y turnover; 79% free/reduced lunch — lower-income household profile, screen leases tightly.
- Market conditions: Rents rising fast (+5.2%/yr); 319 active listings in the ZIP; 40 comparable units currently listed for rent nearby; rentals at typical pace (median 24d on market — plan ~3-4 weeks tenant-placement turnaround); 40% of comp listings sitting > 30 days — soft ceiling on asking rent; 1,273 units permitted in Baltimore city in 2024 (1,104 in 5+ unit buildings).
- This rent runs 42% of the median local income ($51k/yr) — at the standard rent-burdened threshold; future hikes will face affordability resistance.
Forward outlook
- In year one you build about $161 of equity ($899 loan paydown + $-738 appreciation (-0.6% local appreciation)).
- Baltimore County population projected to shrink 4% by 2050 — rents likely to lag national; underwrite the cash flow, not the appreciation.
- At projected returns (-0.6% appreciation + 5.2% rent growth), your $36k cash investment doubles in ~6 years — after that, you're playing with house money.
Negotiation context
- It's been on market 17 days — a 2% lower offer ($128k) is reasonable based on typical stale-listing flexibility.
Risks & watch-outs
- Watch-outs: built in 1945 — expect roof / HVAC / electrical / plumbing capex.
- Climate carrying-cost: major wind risk, 27% chance of damaging wind over 30y; extreme-heat days projected 7→15/yr by 2055 (HVAC capex compounding) — expect insurance premiums to compound above CPI over the hold.
Questions for the listing agent
- Built in 1945 — when were the roof, HVAC, electrical panel, plumbing, and water heater last replaced?
- Is there a deadline driving the sale (1031 exchange, divorce, estate, relocation)? That informs how much negotiation room exists.
- Schools are D-rated, which usually means shorter tenancies and higher turnover. Who's the typical renter profile here, and what's been the actual vacancy rate?
- Crime grade is F in this area — have there been break-ins, vandalism, or insurance claims at this property in the last 3 years? What carrier currently insures it and at what premium?
- What's the average days-on-market for RENTAL listings here right now (not sales)? A rising rental-DOM trend means longer vacancies and softer asking-rent achievability than the comps imply.
- What's the recent tenant-quality profile in this submarket — average credit score on applications, eviction rate, late-payment / NSF rate, and stable-employment percentage? A property-management company in the area should have these aggregated.
- How much new for-sale + rental construction is in the pipeline within 1–3 miles? Heavy new supply typically softens prices + rents 12–24 months out; constrained supply supports both.
Investment metrics
- 1% rule
- 1.37% ✓
- Cap rate
- 10.28%
- Cash-on-cash
- 14.24%
- DSCR
- 1.63
- GRM
- 6.1
CMA / ARV
- ARV (on-the-fly)
- $153,228
- Comps found
- 12
Show comp detail 12 sales within ~0.75 mi
| Address | Dist | Beds/Ba | Sqft | Sold | Price | $/sf | Match |
|---|---|---|---|---|---|---|---|
| 1418 N Linwood Ave | 0.00mi | 3/1.0 | 1,356 (0%) | 0mo | $90,000 | $66 | 96 |
| 1411 Kenhill Ave | 0.03mi | 4/2.0 (+1) | 1,356 (0%) | 1mo | $240,000 | $177 | 93 |
| 2422 E Federal St | 0.36mi | 3/1.0 | 1,350 (-0%) | 1mo | $55,000 | $41 | 77 |
| 3533 Elmley Ave | 0.71mi | 3/1.5 | 1,344 (-1%) | 1mo | $70,000 | $52 | 62 |
| 2220 Henneman Ave | 0.55mi | 3/2.5 | 1,440 (+6%) | 1mo | $190,000 | $132 | 61 |
| 1106 N Lakewood Ave | 0.29mi | 3/1.0 | 1,538 (+13%) | 3mo | $50,000 | $33 | 58 |
| 2932 Mcelderry St | 0.66mi | 3/1.0 | 1,304 (-4%) | 2mo | $147,000 | $113 | 57 |
| 2712 Ashland Ave | 0.46mi | 3/1.5 | 1,164 (-14%) | 1mo | $175,000 | $150 | 52 |
| 3564 Elmora Ave | 0.68mi | 3/1.5 | 1,478 (+9%) | 1mo | $133,500 | $90 | 50 |
| 3135 Mcelderry St | 0.72mi | 3/2.0 | 1,224 (-10%) | 1mo | $234,000 | $191 | 49 |
| 3238 Ravenwood Ave | 0.53mi | 3/1.5 | 1,158 (-15%) | 0mo | $70,000 | $60 | 48 |
| 3555 Elmora Ave | 0.64mi | 4/2.0 (+1) | 1,178 (-13%) | 1mo | $254,000 | $216 | 42 |
Match score weights: distance 35% · size 25% · config 20% · recency 20%. Top-matched comps best support the ARV.
Projected returns pro-forma
-0.57% appreciation · 5.25% rent growth · sell at horizon
- IRR
- 14.2%
- Equity multiple
- 1.67×
- Total profit
- $24,464
- Equity at exit
- $34,098
- IRR
- 21.1%
- Equity multiple
- 3.42×
- Total profit
- $87,984
- Equity at exit
- $38,177
Cash invested: $36,400 (down + closing). Projections, not guarantees.
Landlord ↔ Tenant lean methodology
- Overall (CITY)
- 12 Strongly Tenant-Friendly
- State Maryland
- 27 Tenant-Leaning · D+14
- County
- — inherits STATE
- City Baltimore
- 12 Strongly Tenant-Friendly · D+58
ZIP-level market 21213
- Home prices YoY
- -0.1%
- Rents YoY
- 5.2%
- Active inventory
- 319
- Price-to-rent
- 6.1×
Monthly cashflow live
- Estimated rent
- $1,778 high interval (Pro) →
- Mortgage (P&I)
- −$682
- Tax from tax record
- −$237 /mo · $2,844/yr
- Insurance
- −$54
- HOA
- −$0
- Vacancy / Maint / Mgmt
- −$373
- Net cashflow
- $432
Break-even live
UW: 25.0% down · 7.5% · 30yr · 1.5% tax · 5.0% vac · 8.0% maint · 8.0% mgmt
Financing live
Cash to close
- Down payment
- $32,500
- Closing costs
- $3,900
- Reserves months
- —
- Total cash needed
- —
Loan-product check · same deal, 3 products live
Conventional
25% down · 7.5% · 30yr
- Down + closing
- —
- Monthly P&I
- —
- Monthly cashflow
- —
- DSCR
- —
- Eligible?
- —
Personal DTI + credit; lowest rate.
DSCR
20% down · 8.5% · 30yr
- Down + closing
- —
- Monthly P&I
- —
- Monthly cashflow
- —
- DSCR
- —
- Eligible?
- —
No personal income docs; deal must DSCR.
Hard money
10% down · 12.0% · 12mo
- Down + closing
- —
- Monthly P&I
- —
- Monthly cashflow
- —
- DSCR
- —
- Eligible?
- —
Short-term bridge; refi at stabilization.
Rent comps 40 comps
| Address | Beds | Baths | Sqft | Rent | $/sqft | DOM | Units | Dist |
|---|---|---|---|---|---|---|---|---|
| 1403 N Linwood Ave Baltimore, MD | 3.0 | 2.0 | 1660 | $1,995 | $1.20 | 43d | 1 | 0.05mi |
| 1323 N Kenwood Ave Unit 1 Baltimore, MD | 2.0 | 1.5 | 1060 | $1,350 | $1.27 | 23d | 1 | 0.11mi |
| 2621 E Oliver St Baltimore, MD | 3.0 | 2.0 | 1600 | $1,700 | $1.06 | 23d | 1 | 0.19mi |
| 1310 N Ellwood Ave Baltimore, MD | 2.0 | 1.0 | 1000 | $1,450 | $1.45 | 12d | 1 | 0.19mi |
| 1310 N Ellwood Ave #1 Baltimore, MD | 2.0 | 1.0 | 1000 | $1,550 | $1.55 | 21d | 1 | 0.19mi |
| 2626 E Preston St Baltimore, MD | 3.0 | 1.0 | 1136 | $1,800 | $1.58 | 43d | 1 | 0.22mi |
| 1215 N Ellwood Ave Baltimore, MD | 3.0 | 1.0 | 1128 | $1,795 | $1.59 | 23d | 1 | 0.24mi |
| 2706 E Biddle St Baltimore, MD | 3.0 | 2.0 | 1577 | $1,395 | $0.88 | 43d | 1 | 0.24mi |
| 2522 E Federal St Baltimore, MD | 2.0 | 2.0 | 1760 | $1,400 | $0.80 | 43d | 1 | 0.27mi |
| 2430 E Biddle St Baltimore, MD | 2.0 | 2.0 | 1300 | $2,000 | $1.54 | 43d | 1 | 0.39mi |
| 2311 E Lafayette Ave Baltimore, MD | 3.0 | 1.0 | 1000 | $1,400 | $1.40 | 43d | 1 | 0.47mi |
| 2729 Ashland Ave Baltimore, MD | 3.0 | 1.0 | 1000 | $1,350 | $1.35 | 2d | 1 | 0.49mi |
| 3343 Ravenwood Ave Unit 3343 Baltimore, MD | 2.0 | 2.0 | 948 | $1,855 | $1.96 | 17d | 1 | 0.50mi |
| 809 N Curley St Baltimore, MD | 3.0 | 1.0 | 1746 | $1,400 | $0.80 | 21d | 1 | 0.51mi |
| 3322 Ravenwood Ave Baltimore, MD | 3.0 | 2.0 | 932 | $1,800 | $1.93 | 23d | 1 | 0.52mi |
| 3339 Elmora Ave Baltimore, MD | 3.0 | 2.0 | 896 | $1,600 | $1.79 | 43d | 1 | 0.54mi |
| 3326 Elmora Ave Baltimore, MD | 3.0 | 1.0 | 1200 | $1,450 | $1.21 | 23d | 1 | 0.55mi |
| 2815 E Madison St Baltimore, MD | 4.0 | 2.0 | 1300 | $2,500 | $1.92 | 43d | 1 | 0.56mi |
| 724 N Curley St Baltimore, MD | 3.0 | 3.0 | 1500 | $2,200 | $1.47 | 4d | 1 | 0.57mi |
| 2215 E Biddle St Baltimore, MD | 2.0 | 2.5 | 1350 | $1,800 | $1.33 | 43d | 1 | 0.57mi |
| 718 N Curley St Baltimore, MD | 3.0 | 3.0 | 1500 | $2,000 | $1.33 | 4d | 1 | 0.57mi |
| 3315 Lyndale Ave Baltimore, MD | 2.0 | 1.5 | 896 | $1,650 | $1.84 | 17d | 1 | 0.57mi |
| 3221 Lyndale Ave Baltimore, MD | 2.0 | 2.0 | 1020 | $1,700 | $1.67 | 23d | 1 | 0.57mi |
| 3317 Lyndale Ave Baltimore, MD | 3.0 | 1.0 | 900 | $1,300 | $1.44 | 43d | 1 | 0.57mi |
| 3335 Lyndale Ave Baltimore, MD | 2.0 | 2.0 | 1344 | $1,600 | $1.19 | 23d | 1 | 0.58mi |
| 2113 Belair Rd Baltimore, MD | 3.0 | 1.0 | 1344 | $1,795 | $1.34 | 43d | 1 | 0.58mi |
| 3222 Lyndale Ave Unit 1 Baltimore, MD | 3.0 | 1.5 | 1500 | $2,200 | $1.47 | 12d | 1 | 0.59mi |
| 3218 Lyndale Ave Baltimore, MD | 3.0 | 1.5 | 1020 | $1,500 | $1.47 | 23d | 1 | 0.60mi |
| 2934 E Monument St Baltimore, MD | 2.0 | 1.0 | 1200 | $1,499 | $1.25 | 43d | 1 | 0.61mi |
| 3512 Elmora Ave Baltimore, MD | 3.0 | 1.5 | 1472 | $1,900 | $1.29 | 20d | 1 | 0.61mi |
| 3213 Elmley Ave Baltimore, MD | 2.0 | 1.0 | 1188 | $1,395 | $1.17 | 43d | 1 | 0.61mi |
| 2202 Prentiss Pl Baltimore, MD | 3.0 | 2.0 | 1400 | $2,400 | $1.71 | 43d | 1 | 0.62mi |
| 4104 Erdman Ave Unit 2 Baltimore, MD | 2.0 | 1.0 | 1566 | $1,075 | $0.69 | 4d | 1 | 0.65mi |
| 3914 Erdman Ave #1 Baltimore, MD | 3.0 | 1.0 | 1200 | $1,319 | $1.10 | 17d | 1 | 0.67mi |
| 627 N Lakewood Ave Baltimore, MD | 3.0 | 2.5 | 1175 | $1,900 | $1.62 | 21d | 1 | 0.67mi |
| 3902 Erdman Ave Unit 1 Baltimore, MD | 2.0 | 1.0 | 1000 | $1,275 | $1.27 | 23d | 1 | 0.67mi |
| 720 N Port St Baltimore, MD | 2.0 | 1.0 | 950 | $1,300 | $1.37 | 43d | 1 | 0.68mi |
| 3603 Ravenwood Ave Unit 1 Baltimore, MD | 4.0 | 1.0 | 1566 | $1,600 | $1.02 | 43d | 1 | 0.69mi |
| 3551 Elmley Ave Baltimore, MD | 3.0 | 1.5 | 1872 | $2,095 | $1.12 | 23d | 1 | 0.71mi |
| 2608 McElderry St Baltimore, MD | 3.0 | 1.0 | 1144 | $1,550 | $1.35 | 23d | 1 | 0.72mi |
Listing history 3 events
-
2026-04-27status Pending
-
2026-04-11$130,000 Active
-
2026-03-22historical $130,000
ⓘ Source: listings_history table (triggers on properties + properties_extension) + one-shot
backfill from property_details.listing_events for pre-trigger history.
Tax reassessment forecast MD · Partial reset (capped growth)
- Current annual tax
- $2,844 · $237/mo
- Projected year-2 tax
- $2,844 · $237/mo
- Expected delta
- $0/yr ($0/mo · 0.0%)
ⓘ Screening estimate from a state-policy table — verify with the county assessor before closing.
Climate risk First Street
- Flood 1/10 Low FEMA zone X (unshaded) · 0% chance over 30 yrs
- Wildfire 1/10 Low
- Heat 7/10 Severe 7 d/yr ≥103°F today · 15 d/yr by 30 yrs out
- Wind 6/10 Major 27% chance of damaging wind over 30 yrs
- Air quality 4/10 Moderate 6 unhealthy d/yr today · 7 by 30 yrs out
Nearby sold comps map
Loading sold comps map…
Walkable amenities ~0.75 mi
Loading nearby amenities…
Taxation est. · year 1
- Rental income
- $21,340
- − Mortgage interest
- −$7,282
- − Property taxes
- −$2,844
- − Insurance
- −$650
- − Repairs & maintenance
- −$1,707
- − Management
- −$1,707
- − Depreciation
- −$3,782
- Taxable income
- $3,367
- Est. tax owed @ 24.0%
- −$808
- After-tax cash flow
- $4,375/yr
For passive investors: Depreciation is non-cash, so a rental often shows a tax loss while cash-flowing — sheltering income. Rental losses are passive: they offset passive income freely, and up to $25,000/yr can offset ordinary (W-2) income if you actively participate and your MAGI is under $100k (phasing out to $0 by $150k); unused losses carry forward. On sale, claimed depreciation is recaptured at up to 25%, and gains may owe capital-gains tax (a 1031 exchange can defer both). Figures are a year-1 estimate at your 24.0% rate — not tax advice; consult a CPA.
Schools (NCES district)
- District
- Baltimore City Public Schools
- NCES district ID
- 2400090
- Math proficiency
- 7% ▼ -9.00%
- Reading proficiency
- 16% ▼ -5.00%
- Median HH income
- $42,108
- Composite
- 10.08/100
- National rank
- #9805
- State rank
- #24 of 24 in MD
Livability — Baltimore
- Score
- 76/100
- State rank
- #90
- US rank
- #3396
Category grades
Schools grade is shown separately in the Schools card above.
Census & demographics
- Census place
- Baltimore, MD
- County
- Baltimore City · 558,601 people
- City population
- 588,727
- Metro
- Baltimore-Columbia-Towson, MD
- Population (ZIP)
- 28,058
- Household income
- $51,344
- Rent vs Own
- Severe rent burden
- 1868.0
Population outlook (Baltimore County) Hauer SSP2
- Today (2025)
- 624,249 people
- By 2030
- 621,541 · -0.4%
- By 2040
- 609,756 · -2.3%
- By 2050
- 597,249 · -4.3%
- By 2075
- 552,236 · -11.5%
- By 2100
- 513,934 · -17.7%
Race, ethnicity, and origin ACS 2023
- Neighborhood character
- Predominantly Black (86%)
- Race & ethnicity
- Black 86% White 6% Hispanic / Latino 4% Two or more races 3%
- Foreign-born
- 3% · Canada
- Languages at home
- 96% English-only · Spanish 3%
Political lean MEDSL · Baltimore
- 2024 margin
- Solid D (+73.0) · D 85.2% · R 12.2% · Other 2.6%
- 2008→2024 swing
- -2.5pp toward R · 2008: 75.5pp · 2024: 73.0pp
- All cycles
- 2024: D+73.0 2020: D+76.6 2016: D+74.6 2012: D+76.4 2008: D+75.5
Not yet ingested
- Civics
- —
Market trends
- HPI YoY
- ▼ -0.57%
- Current HPI
- 427.4453
- Rent YoY
- ▲ 5.25%
- Metro
- Baltimore-Columbia-Towson, MD
- State GDP YoY
- ▲ 2.97%
- F500 in state
- 12
Industry mix (Fortune 500 HQ in MD)
| Industry | F500 HQs | Revenue |
|---|---|---|
| Aerospace / Defense | 1 | $71B |
|
||
| Utilities | 1 | $25B |
|
||
| Hotels | 1 | $24B |
|
||
| Consumer Goods | 1 | $7B |
|
||
| Real Estate | 1 | $6B |
|
||
| Chemicals | 1 | $2B |
|
||
Price history
+0.0% since first listed3 events — show timeline
- 2026-04-27 Pending — BRIGHT MLS
- 2026-04-11 Listed $130,000 BRIGHT MLS
- 2026-03-22 Coming Soon $130,000 BRIGHT MLS
Property tax history
+1.9%/yrLatest (2025): $2,844 · +8.9% YoY. Source: county tax records.
Cash-flow waterfall
monthlySold comps — $/sqft
last 12 mo · ≤1 miLoading sold comps…