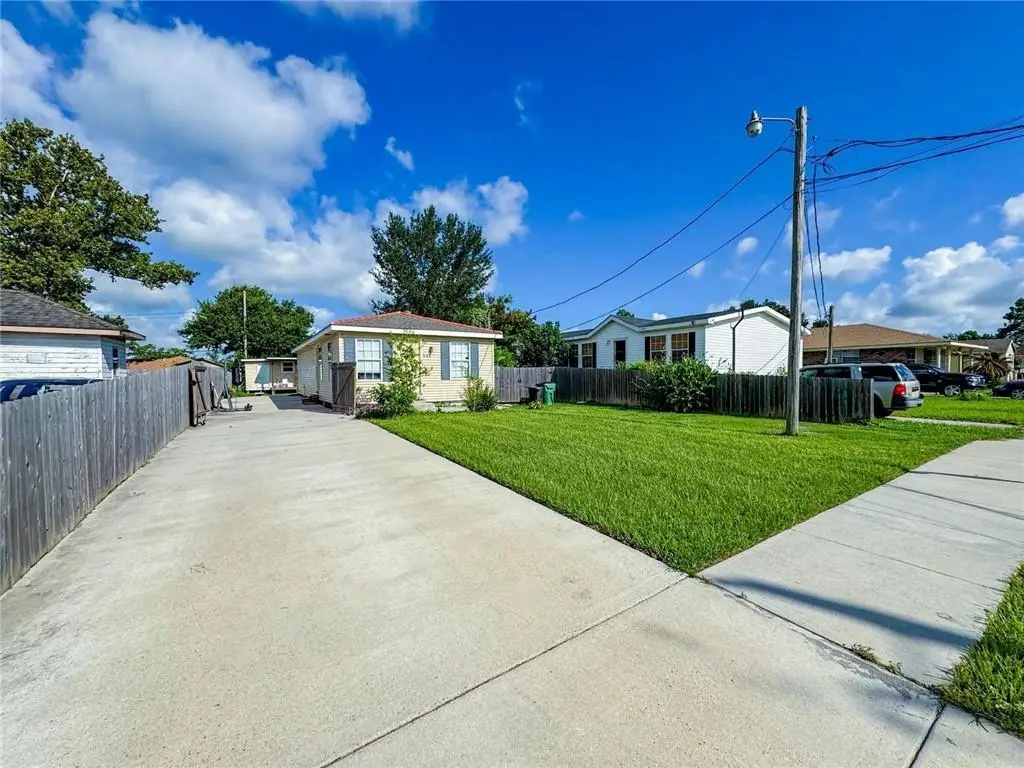
340 George St · Waggaman, LA
Flood risk No data
- FEMA flood zone
- —
- Chance of flooding over 30 yrs
- —
- Est. flood insurance / yr
- —
Fire risk No data
- Est. fire insurance / yr
- —
Heat risk No data
- Hot days now (above threshold)
- —
- Hot days in 30 yrs
- —
Wind risk No data
- Chance of severe wind over 30 yrs
- —
Air-quality risk No data
- Unhealthy air days now
- —
- Unhealthy air days in 30 yrs
- —
Risk factors via First Street. Map © Google.
Why this score? — see what drove the C- grade
The composite is a weighted blend of 9 inputs, each scored 0–100. Each bar is that input's sub-score; the figure is the points it added to the 100-point composite (weight × sub-score).
- Cash flow +26.5/30.0
- DSCR +9.1/10.0
- 1% rule +6.2/10.0
- Livability +3.1/5.0
- ARV discount +2.9/15.0
- Schools +2.5/10.0
- Condition / age +2.5/5.0
- Rent growth +2.3/5.0
- Appreciation +0.0/10.0
$160,000
🖨 Deal sheet 📄 Offer letter ✓ Due diligence
Listing remarks MLS
Newly renovated 3 bedroom, 2 bath home with an open floorplan. It has a large driveway suitable for multiple vehicles or parking a trailer. An additional/sperate suite in the backyard that is partially completed.
Key facts
- Large driveway
- Open floorplan
- Parking
Tags
Neighborhood map
What this means for you Summary
Snapshot
- This is a 3-bed/2.0-bath single-family listed at $160k.
Deal economics
- At list price, monthly cash flow is $424 ($5k/yr) — positive.
- The deal already cash-flows at list — no discount required.
- Meets the 1% rule at list price ($2k rent vs $160k).
- Recommended offer: $141k (12.0% below list) — sets the bar for market timing.
- Cap rate 9.5% vs local median 4.7% in Waggaman — top-decile yield for the area; either an underpriced asset or a hidden risk that comps aren't pricing in. Stress-test before assuming the spread holds.
Location & tenants
- Location reads 61/100 on livability (#226 in LA) — a middle-class / working-renter tenant base. Strengths: cost of living A+, housing A+; Watch: schools D, crime F, amenities F.
- Jefferson Parish (suburban): math 24% / reading 34% proficiency, ranked #44 of 98 in LA (top 45%) — low school quality limits family demand, transient renter base, plan for 1-2y turnover; 70% free/reduced lunch — lower-income household profile, screen leases tightly.
- Market conditions: Rents soft (-0.8%/yr); 186 active listings in the ZIP; 13 comparable units currently listed for rent nearby; rentals lingering (median 44d on market — plan ~5-8 weeks vacancy on turnover, expect pricing pressure); 54% of comp listings sitting > 30 days — soft ceiling on asking rent; 518 units permitted in Jefferson Parish in 2024 (43 in 5+ unit buildings).
- This rent runs 40% of the median local income ($54k/yr) — at the standard rent-burdened threshold; future hikes will face affordability resistance.
Forward outlook
- Local home prices are declining (-3.0%/yr); year-one equity from $1k of loan paydown is wiped out by about $5k of value loss. Plan a longer hold.
Negotiation context
- It's been on market 295 days — a 12% lower offer ($141k) is reasonable based on typical stale-listing flexibility.
- 9 sale attempts since 21y ago with the ask held roughly flat each time — persistent listings suggest the price (not the market) is what's stuck; bring a comps-based counter.
- Current owner paid $75k; list at $160k implies a 113% gain — meaningful room to come down on a strong offer.
Questions for the listing agent
- It's been on market 295 days. Have you received any prior offers? Is the seller open to a 12% concession, seller financing, or rate buy-down credit?
- Built in 1965 — when were the roof, HVAC, electrical panel, plumbing, and water heater last replaced?
- Why hasn't it sold? Are there any deal-killer items the seller is aware of (foundation, flood, title, zoning, code violations)?
- Is there a deadline driving the sale (1031 exchange, divorce, estate, relocation)? That informs how much negotiation room exists.
- Schools are D-rated, which usually means shorter tenancies and higher turnover. Who's the typical renter profile here, and what's been the actual vacancy rate?
- Crime grade is F in this area — have there been break-ins, vandalism, or insurance claims at this property in the last 3 years? What carrier currently insures it and at what premium?
- What's the average days-on-market for RENTAL listings here right now (not sales)? A rising rental-DOM trend means longer vacancies and softer asking-rent achievability than the comps imply.
- What's the recent tenant-quality profile in this submarket — average credit score on applications, eviction rate, late-payment / NSF rate, and stable-employment percentage? A property-management company in the area should have these aggregated.
- How much new for-sale + rental construction is in the pipeline within 1–3 miles? Heavy new supply typically softens prices + rents 12–24 months out; constrained supply supports both.
Investment metrics
- 1% rule
- 1.12% ✓
- Cap rate
- 9.47%
- Cash-on-cash
- 11.36%
- DSCR
- 1.51
- GRM
- 7.5
CMA / ARV
- ARV (median comp)
- $145,055
- List price
- $160,000
- Delta
- 10.30%
- Verdict
- OVERPRICED
- Comps
- 20 within 1.0 mi
Show comp detail 12 sales within ~0.75 mi
| Address | Dist | Beds/Ba | Sqft | Sold | Price | $/sf | Match |
|---|---|---|---|---|---|---|---|
| 176 Prairie View Ct | 0.26mi | 3/1.5 | 1,017 (+2%) | 6mo | $115,000 | $113 | 78 |
| 333 Glendella Dr | 0.46mi | 3/1.0 | 1,001 (+0%) | 6mo | $63,000 | $63 | 69 |
| 173 S Tish Dr | 0.50mi | 3/2.0 | 1,058 (+6%) | 1mo | $130,000 | $123 | 66 |
| 129 Prarieview Ct | 0.15mi | 3/1.5 | 1,100 (+10%) | 12mo | $130,000 | $118 | 64 |
| 248 Jamie Blvd | 0.70mi | 3/1.0 | 996 (-0%) | 10mo | $70,000 | $70 | 54 |
| 168 N Betty Ln | 0.55mi | 3/1.5 | 1,100 (+10%) | 3mo | $158,000 | $144 | 54 |
| 181 Rosalie Dr | 0.61mi | 3/1.5 | 1,109 (+11%) | 2mo | $105,000 | $95 | 49 |
| 108 Carmen Dr | 0.67mi | 3/1.5 | 1,009 (+1%) | 20mo | $149,000 | $148 | 49 |
| 156 Felicia Dr | 0.53mi | 2/1.0 (-1) | 935 (-6%) | 10mo | $156,000 | $167 | 47 |
| 304 Deacon St | 0.49mi | 3/2.0 | 1,147 (+15%) | 12mo | $172,500 | $150 | 43 |
| 172 Cambay Dr | 0.51mi | 3/2.0 | 1,132 (+13%) | 15mo | $179,000 | $158 | 42 |
| 112 Mandy Dr | 0.74mi | 3/1.0 | 940 (-6%) | 20mo | $127,900 | $136 | 35 |
Match score weights: distance 35% · size 25% · config 20% · recency 20%. Top-matched comps best support the ARV.
Projected returns pro-forma
-3.0% appreciation · 0.0% rent growth · sell at horizon
- IRR
- -2.6%
- Equity multiple
- 0.91×
- Total profit
- $-4,191
- Equity at exit
- $23,857
- IRR
- 3.8%
- Equity multiple
- 1.24×
- Total profit
- $10,729
- Equity at exit
- $13,834
Cash invested: $44,800 (down + closing). Projections, not guarantees.
Landlord ↔ Tenant lean methodology
- Overall (STATE)
- 90 Strongly Landlord-Friendly
- State Louisiana
- 90 Strongly Landlord-Friendly · R+12
- County
- — inherits STATE
- City
- — inherits STATE
ZIP-level market 70094
- Rents YoY
- -0.8%
- Active inventory
- 186
- Price-to-rent
- 7.5×
Monthly cashflow live
- Estimated rent
- $1,785 high interval (Pro) →
- Mortgage (P&I)
- −$839
- Tax from tax record
- −$80 /mo · $965/yr
- Insurance
- −$67
- HOA
- −$0
- Vacancy / Maint / Mgmt
- −$375
- Net cashflow
- $424
Break-even live
UW: 25.0% down · 7.5% · 30yr · 1.5% tax · 5.0% vac · 8.0% maint · 8.0% mgmt
Financing live
Cash to close
- Down payment
- $40,000
- Closing costs
- $4,800
- Reserves months
- —
- Total cash needed
- —
Loan-product check · same deal, 3 products live
Conventional
25% down · 7.5% · 30yr
- Down + closing
- —
- Monthly P&I
- —
- Monthly cashflow
- —
- DSCR
- —
- Eligible?
- —
Personal DTI + credit; lowest rate.
DSCR
20% down · 8.5% · 30yr
- Down + closing
- —
- Monthly P&I
- —
- Monthly cashflow
- —
- DSCR
- —
- Eligible?
- —
No personal income docs; deal must DSCR.
Hard money
10% down · 12.0% · 12mo
- Down + closing
- —
- Monthly P&I
- —
- Monthly cashflow
- —
- DSCR
- —
- Eligible?
- —
Short-term bridge; refi at stabilization.
Rent comps 13 comps
| Address | Beds | Baths | Sqft | Rent | $/sqft | DOM | Units | Dist |
|---|---|---|---|---|---|---|---|---|
| 304 Butler Dr Westwego, LA | 4.0 | 2.0 | 1200 | $2,300 | $1.92 | 43d | 1 | 0.10mi |
| 441 Butler Dr Westwego, LA | 3.0 | 2.0 | 1200 | $1,450 | $1.21 | 23d | 1 | 0.17mi |
| 441 Butler Dr Westwego, LA | 3.0 | 1.5 | 1200 | $1,450 | $1.21 | 43d | 1 | 0.17mi |
| 384 Layman St Westwego, LA | 3.0 | 2.0 | 1258 | $1,560 | $1.24 | 43d | 1 | 0.30mi |
| 351 Glendella Dr Westwego, LA | 3.0 | 1.5 | 1200 | $1,600 | $1.33 | 43d | 1 | 0.43mi |
| 351 Glendella Dr Westwego, LA | 3.0 | 1.5 | 1350 | $1,450 | $1.07 | 4d | 1 | 0.43mi |
| 145 S Dexter Dr Westwego, LA | 3.0 | 1.5 | 1200 | $1,400 | $1.17 | 23d | 1 | 0.45mi |
| 185 Carmen Dr Westwego, LA | 3.0 | 1.0 | 900 | $1,600 | $1.78 | 43d | 1 | 0.48mi |
| 113 Jeanne Dr Westwego, LA | 3.0 | 2.0 | 800 | $1,950 | $2.44 | 14d | 1 | 0.89mi |
| 101 Ursula Dr Westwego, LA | 3.0 | 1.5 | 1400 | $1,600 | $1.14 | 14d | 1 | 0.98mi |
| 89 Marie Dr Westwego, LA | 4.0 | 1.5 | 1100 | $1,600 | $1.45 | 43d | 1 | 1.19mi |
| 96 Park Ave New Orleans, LA | 3.0 | 1.0 | 1100 | $1,900 | $1.73 | 23d | 1 | 1.33mi |
| 76 Elaine Dr Westwego, LA | 3.0 | 1.5 | 1100 | $1,500 | $1.36 | 43d | 1 | 1.34mi |
Listing history 28 events
-
2026-06-18days on market $160,000 Active 295 DOM
-
2026-06-17days on market $160,000 Active 294 DOM
-
2026-06-16days on market $160,000 Active 293 DOM
-
2026-06-15days on market $160,000 Active 292 DOM
-
2026-06-13days on market $160,000 Active 290 DOM
-
2026-06-10days on market $160,000 Active 287 DOM
-
2026-06-09days on market $160,000 Active 286 DOM
-
2026-06-08days on market $160,000 Active 285 DOM
-
2026-06-07days on market $160,000 Active 284 DOM
-
2026-06-03days on market $160,000 Active 280 DOM
-
2026-06-02days on market $160,000 Active 279 DOM
-
2026-06-01days on market $160,000 Active 278 DOM
-
2026-05-31days on market $160,000 Active 277 DOM
-
2025-09-16price $160,000 212-char remark
Show marketing remark (212 chars)
Newly renovated 3 bedroom, 2 bath home with an open floorplan. It has a large driveway suitable for multiple vehicles or parking a trailer. An additional/sperate suite in the backyard that is partially completed.
-
2025-09-16price $160,000 212-char remark
Show marketing remark (212 chars)
Newly renovated 3 bedroom, 2 bath home with an open floorplan. It has a large driveway suitable for multiple vehicles or parking a trailer. An additional/sperate suite in the backyard that is partially completed.
-
2025-08-27$170,000 Active 212-char remark
Show marketing remark (212 chars)
Newly renovated 3 bedroom, 2 bath home with an open floorplan. It has a large driveway suitable for multiple vehicles or parking a trailer. An additional/sperate suite in the backyard that is partially completed.
-
2025-08-27$170,000 Active 212-char remark
Show marketing remark (212 chars)
Newly renovated 3 bedroom, 2 bath home with an open floorplan. It has a large driveway suitable for multiple vehicles or parking a trailer. An additional/sperate suite in the backyard that is partially completed.
-
2025-08-27$160,000 Active
Show marketing remark (212 chars)
Newly renovated 3 bedroom, 2 bath home with an open floorplan. It has a large driveway suitable for multiple vehicles or parking a trailer. An additional/sperate suite in the backyard that is partially completed.
-
2024-06-11$179,000
-
2021-08-25soldstatus $75,000
-
2021-08-19soldstatus $75,000 Closed
-
2021-04-22status Pending
-
2021-03-17$90,000
-
2021-03-17$90,000 Active
-
2009-07-25$88,000
-
2009-07-25$88,000
-
2006-01-24soldstatus $89,900
-
2005-03-10$25,000
ⓘ Source: listings_history table (triggers on properties + properties_extension) + one-shot
backfill from property_details.listing_events for pre-trigger history.
Tax reassessment forecast LA · Resets to sale price
- Current annual tax
- $965 · $80/mo
- Projected year-2 tax
- $965 · $80/mo
- Expected delta
- $0/yr ($0/mo · -0.0%)
ⓘ Screening estimate from a state-policy table — verify with the county assessor before closing.
Nearby sold comps map
Loading sold comps map…
Walkable amenities ~0.75 mi
Loading nearby amenities…
Taxation est. · year 1
- Rental income
- $21,422
- − Mortgage interest
- −$8,962
- − Property taxes
- −$965
- − Insurance
- −$800
- − Repairs & maintenance
- −$1,714
- − Management
- −$1,714
- − Depreciation
- −$4,655
- Taxable income
- $2,613
- Est. tax owed @ 24.0%
- −$627
- After-tax cash flow
- $4,463/yr
For passive investors: Depreciation is non-cash, so a rental often shows a tax loss while cash-flowing — sheltering income. Rental losses are passive: they offset passive income freely, and up to $25,000/yr can offset ordinary (W-2) income if you actively participate and your MAGI is under $100k (phasing out to $0 by $150k); unused losses carry forward. On sale, claimed depreciation is recaptured at up to 25%, and gains may owe capital-gains tax (a 1031 exchange can defer both). Figures are a year-1 estimate at your 24.0% rate — not tax advice; consult a CPA.
Schools (NCES district)
- District
- Jefferson Parish
- NCES district ID
- 2200840
- Math proficiency
- 24% ▼ -36.00%
- Reading proficiency
- 34% ▼ -30.00%
- Median HH income
- $48,421
- Composite
- 25.19/100
- National rank
- #7511
- State rank
- #44 of 98 in LA
Livability — Waggaman
- Score
- 61/100
- State rank
- #226
- US rank
- #17364
Category grades
Schools grade is shown separately in the Schools card above.
Census & demographics
- Census place
- Waggaman, LA
- County
- Jefferson Parish · 426,999 people
- Metro
- New Orleans-Metairie, LA
- Population (ZIP)
- 32,130
- Household income
- $53,597
- Rent vs Own
- Severe rent burden
- 1457.0
Population outlook (Jefferson County) Hauer SSP2
- Today (2025)
- 451,696 people
- By 2030
- 455,451 · +0.8%
- By 2040
- 458,308 · +1.5%
- By 2050
- 461,031 · +2.1%
- By 2075
- 476,351 · +5.5%
- By 2100
- 499,377 · +10.6%
Race, ethnicity, and origin ACS 2023
- Neighborhood character
- Diverse neighborhood (Simpson 0.65)
- Race & ethnicity
- Black 46% White 36% Hispanic / Latino 13% Two or more races 6% Asian 2%
- Hispanic origin (detail)
- Mexican 2% Dominican 2%
- Common ancestry
- Lithuanian 9% Scottish 1%
- Foreign-born
- 8% · Canada, Vietnam
- Languages at home
- 86% English-only · Spanish 11% Vietnamese 2% French/Haitian/Cajun 1%
Political lean MEDSL · Jefferson
- 2024 margin
- R (+12.9) · D 42.5% · R 55.5% · Other 2.1%
- 2008→2024 swing
- +13.6pp toward D · 2008: -26.6pp · 2024: -12.9pp
- All cycles
- 2024: R+12.9 2020: R+11.1 2016: R+14.8 2012: R+18.4 2008: R+26.6
Not yet ingested
- Civics
- —
Market trends
- HPI YoY
- ▼ -111.56%
- Current HPI
- 102.9992
- Rent YoY
- ▼ -0.80%
- Metro
- New Orleans-Metairie, LA
- State GDP YoY
- ▲ 3.29%
- F500 in state
- 10
Industry mix (Fortune 500 HQ in LA)
| Industry | F500 HQs | Revenue |
|---|---|---|
| Telecommunications | 2 | $23B |
|
||
| Utilities | 1 | $12B |
|
||
| Wholesale / Distribution | 1 | $5B |
|
||
| Advertising | 1 | $2B |
|
||
Price history
+540.0% since first listed15 events — show timeline
- 2025-09-16 Price Changed $160,000 AcadianaMLS
- 2025-09-16 Price Changed $160,000 GSREIN
- 2025-08-27 Listed $160,000 AcadianaMLS
- 2025-08-27 Listed $170,000 GSREIN
- 2025-08-27 Listed $170,000 AcadianaMLS
- 2024-06-11 Listed $179,000 AcadianaMLS
- 2021-08-25 Sold (Public Records) $75,000 Public Records
- 2021-08-19 Sold (MLS) $75,000 GSREIN
- 2021-04-22 Pending — GSREIN
- 2021-03-17 Listed $90,000 GSREIN
- 2021-03-17 Listed $90,000 AcadianaMLS
- 2009-07-25 Listed $88,000 GSREIN
- 2009-07-25 Listed $88,000 AcadianaMLS
- 2006-01-24 Sold (Public Records) $89,900 Public Records
- 2005-03-10 Listed $25,000 AcadianaMLS
Property tax history
-1.0%/yrLatest (2025): $965 · +0.3% YoY. Source: county tax records.
Cash-flow waterfall
monthlySold comps — $/sqft
last 12 mo · ≤1 miLoading sold comps…