31139 County Route 30 · Fort Drum, NY
Flood risk 1/10 · Minimal
- FEMA flood zone
- X (unshaded)
- Chance of flooding over 30 yrs
- 0.0%
- Est. flood insurance / yr
- $507 – $1,088
Fire risk 1/10 · Minimal
- Est. fire insurance / yr
- $691 – $1,283
Heat risk 1/10 · Minimal
- Hot days now (above 91°F)
- 7 days/yr
- Hot days in 30 yrs
- 15 days/yr
Wind risk 1/10 · Minimal
- Chance of severe wind over 30 yrs
- —
Air-quality risk 2/10 · Minimal
- Unhealthy air days now
- 1 days/yr
- Unhealthy air days in 30 yrs
- 1 days/yr
Risk factors via First Street. Map © Google.
Why this score? — see what drove the B+ grade
The composite is a weighted blend of 9 inputs, each scored 0–100. Each bar is that input's sub-score; the figure is the points it added to the 100-point composite (weight × sub-score).
- Cash flow +30.0/30.0
- 1% rule +10.0/10.0
- DSCR +10.0/10.0
- Appreciation +9.5/10.0
- ARV discount +7.5/15.0
- Schools +3.5/10.0
- Livability +3.0/5.0
- Rent growth +2.5/5.0
- Condition / age +2.5/5.0
$59,900
🖨 Deal sheet (PDF) 📄 Offer letter ✓ Due diligence
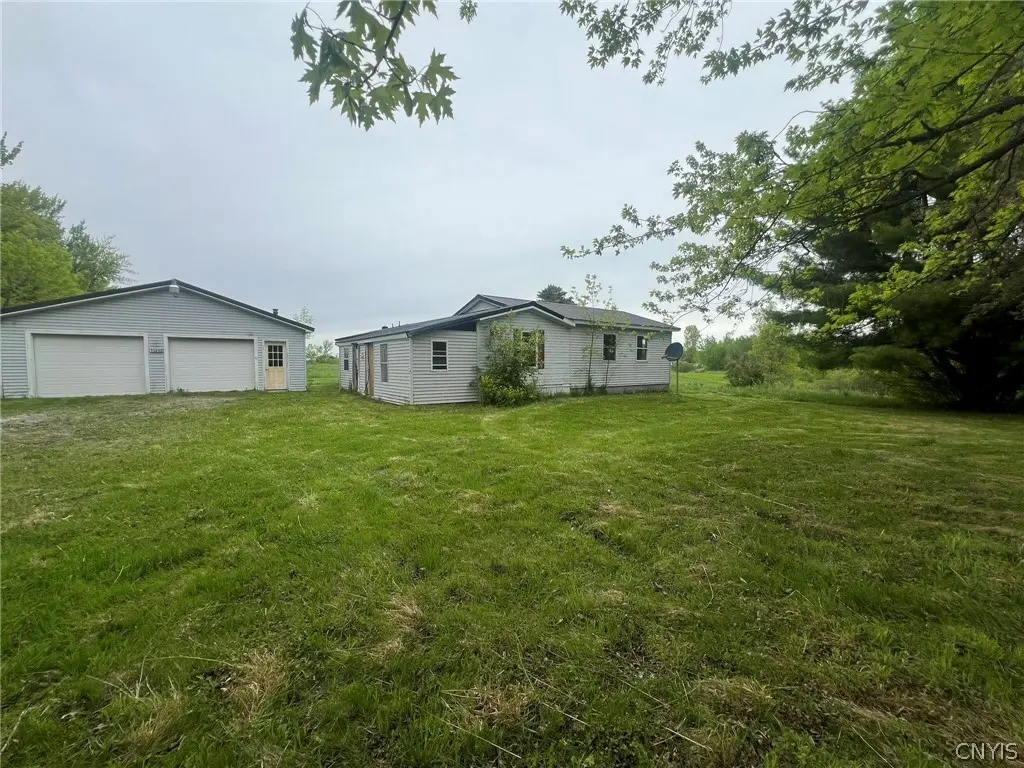
Listing remarks
Located on 1.79 acres in a rural area, this single wide mobile home with a large addition is ready for a new owner. This home has 3 bedrooms, 1 full bathroom, living room, open concept kitchen and dining room. A large two car detached garage for plenty of storage with several out buildings for any additional storage needs.
Key facts
- 1.79 acre lot
- 2 garage spots
- Built 1992
Property features AI
Exterior
- Parking: Detached garage; Two garage spaces
- Utilities: Well water; Septic tank
- Home design: Single-wide mobile home; Single-story; Existing/resale property
- Construction: Vinyl siding
- Exterior features: Dirt driveway; Irregular, rural lot (approx. 1.79 acres, 264 x 293)
Interior
- Kitchen: Country-style kitchen
- Bedrooms: Three main-level bedrooms
- Flooring: Carpet; Tile; Varied flooring
- Bathrooms: One full bathroom on the main level
- Heating & cooling: Propane heating
- Interior features: Separate/formal living room; Country kitchen; Workshop
- Laundry & utility: Main-level laundry
Neighborhood map
What this means for you Summary
Snapshot
- This is a 3-bed/1.0-bath manufactured listed at $60k.
Deal economics
- At list price, monthly cash flow is $591 ($7k/yr) — positive.
- The deal already cash-flows at list — no discount required.
- Meets the 1% rule at list price ($1k rent vs $60k).
Location & tenants
- Location reads 60/100 on livability (#996 in NY) — a middle-class / working-renter tenant base. Strengths: crime A, housing B; Watch: employment C-, health & safety D, amenities F.
- Indian River Central School District (rural): math 33% / reading 50% proficiency, ranked #502 of 590 in NY (top 85%) — families likely to look elsewhere, expect single-tenant / working-renter base with shorter leases.
- Zoned schools: Evans Mills Primary School (math 37% / reading 54%, grade D-, #1,268 of 2,108 statewide, top 60%, 375 students, 60% FRL); Indian River Middle School (math 26% / reading 50%, grade F, #442 of 729 statewide, top 61%, 672 students, 60% FRL); Indian River High School (math 98% / reading 90%, grade A+, #124 of 1,100 statewide, top 12%, 781 students, 49% FRL) — zoned schools average 57% FRL vs 28% district-wide (29 pts higher); higher-poverty schools than district average — tighter screening recommended.
- Zoned-school proficiency averages 59% at this address vs 42% district-wide (+18 pts) — the actual schools serving this property are materially stronger than the Indian River Central School District average implies; a family-tenant draw the district grade alone would hide.
- Market conditions: 24 active listings in the ZIP; 196 units permitted in Jefferson County in 2024 (0 in 5+ unit buildings).
Forward outlook
- In year one you build about $6k of equity ($414 loan paydown + $5k appreciation (9.0% local appreciation)).
- Jefferson County population projected at -12% by 2050 — secular population decline; favor cash flow + early exit over multi-decade hold.
- At projected returns (9.0% appreciation + 3.0% rent growth), your $17k cash investment doubles in ~2 years — after that, you're playing with house money.
- By year 6, paydown + projected appreciation supports a ~$34k cash-out refi (75% LTV) — recoverable capital for the next deal without selling this one.
Negotiation context
- Only 11 days on market — expect competitive offers; lowballing is unlikely to land.
Questions for the listing agent
- Is there a deadline driving the sale (1031 exchange, divorce, estate, relocation)? That informs how much negotiation room exists.
- Schools are D-rated, which usually means shorter tenancies and higher turnover. Who's the typical renter profile here, and what's been the actual vacancy rate?
- What's the average days-on-market for RENTAL listings here right now (not sales)? A rising rental-DOM trend means longer vacancies and softer asking-rent achievability than the comps imply.
- What's the recent tenant-quality profile in this submarket — average credit score on applications, eviction rate, late-payment / NSF rate, and stable-employment percentage? A property-management company in the area should have these aggregated.
- How much new for-sale + rental construction is in the pipeline within 1–3 miles? Heavy new supply typically softens prices + rents 12–24 months out; constrained supply supports both.
Investment metrics
- 1% rule
- 2.12% ✓
- Cap rate
- 18.13%
- Cash-on-cash
- 42.27%
- DSCR
- 2.88
- GRM
- 3.9
CMA / ARV
No comps found within radius.
Projected returns pro-forma
9.04% appreciation · 3.0% rent growth · sell at horizon
- IRR
- 55.8%
- Equity multiple
- 4.96×
- Total profit
- $66,374
- Equity at exit
- $49,821
- IRR
- 50.1%
- Equity multiple
- 10.84×
- Total profit
- $165,100
- Equity at exit
- $103,319
Cash invested: $16,772 (down + closing). Projections, not guarantees.
Landlord ↔ Tenant lean methodology
- Overall (STATE)
- 15 Strongly Tenant-Friendly
- State New York
- 15 Strongly Tenant-Friendly · D+10
- County
- — inherits STATE
- City
- — inherits STATE
ZIP-level market 13637
- Home prices YoY
- 2.3%
- Active inventory
- 24
- Price-to-rent
- 3.9×
Monthly cashflow live
- Estimated rent
- $1,268 medium interval (Pro) →
- Mortgage (P&I)
- −$314
- Tax from tax record
- −$72 /mo · $864/yr
- Insurance
- −$25
- HOA
- −$0
- Vacancy / Maint / Mgmt
- −$266
- Net cashflow
- $591
Break-even live
Sensitivity live
| Price | -10% $625 | -5% $608 | +0% $591 | +5% $574 | +10% $557 |
|---|---|---|---|---|---|
| Rent | -10% $491 | -5% $541 | +0% $591 | +5% $641 | +10% $691 |
| Rate | -1.0pp $621 | -0.5pp $606 | base $591 | +0.5pp $575 | +1.0pp $559 |
UW: 25.0% down · 7.5% · 30yr · 1.5% tax · 5.0% vac · 8.0% maint · 8.0% mgmt
Financing live
Cash to close
- Down payment
- $14,975
- Closing costs
- $1,797
- Reserves months
- —
- Total cash needed
- —
Loan-product check · same deal, 3 products live
Conventional
25% down · 7.5% · 30yr
- Down + closing
- —
- Monthly P&I
- —
- Monthly cashflow
- —
- DSCR
- —
- Eligible?
- —
Personal DTI + credit; lowest rate.
DSCR
20% down · 8.5% · 30yr
- Down + closing
- —
- Monthly P&I
- —
- Monthly cashflow
- —
- DSCR
- —
- Eligible?
- —
No personal income docs; deal must DSCR.
Hard money
10% down · 12.0% · 12mo
- Down + closing
- —
- Monthly P&I
- —
- Monthly cashflow
- —
- DSCR
- —
- Eligible?
- —
Short-term bridge; refi at stabilization.
Listing history 7 events
-
2026-06-05status $59,900 Pending 11 DOM
-
2026-06-03days on market $59,900 Active 11 DOM
-
2026-06-02days on market $59,900 Active 10 DOM
-
2026-06-01days on market $59,900 Active 9 DOM
-
2026-05-31days on market $59,900 Active 8 DOM
-
2026-05-30days on market $59,900 Active 7 DOM
-
2026-05-23$59,900 Active
ⓘ Source: listings_history table (triggers on properties + properties_extension) + one-shot
backfill from property_details.listing_events for pre-trigger history.
Tax reassessment forecast NY · Partial reset (capped growth)
- Current annual tax
- $864 · $72/mo
- Projected year-2 tax
- $938 · $78/mo
- Expected delta
- +$74/yr (+$6/mo · 8.6%)
ⓘ Screening estimate from a state-policy table — verify with the county assessor before closing.
Climate risk First Street
- Flood 1/10 Low FEMA zone X (unshaded) · 0% chance over 30 yrs
- Wildfire 1/10 Low
- Heat 1/10 Low 7 d/yr ≥91°F today · 15 d/yr by 30 yrs out
- Wind 1/10 Low
- Air quality 2/10 Low 1 unhealthy d/yr today · 1 by 30 yrs out
Nearby sold comps map
Loading sold comps map…
Walkable amenities ~0.75 mi
Loading nearby amenities…
Taxation est. · year 1
- Rental income
- $15,218
- − Mortgage interest
- −$3,355
- − Property taxes
- −$864
- − Insurance
- −$300
- − Repairs & maintenance
- −$1,217
- − Management
- −$1,217
- − Depreciation
- −$1,743
- Taxable income
- $6,522
- Est. tax owed @ 24.0%
- −$1,565
- After-tax cash flow
- $5,524/yr
For passive investors: Depreciation is non-cash, so a rental often shows a tax loss while cash-flowing — sheltering income. Rental losses are passive: they offset passive income freely, and up to $25,000/yr can offset ordinary (W-2) income if you actively participate and your MAGI is under $100k (phasing out to $0 by $150k); unused losses carry forward. On sale, claimed depreciation is recaptured at up to 25%, and gains may owe capital-gains tax (a 1031 exchange can defer both). Figures are a year-1 estimate at your 24.0% rate — not tax advice; consult a CPA.
Schools (NCES district)
- District
- Indian River Central School District
- NCES district ID
- 3615300
- Math proficiency
- 33% ▼ -21.00%
- Reading proficiency
- 50% ▲ 1.00%
- Median HH income
- $45,599
- Composite
- 35.25/100
- National rank
- #4977
- State rank
- #502 of 590 in NY
Livability — Fort Drum
- Score
- 60/100
- State rank
- #996
- US rank
- #19459
Category grades
Schools grade is shown separately in the Schools card above.
Census & demographics
- City population
- 16,673
- Population (ZIP)
- 5,280
Population outlook (Jefferson County) Hauer SSP2
- Today (2025)
- 111,748 people
- By 2030
- 109,370 · -2.1%
- By 2040
- 103,828 · -7.1%
- By 2050
- 98,523 · -11.8%
- By 2075
- 91,422 · -18.2%
- By 2100
- 78,214 · -30.0%
Race, ethnicity, and origin ACS 2023
- Neighborhood character
- Diverse neighborhood (Simpson 0.64)
- Race & ethnicity
- White 54% Hispanic / Latino 22% Two or more races 14% Black 12% Pacific Islander 3%
- Hispanic origin (detail)
- Mexican 7% Puerto Rican 3%
- Common ancestry
- Romanian 4% Lithuanian 2% Serbian 1%
- Foreign-born
- 11% · Canada, Jamaica
- Languages at home
- 79% English-only · Spanish 10% German/W. Germanic 3% French/Haitian/Cajun 3%
Political lean MEDSL · Jefferson
- 2024 margin
- Strong R (+23.6) · D 38.2% · R 61.8%
- 2008→2024 swing
- -18.3pp toward R · 2008: -5.3pp · 2024: -23.6pp
- All cycles
- 2024: R+23.6 2020: R+19.0 2016: R+22.4 2012: R+2.9 2008: R+5.3
Not yet ingested
- Civics
- —
Market trends
- HPI YoY
- ▲ 9.04%
- Current HPI
- 402.6102
- Rent YoY
- —
- Metro
- —
- State GDP YoY
- ▲ 2.60%
- F500 in state
- 92
Industry mix (Fortune 500 HQ in NY)
| Industry | F500 HQs | Revenue |
|---|---|---|
| Financial Services | 10 | $950B |
|
||
| Consumer Goods | 9 | $162B |
|
||
| Insurance | 4 | $225B |
|
||
| Telecommunications | 2 | $144B |
|
||
| Pharmaceuticals | 2 | $112B |
|
||
| Media / Entertainment | 2 | $69B |
|
||
Price history
1 event — show timeline
- 2026-05-23 Listed $59,900 CNYIS
Property tax history
+0.8%/yrLatest (2025): $864 · +0.3% YoY. Source: county tax records.
Cash-flow waterfall
monthlySold comps — $/sqft
last 12 mo · ≤1 miLoading sold comps…