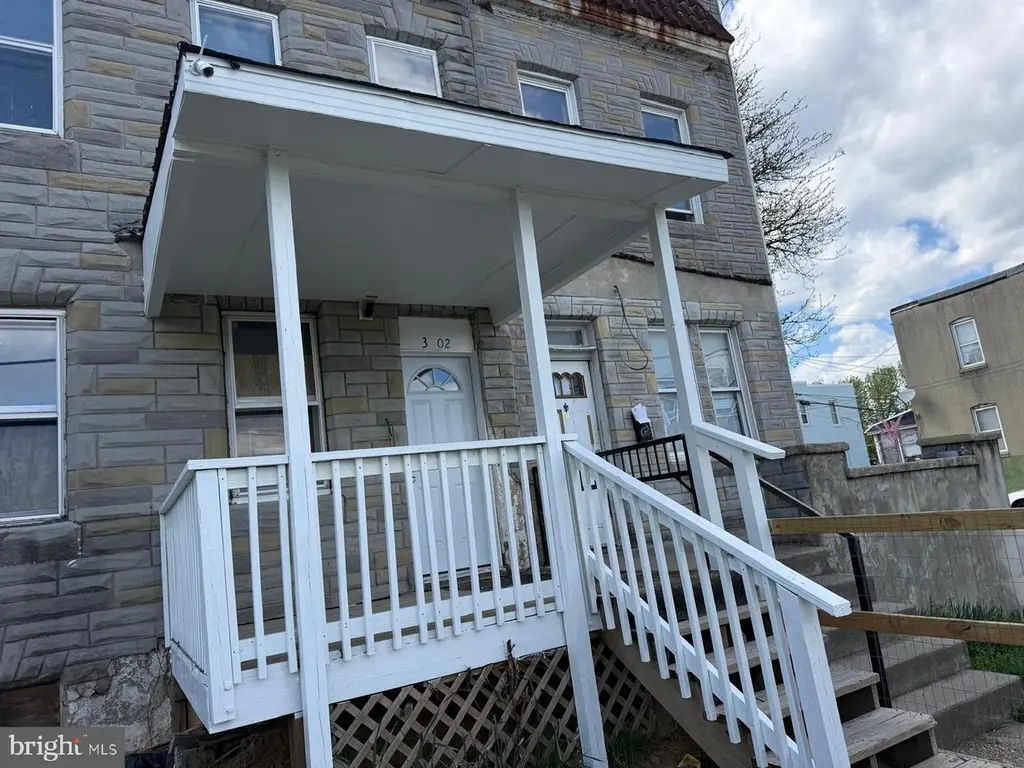
3802 Pennington Ave · Baltimore, MD
Flood risk 1/10 · Minimal
- FEMA flood zone
- X (unshaded)
- Chance of flooding over 30 yrs
- 0.0%
- Est. flood insurance / yr
- $473 – $860
Fire risk 1/10 · Minimal
- Est. fire insurance / yr
- $755 – $1,403
Heat risk 8/10 · Major
- Hot days now (above 103°F)
- 7 days/yr
- Hot days in 30 yrs
- 15 days/yr
Wind risk 6/10 · Moderate
- Chance of severe wind over 30 yrs
- 27.0%
Air-quality risk 4/10 · Minor
- Unhealthy air days now
- 5 days/yr
- Unhealthy air days in 30 yrs
- 7 days/yr
Risk factors via First Street. Map © Google.
Why this score? — see what drove the B grade
The composite is a weighted blend of 9 inputs, each scored 0–100. Each bar is that input's sub-score; the figure is the points it added to the 100-point composite (weight × sub-score).
- Cash flow +28.4/30.0
- DSCR +10.0/10.0
- Appreciation +8.9/10.0
- 1% rule +7.5/10.0
- ARV discount +7.5/15.0
- Livability +3.8/5.0
- Rent growth +2.5/5.0
- Condition / age +2.5/5.0
- Schools +1.0/10.0
$139,900
🖨 Deal sheet (PDF) 📄 Offer letter ✓ Due diligence
Listing remarks
Adorable 3BR/1BA Townhome located on a tree-lined street in Curtis Bay. Make your way through the Adorable 3BR/1BA renovated townhome located on a tree-lined street in Brooklyn. Make your way through the gated front yard, step up to the covered front porch, and open the door into your forever home. Step inside this newly renovated, move-in-ready home featuring a warm color palette, tile and easy care flooring, and plenty of natural light. The main floor features a large living room with an arched opening into the large eat-in kitchen. The kitchen offers abundant cabinets, including a pantry cabinet, new appliances, a stainless sink under a double window, and plenty of room for a dining tab
Key facts
- Built 1926
- Listed 16 days
Property features AI
Finance
- Other: Total below-grade area approximately 480; Above-grade finished area approximately 960; Lot dimensions approximately 16 x 85 (estimated)
Exterior
- Parking: On-street parking
- Utilities: Public water; Public sewer; Electric available; Natural gas available; Sewer available; Water available
- Home design: Interior townhouse/rowhouse; Three levels in unit; Fee simple ownership; Excellent condition; Effective remodel or major renovation in 2025
- Construction: Mixed construction materials; Block foundation; Above-grade and below-grade structures; Year built information from assessor
- Exterior features: Front yard; Landscaping; Rear yard
Interior
- Kitchen: Disposal; Dishwasher; Icemaker; Microwave; Refrigerator; Stove
- Bedrooms: Three bedrooms on the first upper level
- Bathrooms: One full bathroom (all upper levels)
- Heating & cooling: Central heating; Natural gas heating; Electric cooling
- Interior features: Open floor plan; Full, unfinished basement (other/unfinished)
- Laundry & utility: Washer; Dryer; Laundry located in the basement; Natural gas water heater
Neighborhood map
What this means for you Summary
Snapshot
- This is a 3-bed/1.0-bath townhouse listed at $140k.
Deal economics
- At list price, monthly cash flow is $454 ($5k/yr) — positive.
- The deal already cash-flows at list — no discount required.
- Meets the 1% rule at list price ($2k rent vs $140k).
- Recommended offer: $138k (1.5% below list) — sets the bar for market timing.
- Cap rate 10.2% vs local median 6.0% in Baltimore — top-decile yield for the area; either an underpriced asset or a hidden risk that comps aren't pricing in. Stress-test before assuming the spread holds.
Location & tenants
- Location reads 76/100 on livability (#90 in MD, #3,396 nationally) — a middle-class / working-renter tenant base. Strengths: amenities A+, commute A+, housing A+; Watch: schools D, crime F.
- Baltimore City Public Schools (urban): math 7% / reading 16% proficiency, ranked #24 of 24 in MD (top 100%) — low school quality limits family demand, transient renter base, plan for 1-2y turnover; 79% free/reduced lunch — lower-income household profile, screen leases tightly.
- Market conditions: 45 active listings in the ZIP; 18 comparable units currently listed for rent nearby; rentals at typical pace (median 25d on market — plan ~3-4 weeks tenant-placement turnaround); 1,273 units permitted in Baltimore city in 2024 (1,104 in 5+ unit buildings).
Forward outlook
- In year one you build about $12k of equity ($967 loan paydown + $11k appreciation (7.8% local appreciation)).
- Baltimore County population projected to shrink 4% by 2050 — rents likely to lag national; underwrite the cash flow, not the appreciation.
- At projected returns (7.8% appreciation + 3.0% rent growth), your $39k cash investment doubles in ~3 years — after that, you're playing with house money.
- By year 4, paydown + projected appreciation supports a ~$41k cash-out refi (75% LTV) — recoverable capital for the next deal without selling this one.
Negotiation context
- It's been on market 17 days — a 2% lower offer ($138k) is reasonable based on typical stale-listing flexibility.
- 5 sale attempts since 24y ago; this cycle's ask is 159% above the opening price — seller raised mid-cycle; expect resistance to lowballs.
- Current owner paid $51k; list at $140k implies a 174% gain — meaningful room to come down on a strong offer.
Risks & watch-outs
- Watch-outs: built in 1926 — expect roof / HVAC / electrical / plumbing capex.
- Climate carrying-cost: major wind risk, 27% chance of damaging wind over 30y; extreme-heat days projected 7→15/yr by 2055 (HVAC capex compounding) — expect insurance premiums to compound above CPI over the hold.
Questions for the listing agent
- Built in 1926 — when were the roof, HVAC, electrical panel, plumbing, and water heater last replaced?
- Is there a deadline driving the sale (1031 exchange, divorce, estate, relocation)? That informs how much negotiation room exists.
- Schools are D-rated, which usually means shorter tenancies and higher turnover. Who's the typical renter profile here, and what's been the actual vacancy rate?
- Crime grade is F in this area — have there been break-ins, vandalism, or insurance claims at this property in the last 3 years? What carrier currently insures it and at what premium?
- What's the average days-on-market for RENTAL listings here right now (not sales)? A rising rental-DOM trend means longer vacancies and softer asking-rent achievability than the comps imply.
- What's the recent tenant-quality profile in this submarket — average credit score on applications, eviction rate, late-payment / NSF rate, and stable-employment percentage? A property-management company in the area should have these aggregated.
- How much new for-sale + rental construction is in the pipeline within 1–3 miles? Heavy new supply typically softens prices + rents 12–24 months out; constrained supply supports both.
Investment metrics
- 1% rule
- 1.25% ✓
- Cap rate
- 10.18%
- Cash-on-cash
- 13.89%
- DSCR
- 1.62
- GRM
- 6.7
CMA / ARV
- ARV (on-the-fly)
- $79,680
- Comps found
- 12
Show comp detail 12 sales within ~0.75 mi
| Address | Dist | Beds/Ba | Sqft | Sold | Price | $/sf | Match |
|---|---|---|---|---|---|---|---|
| 1347 Cambria St | 0.16mi | 3/2.5 | 986 (+3%) | 3mo | $177,000 | $180 | 80 |
| 1150 Monroe Cir | 0.18mi | 3/1.0 | 1,024 (+7%) | 6mo | $55,000 | $54 | 75 |
| 3601 9th St | 0.54mi | 3/1.0 | 960 (0%) | 7mo | $35,000 | $36 | 69 |
| 4523 Pennington Ave | 0.40mi | 2/2.0 (-1) | 1,008 (+5%) | 4mo | $105,000 | $104 | 60 |
| 4101 Morrison Ct | 0.17mi | 2/1.0 (-1) | 832 (-13%) | 6mo | $32,500 | $39 | 60 |
| 3731 10th St | 0.41mi | 2/1.0 (-1) | 1,041 (+8%) | 3mo | $125,000 | $120 | 59 |
| 4221 Morrison Ct | 0.25mi | 2/1.5 (-1) | 832 (-13%) | 1mo | $25,000 | $30 | 58 |
| 4206 Grace Ct | 0.23mi | 2/1.0 (-1) | 832 (-13%) | 6mo | $60,500 | $73 | 57 |
| 3948 Brooklyn Ave | 0.73mi | 3/1.5 | 1,080 (+12%) | 0mo | $90,000 | $83 | 43 |
| 3712 8th St | 0.64mi | 2/1.5 (-1) | 1,088 (+13%) | 0mo | $60,000 | $55 | 41 |
| 1607 Cereal St | 0.62mi | 2/1.0 (-1) | 840 (-12%) | 7mo | $70,000 | $83 | 40 |
| 4009 8th St | 0.65mi | 2/2.5 (-1) | 1,088 (+13%) | 2mo | $223,000 | $205 | 35 |
Match score weights: distance 35% · size 25% · config 20% · recency 20%. Top-matched comps best support the ARV.
Projected returns pro-forma
7.75% appreciation · 3.0% rent growth · sell at horizon
- IRR
- 30.3%
- Equity multiple
- 3.15×
- Total profit
- $84,292
- Equity at exit
- $103,913
- IRR
- 27.2%
- Equity multiple
- 6.69×
- Total profit
- $223,057
- Equity at exit
- $204,045
Cash invested: $39,172 (down + closing). Projections, not guarantees.
Landlord ↔ Tenant lean methodology
- Overall (CITY)
- 12 Strongly Tenant-Friendly
- State Maryland
- 27 Tenant-Leaning · D+14
- County
- — inherits STATE
- City Baltimore
- 12 Strongly Tenant-Friendly · D+58
ZIP-level market 21226
- Home prices YoY
- 2.5%
- Active inventory
- 45
- Price-to-rent
- 6.7×
Monthly cashflow live
- Estimated rent
- $1,748 high interval (Pro) →
- Mortgage (P&I)
- −$734
- Tax from tax record
- −$136 /mo · $1,626/yr
- Insurance
- −$58
- HOA
- −$0
- Vacancy / Maint / Mgmt
- −$367
- Net cashflow
- $454
Break-even live
Sensitivity live
| Price | -10% $533 | -5% $493 | +0% $454 | +5% $414 | +10% $374 |
|---|---|---|---|---|---|
| Rent | -10% $315 | -5% $385 | +0% $454 | +5% $523 | +10% $592 |
| Rate | -1.0pp $524 | -0.5pp $489 | base $454 | +0.5pp $417 | +1.0pp $380 |
UW: 25.0% down · 7.5% · 30yr · 1.5% tax · 5.0% vac · 8.0% maint · 8.0% mgmt
Financing live
Cash to close
- Down payment
- $34,975
- Closing costs
- $4,197
- Reserves months
- —
- Total cash needed
- —
Loan-product check · same deal, 3 products live
Conventional
25% down · 7.5% · 30yr
- Down + closing
- —
- Monthly P&I
- —
- Monthly cashflow
- —
- DSCR
- —
- Eligible?
- —
Personal DTI + credit; lowest rate.
DSCR
20% down · 8.5% · 30yr
- Down + closing
- —
- Monthly P&I
- —
- Monthly cashflow
- —
- DSCR
- —
- Eligible?
- —
No personal income docs; deal must DSCR.
Hard money
10% down · 12.0% · 12mo
- Down + closing
- —
- Monthly P&I
- —
- Monthly cashflow
- —
- DSCR
- —
- Eligible?
- —
Short-term bridge; refi at stabilization.
Rent comps 18 comps
| Address | Beds | Baths | Sqft | Rent | $/sqft | DOM | Units | Dist |
|---|---|---|---|---|---|---|---|---|
| 1353 Cambria St Brooklyn, MD | 3.0 | 2.0 | 986 | $1,600 | $1.62 | 19d | 1 | 0.14mi |
| 1305 E Patapsco Ave Brooklyn, MD | 3.0 | 1.5 | 930 | $1,650 | $1.77 | 5d | 1 | 0.21mi |
| 4216 Prudence St Curtis Bay, MD | 4.0 | 3.0 | 1116 | $2,100 | $1.88 | 45d | 1 | 0.32mi |
| 1049 E Patapsco Ave Unit a Baltimore, MD | 2.0 | 1.0 | 748 | $1,257 | $1.68 | 45d | 1 | 0.34mi |
| 3826 10th St Unit Entire House Baltimore, MD | 3.0 | 2.0 | 1110 | $2,400 | $2.16 | 25d | 1 | 0.45mi |
| 3840 8th St Brooklyn, MD | 3.0 | 1.5 | 1088 | $1,606 | $1.48 | 5d | 1 | 0.67mi |
| 3528 6th St Brooklyn, MD | 2.0 | 2.5 | 1060 | $1,500 | $1.42 | 19d | 1 | 0.83mi |
| 507 Washburn Ave Brooklyn, MD | 3.0 | 1.5 | 1024 | $2,500 | $2.44 | 5d | 1 | 0.84mi |
| 507 Washburn Ave Brooklyn, MD | 3.0 | 1.5 | 1024 | $2,500 | $2.44 | 21d | 1 | 0.84mi |
| 507 Washburn Ave Brooklyn, MD | 3.0 | 1.5 | 1024 | $2,500 | $2.44 | 25d | 1 | 0.84mi |
| 4206 Audrey Ave Brooklyn, MD | 3.0 | 3.0 | 1104 | $1,950 | $1.77 | 25d | 1 | 0.88mi |
| 4206 Audrey Ave Brooklyn, MD | 2.0 | 2.0 | 1104 | $1,275 | $1.15 | 45d | 1 | 0.88mi |
| 5215 Wasena Ave Brooklyn, MD | 3.0 | 1.0 | 1030 | $1,650 | $1.60 | 45d | 1 | 0.89mi |
| 5227 Patrick Henry Dr Brooklyn, MD | 2.0 | 1.0 | 736 | $1,326 | $1.80 | 23d | 1 | 0.99mi |
| 3513 Horton Ave Brooklyn, MD | 3.0 | 1.0 | 1020 | $1,600 | $1.57 | 19d | 1 | 1.03mi |
| 4400 4th St Unit BASEMENT Baltimore, MD | 2.0 | 1.0 | 925 | $1,350 | $1.46 | 45d | 1 | 1.07mi |
| 4207 3rd St Unit 3 Brooklyn, MD | 2.0 | 1.0 | 850 | $1,595 | $1.88 | 6d | 1 | 1.13mi |
| 1 Ballman Ct Unit 2 Baltimore, MD | 2.0 | 1.0 | 700 | $1,250 | $1.79 | 45d | 1 | 1.13mi |
Listing history 34 events
-
2026-06-21days on market $139,900 Active 17 DOM
-
2026-06-18days on market $139,900 Active 14 DOM
-
2026-06-17days on market $139,900 Active 13 DOM
-
2026-06-16days on market $139,900 Active 12 DOM
-
2026-06-15days on market $139,900 Active 11 DOM
-
2026-06-13days on market $139,900 Active 9 DOM
-
2026-06-09days on market $139,900 Active 5 DOM
-
2026-06-08days on market $139,900 Active 4 DOM
-
2026-06-07remarks 699-char remark
-
2026-06-07statusdays on market $139,900 Active 3 DOM
-
2026-06-04days on market $139,900 Coming Soon 8 DOM
-
2026-06-03days on market $139,900 Coming Soon 7 DOM
-
2026-06-02days on market $139,900 Coming Soon 6 DOM
-
2026-06-01days on market $139,900 Coming Soon 5 DOM
-
2026-05-31days on market $139,900 Coming Soon 4 DOM
-
2026-05-27historical $139,900
-
2021-07-20soldstatus $51,000
-
2021-04-09soldstatus $51,000 Closed
-
2021-03-06status Pending
-
2021-03-03historical
-
2021-02-20price $51,000
-
2021-02-01price $52,000
-
2021-01-10$54,000 Active
-
2017-02-13historical Withdrawn
-
2017-02-13historical
-
2017-02-03price
-
2017-01-27status Active
-
2017-01-25status Contract
-
2017-01-08Active
-
2017-01-08$55,000
-
2002-08-23soldstatus $40,000
-
2002-07-18soldstatus $40,000
-
2002-07-10historical
-
2002-06-04$42,000
ⓘ Source: listings_history table (triggers on properties + properties_extension) + one-shot
backfill from property_details.listing_events for pre-trigger history.
Tax reassessment forecast MD · Partial reset (capped growth)
- Current annual tax
- $1,626 · $136/mo
- Projected year-2 tax
- $1,626 · $136/mo
- Expected delta
- $0/yr ($0/mo · 0.0%)
ⓘ Screening estimate from a state-policy table — verify with the county assessor before closing.
Climate risk First Street
- Flood 1/10 Low FEMA zone X (unshaded) · 0% chance over 30 yrs
- Wildfire 1/10 Low
- Heat 8/10 Severe 7 d/yr ≥103°F today · 15 d/yr by 30 yrs out
- Wind 6/10 Major 27% chance of damaging wind over 30 yrs
- Air quality 4/10 Moderate 5 unhealthy d/yr today · 7 by 30 yrs out
Nearby sold comps map
Loading sold comps map…
Walkable amenities ~0.75 mi
Loading nearby amenities…
Taxation est. · year 1
- Rental income
- $20,978
- − Mortgage interest
- −$7,837
- − Property taxes
- −$1,626
- − Insurance
- −$700
- − Repairs & maintenance
- −$1,678
- − Management
- −$1,678
- − Depreciation
- −$4,070
- Taxable income
- $3,389
- Est. tax owed @ 24.0%
- −$813
- After-tax cash flow
- $4,630/yr
For passive investors: Depreciation is non-cash, so a rental often shows a tax loss while cash-flowing — sheltering income. Rental losses are passive: they offset passive income freely, and up to $25,000/yr can offset ordinary (W-2) income if you actively participate and your MAGI is under $100k (phasing out to $0 by $150k); unused losses carry forward. On sale, claimed depreciation is recaptured at up to 25%, and gains may owe capital-gains tax (a 1031 exchange can defer both). Figures are a year-1 estimate at your 24.0% rate — not tax advice; consult a CPA.
Schools (NCES district)
- District
- Baltimore City Public Schools
- NCES district ID
- 2400090
- Math proficiency
- 7% ▼ -9.00%
- Reading proficiency
- 16% ▼ -5.00%
- Median HH income
- $42,108
- Composite
- 10.08/100
- National rank
- #9805
- State rank
- #24 of 24 in MD
Livability — Baltimore
- Score
- 76/100
- State rank
- #90
- US rank
- #3396
Category grades
Schools grade is shown separately in the Schools card above.
Census & demographics
- Census place
- Baltimore, MD
- City population
- 588,727
- Population (ZIP)
- 6,593
Population outlook (Baltimore County) Hauer SSP2
- Today (2025)
- 624,249 people
- By 2030
- 621,541 · -0.4%
- By 2040
- 609,756 · -2.3%
- By 2050
- 597,249 · -4.3%
- By 2075
- 552,236 · -11.5%
- By 2100
- 513,934 · -17.7%
Race, ethnicity, and origin ACS 2023
- Neighborhood character
- Diverse neighborhood (Simpson 0.61)
- Race & ethnicity
- White 59% Black 18% Two or more races 13% Hispanic / Latino 8% Asian 4%
- Hispanic origin (detail)
- Mexican 4% Puerto Rican 3%
- Common ancestry
- Slovak 7% Romanian 2% Scotch-Irish 1%
- Foreign-born
- 7% · Canada, Jamaica
- Languages at home
- 91% English-only · Spanish 7% Tagalog/Filipino 1% Other Indo-European 1%
Political lean MEDSL · Baltimore
- 2024 margin
- Solid D (+73.0) · D 85.2% · R 12.2% · Other 2.6%
- 2008→2024 swing
- -2.5pp toward R · 2008: 75.5pp · 2024: 73.0pp
- All cycles
- 2024: D+73.0 2020: D+76.6 2016: D+74.6 2012: D+76.4 2008: D+75.5
Not yet ingested
- Civics
- —
Market trends
- HPI YoY
- ▲ 7.75%
- Current HPI
- 318.79
- Rent YoY
- —
- Metro
- —
- State GDP YoY
- ▲ 2.97%
- F500 in state
- 12
Industry mix (Fortune 500 HQ in MD)
| Industry | F500 HQs | Revenue |
|---|---|---|
| Aerospace / Defense | 1 | $71B |
|
||
| Utilities | 1 | $25B |
|
||
| Hotels | 1 | $24B |
|
||
| Consumer Goods | 1 | $7B |
|
||
| Real Estate | 1 | $6B |
|
||
| Chemicals | 1 | $2B |
|
||
Price history
+233.1% since first listed19 events — show timeline
- 2026-05-27 Coming Soon $139,900 BRIGHT MLS
- 2021-07-20 Sold (Public Records) $51,000 Public Records
- 2021-04-09 Sold (MLS) $51,000 BRIGHT MLS
- 2021-03-06 Pending — BRIGHT MLS
- 2021-03-03 Listing Removed — BRIGHT MLS
- 2021-02-20 Price Changed $51,000 BRIGHT MLS
- 2021-02-01 Price Changed $52,000 BRIGHT MLS
- 2021-01-10 Listed $54,000 BRIGHT MLS
- 2017-02-13 Listing Removed — BRIGHT MLS
- 2017-02-13 Delisted — MRIS
- 2017-02-03 Price Changed — MRIS
- 2017-01-27 Relisted — MRIS
- 2017-01-25 Pending — MRIS
- 2017-01-08 Listed — MRIS
- 2017-01-08 Listed $55,000 BRIGHT MLS
- 2002-08-23 Sold (Public Records) $40,000 Public Records
- 2002-07-18 Sold (MLS) $40,000 MRIS
- 2002-07-10 Delisted — MRIS
- 2002-06-04 Listed $42,000 MRIS
Property tax history
+0.7%/yrLatest (2025): $1,626 · +1.4% YoY. Source: county tax records.
Cash-flow waterfall
monthlySold comps — $/sqft
last 12 mo · ≤1 miLoading sold comps…