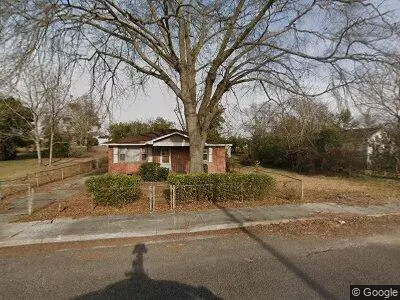
1020 13th Ave · Augusta-Richmond County consolidated government (balance), GA
Flood risk 7/10 · Major
- FEMA flood zone
- AE
- Chance of flooding over 30 yrs
- 0.75%
- Est. flood insurance / yr
- $1,737 – $8,500
Fire risk 3/10 · Minor
- Est. fire insurance / yr
- $963 – $1,789
Heat risk 8/10 · Major
- Hot days now (above 108°F)
- 7 days/yr
- Hot days in 30 yrs
- 17 days/yr
Wind risk 6/10 · Moderate
- Chance of severe wind over 30 yrs
- 66.0%
Air-quality risk 3/10 · Minor
- Unhealthy air days now
- 3 days/yr
- Unhealthy air days in 30 yrs
- 3 days/yr
Risk factors via First Street. Map © Google.
Why this score? — see what drove the A- grade
The composite is a weighted blend of 9 inputs, each scored 0–100. Each bar is that input's sub-score; the figure is the points it added to the 100-point composite (weight × sub-score).
- Cash flow +30.0/30.0
- ARV discount +15.0/15.0
- 1% rule +10.0/10.0
- DSCR +10.0/10.0
- Appreciation +9.1/10.0
- Livability +2.5/5.0
- Condition / age +2.5/5.0
- Rent growth +2.2/5.0
- Schools +1.3/10.0
$45,000
🖨 Deal sheet 📄 Offer letter ✓ Due diligence
Listing remarks
This home has a good structure, but has minor exterior and interior damage . It was listed at 49,000. However, because of the damage, we will sell it for 45,000. Asking & acirc; & euro; & oelig; As Is. & acirc; & euro; �
Key facts
- Built 1962
- Listed 37 days
Property features AI
Exterior
- Home design: Built in 1962
- Construction: Single-family property with 952 square feet of living area
- Exterior features: Located in the South Turpin Hill subdivision
Neighborhood map
What this means for you Summary
Snapshot
- This is a 2-bed/1.0-bath single-family listed at $45k.
Deal economics
- At list price, monthly cash flow is $146 ($2k/yr) — positive.
- The deal already cash-flows at list — no discount required.
- Meets the 1% rule at list price ($1k rent vs $45k).
- Recommended offer: $44k (3.0% below list) — sets the bar for market timing.
- Cap rate 21.6% vs local median 5.3% in Augusta-Richmond County consolidated government (balance) — top-decile yield for the area; either an underpriced asset or a hidden risk that comps aren't pricing in. Stress-test before assuming the spread holds.
Location & tenants
- Location reads: area grade A — affects rentability + tenant quality, not the cash-flow math above.
- Richmond County (urban): math 12% / reading 20% proficiency, ranked #154 of 174 in GA (top 88%) — low school quality limits family demand, transient renter base, plan for 1-2y turnover; 72% free/reduced lunch — lower-income household profile, screen leases tightly.
- Market conditions: Rents soft (-1.3%/yr); 129 active listings in the ZIP; 18 comparable units currently listed for rent nearby; rentals lingering (median 44d on market — plan ~5-8 weeks vacancy on turnover, expect pricing pressure); 50% of comp listings sitting > 30 days — soft ceiling on asking rent; lower-income renter base — watch delinquency; 561 units permitted in Richmond County in 2024 (0 in 5+ unit buildings).
- At $1,160/mo this rent would consume 55% of the median local household income ($25k/yr) (locally 2063% of renters already pay >50% of income on rent) — very limited rent-growth headroom before tenants either downsize or default.
Forward outlook
- In year one you build about $4k of equity ($311 loan paydown + $4k appreciation (8.2% local appreciation)).
- Richmond County population projected to shrink 5% by 2050 — rents likely to lag national; underwrite the cash flow, not the appreciation.
- At projected returns (8.2% appreciation + 0.0% rent growth), your $13k cash investment doubles in ~3 years — after that, you're playing with house money.
- By year 8, paydown + projected appreciation supports a ~$33k cash-out refi (75% LTV) — recoverable capital for the next deal without selling this one.
Negotiation context
- It's been on market 37 days — a 3% lower offer ($44k) is reasonable based on typical stale-listing flexibility.
Risks & watch-outs
- Watch-outs: flood insurance adds $427/mo.
- Climate carrying-cost: in FEMA flood zone AE (mandatory federal flood insurance); major wind risk, 66% chance of damaging wind over 30y; extreme-heat days projected 7→17/yr by 2055 (HVAC capex compounding) — expect insurance premiums to compound above CPI over the hold.
Questions for the listing agent
- It's been on market 37 days. Have you received any prior offers? Is the seller open to a 3% concession, seller financing, or rate buy-down credit?
- Built in 1962 — when were the roof, HVAC, electrical panel, plumbing, and water heater last replaced?
- What's the actual annual flood-insurance premium (NFIP or private), and is the property in a SFHA with mandatory coverage?
- Is there a deadline driving the sale (1031 exchange, divorce, estate, relocation)? That informs how much negotiation room exists.
- What's the average days-on-market for RENTAL listings here right now (not sales)? A rising rental-DOM trend means longer vacancies and softer asking-rent achievability than the comps imply.
- What's the recent tenant-quality profile in this submarket — average credit score on applications, eviction rate, late-payment / NSF rate, and stable-employment percentage? A property-management company in the area should have these aggregated.
- How much new for-sale + rental construction is in the pipeline within 1–3 miles? Heavy new supply typically softens prices + rents 12–24 months out; constrained supply supports both.
Investment metrics
- 1% rule
- 2.58% ✓
- Cap rate
- 21.55%
- Cash-on-cash
- 54.51%
- DSCR
- 3.43
- GRM
- 3.2
CMA / ARV
- ARV (on-the-fly)
- $66,640
- Comps found
- 12
Show comp detail 12 sales within ~0.75 mi
| Address | Dist | Beds/Ba | Sqft | Sold | Price | $/sf | Match |
|---|---|---|---|---|---|---|---|
| 1442 Essie Mcintyre Blvd | 0.46mi | 2/1.0 | 948 (-0%) | 5mo | $23,000 | $24 | 74 |
| 1112 7th Ave | 0.39mi | 2/1.0 | 880 (-8%) | 4mo | $62,000 | $70 | 66 |
| 2113 Dyer St | 0.17mi | 3/1.0 (+1) | 1,040 (+9%) | 8mo | $125,000 | $120 | 65 |
| 1426 Essie Mcintyre Blvd | 0.42mi | 2/1.0 | 1,015 (+7%) | 10mo | $54,000 | $53 | 61 |
| 1723 Douglas St | 0.48mi | 3/1.0 (+1) | 1,000 (+5%) | 4mo | $100,000 | $100 | 60 |
| 1105 11th Ave | 0.17mi | 3/1.0 (+1) | 1,050 (+10%) | 18mo | $115,000 | $110 | 54 |
| 2004 Roosevelt Dr | 0.73mi | 3/1.0 (+1) | 984 (+3%) | 6mo | $51,000 | $52 | 50 |
| 1439 Dewitt Street St | 0.63mi | 3/1.0 (+1) | 1,014 (+6%) | 8mo | $25,000 | $25 | 48 |
| 1635 Carpenter St | 0.68mi | 3/1.0 (+1) | 984 (+3%) | 17mo | $40,000 | $41 | 44 |
| 1012 7th Ave | 0.36mi | 3/1.0 (+1) | 1,080 (+13%) | 18mo | $75,000 | $69 | 40 |
| 1926 Kratha Drive Dr | 0.65mi | 3/1.0 (+1) | 1,050 (+10%) | 16mo | $120,000 | $114 | 34 |
| 2002 Shirley Ave | 0.74mi | 3/1.0 (+1) | 1,032 (+8%) | 17mo | $85,000 | $82 | 32 |
Match score weights: distance 35% · size 25% · config 20% · recency 20%. Top-matched comps best support the ARV.
Projected returns pro-forma
8.18% appreciation · 0.0% rent growth · sell at horizon
- IRR
- 28.4%
- Equity multiple
- 3.00×
- Total profit
- $25,243
- Equity at exit
- $34,741
- IRR
- 23.3%
- Equity multiple
- 5.82×
- Total profit
- $60,743
- Equity at exit
- $69,495
Cash invested: $12,600 (down + closing). Projections, not guarantees.
Landlord ↔ Tenant lean methodology
- Overall (STATE)
- 90 Strongly Landlord-Friendly
- State Georgia
- 90 Strongly Landlord-Friendly · R+3
- County
- — inherits STATE
- City
- — inherits STATE
ZIP-level market 30901
- Home prices YoY
- 4.1%
- Rents YoY
- -1.3%
- Active inventory
- 129
- Price-to-rent
- 3.2×
Monthly cashflow live
- Estimated rent
- $1,160 high interval (Pro) →
- Mortgage (P&I)
- −$236
- Tax from tax record
- −$89 /mo · $1,070/yr
- Insurance
- −$19
- Flood insurance flood zone
- −$427 /mo · $5,118/yr
- HOA
- −$0
- Vacancy / Maint / Mgmt
- −$244
- Net cashflow
- $146
Break-even live
UW: 25.0% down · 7.5% · 30yr · 1.5% tax · 5.0% vac · 8.0% maint · 8.0% mgmt
Financing live
Cash to close
- Down payment
- $11,250
- Closing costs
- $1,350
- Reserves months
- —
- Total cash needed
- —
Loan-product check · same deal, 3 products live
Conventional
25% down · 7.5% · 30yr
- Down + closing
- —
- Monthly P&I
- —
- Monthly cashflow
- —
- DSCR
- —
- Eligible?
- —
Personal DTI + credit; lowest rate.
DSCR
20% down · 8.5% · 30yr
- Down + closing
- —
- Monthly P&I
- —
- Monthly cashflow
- —
- DSCR
- —
- Eligible?
- —
No personal income docs; deal must DSCR.
Hard money
10% down · 12.0% · 12mo
- Down + closing
- —
- Monthly P&I
- —
- Monthly cashflow
- —
- DSCR
- —
- Eligible?
- —
Short-term bridge; refi at stabilization.
Rent comps 18 comps
| Address | Beds | Baths | Sqft | Rent | $/sqft | DOM | Units | Dist |
|---|---|---|---|---|---|---|---|---|
| 2230 Hollis Rd Augusta, GA | 2.0 | 1.0 | 1000 | $975 | $0.97 | 43d | 1 | 0.39mi |
| 1750 Essie McIntyre Blvd Augusta, GA | 2.0 | 1.0 | 720 | $950 | $1.32 | 43d | 1 | 0.88mi |
| 1610 Cornell Dr Augusta, GA | 3.0 | 1.0 | 1025 | $1,100 | $1.07 | 43d | 1 | 1.04mi |
| 1610 Cornell Dr Augusta, GA | 3.0 | 1.0 | 1025 | $1,100 | $1.07 | 23d | 1 | 1.04mi |
| 2125 Kennedy Dr Augusta, GA | 2.0 | 1.0 | 750 | $795 | $1.06 | 13d | 1 | 1.10mi |
| 1601 12th St Unit 1601 Augusta, GA | 2.0 | 1.0 | 550 | $875 | $1.59 | 43d | 1 | 1.13mi |
| 1601 12th St Unit 1603 Augusta, GA | 1.0 | 1.0 | 550 | $875 | $1.59 | 21d | 1 | 1.13mi |
| 2128 Roosevelt Dr Augusta, GA | 3.0 | 2.0 | 1050 | $1,340 | $1.28 | 23d | 1 | 1.14mi |
| 1425 Lee Beard Way Augusta, GA | 1.0–2.0 | 1.0 | 776 | $1,181 | $1.52 | 43d | 1 | 1.20mi |
| 2020 Garr Dr Augusta, GA | 3.0 | 1.0 | 1100 | $1,200 | $1.09 | 13d | 1 | 1.21mi |
| 1480 Wrightsboro Rd Augusta, GA | 1.0–3.0 | 1.0–2.0 | 1046 | $1,862 | $1.78 | 21d | 13 | 1.26mi |
| 1480 Wrightsboro Rd Augusta, GA | 1.0 | 1.0 | 775 | $1,628 | $2.10 | 13d | 1 | 1.26mi |
| 2401 Norfolk St Augusta, GA | 2.0 | 1.0 | 991 | $949 | $0.96 | 43d | 1 | 1.27mi |
| 2726 Landing Loop Dr Augusta, GA | 3.0 | 2.0 | 1008 | $1,025 | $1.02 | 44d | 1 | 1.42mi |
| 1328 Baker Ave Augusta, GA | 2.0 | 1.0 | 761 | $975 | $1.28 | 43d | 1 | 1.45mi |
| 1313 Wilson St Apt C Augusta, GA | 2.0 | 2.0 | 900 | $1,350 | $1.50 | 43d | 1 | 1.47mi |
| 1712 Kissingbower Rd Augusta, GA | 2.0 | 1.0 | 1072 | $1,400 | $1.31 | 13d | 1 | 1.48mi |
| 1912 Richmond Ave Unit 1912 Augusta, GA | 2.0 | 1.0 | 812 | $1,195 | $1.47 | 13d | 1 | 1.50mi |
Listing history 15 events
-
2026-06-18days on market $45,000 Active 37 DOM
-
2026-06-17days on market $45,000 Active 36 DOM
-
2026-06-16days on market $45,000 Active 35 DOM
-
2026-06-15days on market $45,000 Active 34 DOM
-
2026-06-14days on market $45,000 Active 32 DOM
-
2026-06-10days on market $45,000 Active 29 DOM
-
2026-06-09days on market $45,000 Active 28 DOM
-
2026-06-08days on market $45,000 Active 27 DOM
-
2026-06-07days on market $45,000 Active 26 DOM
-
2026-06-03days on market $45,000 Active 22 DOM
-
2026-06-02days on market $45,000 Active 21 DOM
-
2026-06-01days on market $45,000 Active 20 DOM
-
2026-05-31days on market $45,000 Active 19 DOM
-
2026-05-30days on market $45,000 Active 18 DOM
-
2026-05-12$45,000 Active 213-char remark
ⓘ Source: listings_history table (triggers on properties + properties_extension) + one-shot
backfill from property_details.listing_events for pre-trigger history.
Tax reassessment forecast GA · Resets to sale price
- Current annual tax
- $1,070 · $89/mo
- Projected year-2 tax
- $1,070 · $89/mo
- Expected delta
- $0/yr ($0/mo · 0.0%)
ⓘ Screening estimate from a state-policy table — verify with the county assessor before closing.
Climate risk First Street
- Flood 7/10 Severe FEMA zone AE · 75% chance over 30 yrs
- Wildfire 3/10 Moderate
- Heat 8/10 Severe 7 d/yr ≥108°F today · 17 d/yr by 30 yrs out
- Wind 6/10 Major 66% chance of damaging wind over 30 yrs
- Air quality 3/10 Moderate 3 unhealthy d/yr today · 3 by 30 yrs out
Nearby sold comps map
Loading sold comps map…
Walkable amenities ~0.75 mi
Loading nearby amenities…
Taxation est. · year 1
- Rental income
- $13,917
- − Mortgage interest
- −$2,521
- − Property taxes
- −$1,070
- − Insurance
- −$5,344
- − Repairs & maintenance
- −$1,113
- − Management
- −$1,113
- − Depreciation
- −$1,309
- Taxable income
- $1,447
- Est. tax owed @ 24.0%
- −$347
- After-tax cash flow
- $1,402/yr
For passive investors: Depreciation is non-cash, so a rental often shows a tax loss while cash-flowing — sheltering income. Rental losses are passive: they offset passive income freely, and up to $25,000/yr can offset ordinary (W-2) income if you actively participate and your MAGI is under $100k (phasing out to $0 by $150k); unused losses carry forward. On sale, claimed depreciation is recaptured at up to 25%, and gains may owe capital-gains tax (a 1031 exchange can defer both). Figures are a year-1 estimate at your 24.0% rate — not tax advice; consult a CPA.
Schools (NCES district)
- District
- Richmond County
- NCES district ID
- 1304380
- Math proficiency
- 12% ▼ -9.00%
- Reading proficiency
- 20% ▼ -6.00%
- Median HH income
- $38,069
- Composite
- 13.43/100
- National rank
- #9524
- State rank
- #154 of 174 in GA
Livability — Augusta-Richmond County consolidated government (balance)
No livability data for this city. (Only ~50 U.S. cities are tracked.)
Census & demographics
- Census place
- Augusta-Richmond County consolidated government (balance), GA
- County
- Richmond County · 190,917 people
- City population
- 154,035
- Metro
- Augusta-Richmond County, GA-SC
- Population (ZIP)
- 16,484
- Household income
- $25,163
- Rent vs Own
- Severe rent burden
- 2063.0
Population outlook (Richmond County) Hauer SSP2
- Today (2025)
- 200,753 people
- By 2030
- 200,232 · -0.3%
- By 2040
- 196,813 · -2.0%
- By 2050
- 190,347 · -5.2%
- By 2075
- 172,496 · -14.1%
- By 2100
- 146,284 · -27.1%
Race, ethnicity, and origin ACS 2023
- Neighborhood character
- Predominantly Black (78%)
- Race & ethnicity
- Black 78% White 15% Two or more races 4% Hispanic / Latino 2%
- Common ancestry
- Lithuanian 1% Slovak 1%
- Foreign-born
- 1% · Canada
- Languages at home
- 97% English-only · Spanish 1%
Political lean MEDSL · Richmond
- 2024 margin
- Solid D (+36.1) · D 67.8% · R 31.7%
- 2008→2024 swing
- +4.3pp toward D · 2008: 31.8pp · 2024: 36.1pp
- All cycles
- 2024: D+36.1 2020: D+37.2 2016: D+32.4 2012: D+33.8 2008: D+31.8
Not yet ingested
- Civics
- —
Market trends
- HPI YoY
- ▲ 8.18%
- Current HPI
- 206.3145
- Rent YoY
- ▼ -1.31%
- Metro
- Augusta-Richmond County, GA-SC
- State GDP YoY
- ▲ 2.66%
- F500 in state
- 28
Industry mix (Fortune 500 HQ in GA)
| Industry | F500 HQs | Revenue |
|---|---|---|
| Paper / Packaging | 2 | $29B |
|
||
| Retail | 1 | $160B |
|
||
| Transportation / Logistics | 1 | $91B |
|
||
| Airlines | 1 | $62B |
|
||
| Consumer Goods | 1 | $47B |
|
||
| Utilities | 1 | $25B |
|
||
Price history
1 event — show timeline
- 2026-05-12 Listed $45,000 FSBO.com
Property tax history
+11.0%/yrLatest (2025): $1,070 · +19.6% YoY. Source: county tax records.
Cash-flow waterfall
monthlySold comps — $/sqft
last 12 mo · ≤1 miLoading sold comps…