 5-Plex
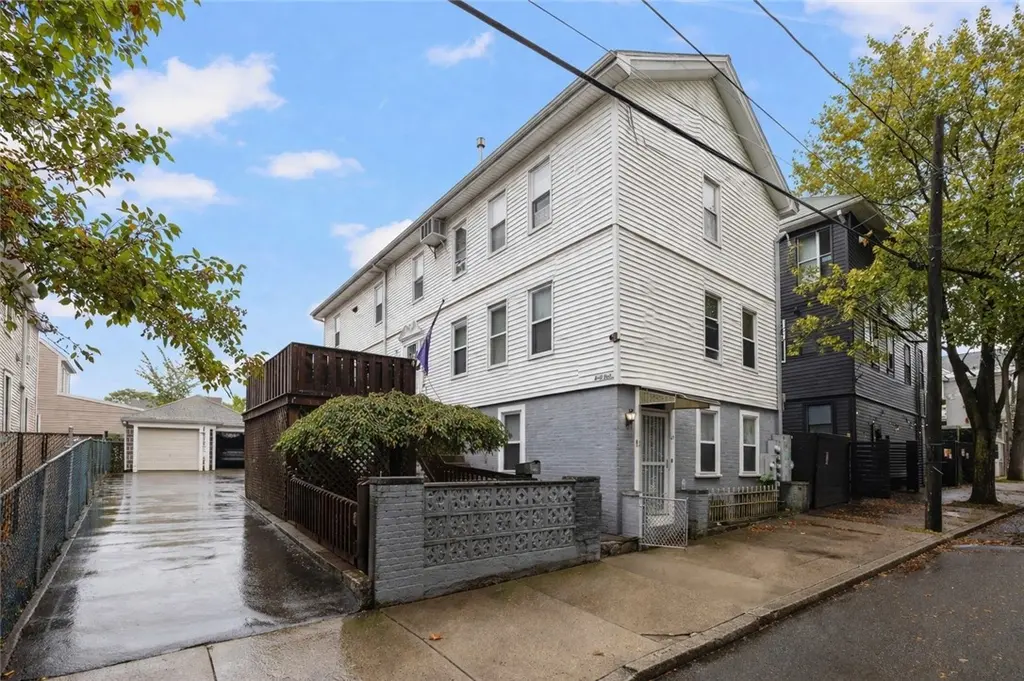
41 East Transit St · Providence, RI
Flood risk 1/10 · Minimal
- FEMA flood zone
- X (unshaded)
- Chance of flooding over 30 yrs
- 0.0%
- Est. flood insurance / yr
- $473 – $860
Fire risk 1/10 · Minimal
- Est. fire insurance / yr
- $835 – $1,551
Heat risk 6/10 · Moderate
- Hot days now (above 97°F)
- 7 days/yr
- Hot days in 30 yrs
- 15 days/yr
Wind risk 6/10 · Moderate
- Chance of severe wind over 30 yrs
- 74.0%
Air-quality risk 2/10 · Minimal
- Unhealthy air days now
- 1 days/yr
- Unhealthy air days in 30 yrs
- 2 days/yr
Risk factors via First Street. Map © Google.
Why this score? — see what drove the B- grade
The composite is a weighted blend of 9 inputs, each scored 0–100. Each bar is that input's sub-score; the figure is the points it added to the 100-point composite (weight × sub-score).
- Cash flow +29.2/30.0
- DSCR +10.0/10.0
- ARV discount +7.5/15.0
- 1% rule +7.1/10.0
- Rent growth +4.4/5.0
- Livability +4.2/5.0
- Condition / age +2.5/5.0
- Schools +1.0/10.0
- Appreciation +0.0/10.0
$1,295,000
🖨 Deal sheet (PDF) 📄 Offer letter ✓ Due diligence
Multi-family units
County records classify this as Multi-Family (5+ Unit). Listing-text estimate: 5 units. confirmed
5+ unit building — per-unit beds/baths from public records are typically unavailable; the breakdown below (if shown) is an estimate from the listing text.
Listing remarks MLS
Five Unit in Fox Point. Well-maintained and extensively updated 5-unit property in desirable Fox Point, offering a blend of strong rental income and future upside with extremely low vacancy. The property features low taxes for its size, parking for each unit and has 2 detached garages for ADU potential. Significant improvements have recently been completed, including a new roof, upgraded electrical service, central air in all units, exterior updates, a newly renovated shared laundry room and other in-unit upgrades. Located just off Ives and Wickenden and close to India Point Park, this property sits in the heart of the vibrant Fox Point neighborhood with some of Providence's best restaurants and bars. A rare opportunity to acquire a turnkey asset in one of the city's most sought-after rental markets. See MLS 1409912
Key facts
- Detached garages
- Low taxes
- 5 unit property
Tags
Neighborhood map
What this means for you Summary
Snapshot
- This is a 5 × 8-bed/5.0-bath units multifamily listed at $1.29M.
Deal economics
- At list price, monthly cash flow is $5k ($54k/yr) — positive. Per door: $905/mo.
- The deal already cash-flows at list — no discount required.
- Meets the 1% rule at list price ($16k rent vs $1.29M).
- Recommended offer: $1.28M (1.5% below list) — sets the bar for market timing.
- Cap rate 10.5% vs local median 4.2% in Providence — top-decile yield for the area; either an underpriced asset or a hidden risk that comps aren't pricing in. Stress-test before assuming the spread holds.
Location & tenants
- Location reads 84/100 on livability (#2 in RI, #794 nationally) — a professional / high-income tenant draw. Strengths: amenities A+, commute A+, housing A+; Watch: employment C-, schools F.
- Providence (urban): math 8% / reading 16% proficiency, ranked #34 of 39 in RI (top 87%) — low school quality limits family demand, transient renter base, plan for 1-2y turnover; 79% free/reduced lunch — lower-income household profile, screen leases tightly.
- Market conditions: Rents rising fast (+7.5%/yr); 145 active listings in the ZIP; solid renter incomes; 776 units permitted in Providence County in 2024 (229 in 5+ unit buildings).
- At $15,626/mo this rent would consume 182% of the median local household income ($103k/yr) (locally 1567% of renters already pay >50% of income on rent) — very limited rent-growth headroom before tenants either downsize or default.
Forward outlook
- Local home prices are declining (-3.0%/yr); year-one equity from $9k of loan paydown is wiped out by about $39k of value loss. Plan a longer hold.
- Providence County population projected at +5% by 2050 — modest demand growth; plan on rents tracking national, not racing it.
- At projected returns (-3.0% appreciation + 7.5% rent growth), your $363k cash investment doubles in ~7 years — after that, you're playing with house money.
Negotiation context
- It's been on market 22 days — a 2% lower offer ($1.28M) is reasonable based on typical stale-listing flexibility.
- 3 sale attempts since 2y ago with the ask held roughly flat each time — persistent listings suggest the price (not the market) is what's stuck; bring a comps-based counter.
- Current owner paid $660k; list at $1.29M implies a 96% gain — meaningful room to come down on a strong offer.
Risks & watch-outs
- Watch-outs: built in 1930 — expect roof / HVAC / electrical / plumbing capex.
- Climate carrying-cost: major wind risk, 74% chance of damaging wind over 30y; extreme-heat days projected 7→15/yr by 2055 (HVAC capex compounding) — expect insurance premiums to compound above CPI over the hold.
Questions for the listing agent
- Can we see the unit-by-unit rent roll, current vacancy, and any below-market leases? What's the average tenancy length?
- What capital expenditures (roof, boiler, parking lot, exteriors) have been made in the last 5 years, and what's planned in the next 2?
- Built in 1930 — when were the roof, HVAC, electrical panel, plumbing, and water heater last replaced?
- Is there a deadline driving the sale (1031 exchange, divorce, estate, relocation)? That informs how much negotiation room exists.
- Schools are F-rated, which usually means shorter tenancies and higher turnover. Who's the typical renter profile here, and what's been the actual vacancy rate?
- What's the average days-on-market for RENTAL listings here right now (not sales)? A rising rental-DOM trend means longer vacancies and softer asking-rent achievability than the comps imply.
- What's the recent tenant-quality profile in this submarket — average credit score on applications, eviction rate, late-payment / NSF rate, and stable-employment percentage? A property-management company in the area should have these aggregated.
- How much new apartment / multifamily construction is in the pipeline within 1–3 miles? Heavy new supply (>2% of stock underway) typically softens rents 12–24 months out; light construction supports rent growth.
Investment metrics
- 1% rule
- 1.21% ✓
- Cap rate
- 10.49%
- Cash-on-cash
- 14.98%
- DSCR
- 1.67
- GRM
- 6.9
CMA / ARV
- ARV (median comp)
- $664,363
- List price
- $1,295,000
- Delta
- 94.92%
- Verdict
- OVERPRICED
- Comps
- 20 within 1.0 mi
Show comp detail 1 sale within ~0.75 mi
| Address | Dist | Beds/Ba | Sqft | Sold | Price | $/sf | Match |
|---|---|---|---|---|---|---|---|
| 60 Purchase St | 0.74mi | 9/3.0 | 2,400 (-1%) | 4mo | $600,000 | $250 | 53 |
Match score weights: distance 35% · size 25% · config 20% · recency 20%. Top-matched comps best support the ARV.
Projected returns pro-forma
-3.0% appreciation · 7.46% rent growth · sell at horizon
- IRR
- 10.1%
- Equity multiple
- 1.42×
- Total profit
- $151,235
- Equity at exit
- $193,089
- IRR
- 22.4%
- Equity multiple
- 3.29×
- Total profit
- $830,726
- Equity at exit
- $111,968
Cash invested: $362,600 (down + closing). Projections, not guarantees.
Landlord ↔ Tenant lean methodology
- Overall (STATE)
- 31 Tenant-Leaning
- State Rhode Island
- 31 Tenant-Leaning · D+8
- County
- — inherits STATE
- City
- — inherits STATE
ZIP-level market 02906
- Rents YoY
- 7.5%
- Active inventory
- 145
- Price-to-rent
- 34.5×
Monthly cashflow live
- Estimated rent
- $15,626 medium interval (Pro) →
- Mortgage (P&I)
- −$6,791
- Tax from tax record
- −$488 /mo · $5,853/yr
- Insurance
- −$540
- HOA
- −$0
- Vacancy / Maint / Mgmt
- −$3,281
- Net cashflow
- $4,526
Break-even live
Sensitivity live
| Price | -10% $5,259 | -5% $4,893 | +0% $4,526 | +5% $4,160 | +10% $3,793 |
|---|---|---|---|---|---|
| Rent | -10% $3,292 | -5% $3,909 | +0% $4,526 | +5% $5,143 | +10% $5,761 |
| Rate | -1.0pp $5,178 | -0.5pp $4,855 | base $4,526 | +0.5pp $4,191 | +1.0pp $3,849 |
5-unit breakdown (identical units grouped — click to expand)
| Units | Beds | Baths | Est. rent |
|---|---|---|---|
| 5× units | 8 | 5 | $15,625 |
| #1 | 8 | 5 | $3,125 |
| #2 | 8 | 5 | $3,125 |
| #3 | 8 | 5 | $3,125 |
| #4 | 8 | 5 | $3,125 |
| #5 | 8 | 5 | $3,125 |
| Total (5 units) | $15,626 | ||
UW: 25.0% down · 7.5% · 30yr · 1.5% tax · 5.0% vac · 8.0% maint · 8.0% mgmt
Financing live
Cash to close
- Down payment
- $323,750
- Closing costs
- $38,850
- Reserves months
- —
- Total cash needed
- —
Loan-product check · same deal, 3 products live
Conventional
25% down · 7.5% · 30yr
- Down + closing
- —
- Monthly P&I
- —
- Monthly cashflow
- —
- DSCR
- —
- Eligible?
- —
Personal DTI + credit; lowest rate.
DSCR
20% down · 8.5% · 30yr
- Down + closing
- —
- Monthly P&I
- —
- Monthly cashflow
- —
- DSCR
- —
- Eligible?
- —
No personal income docs; deal must DSCR.
Hard money
10% down · 12.0% · 12mo
- Down + closing
- —
- Monthly P&I
- —
- Monthly cashflow
- —
- DSCR
- —
- Eligible?
- —
Short-term bridge; refi at stabilization.
Listing history 7 events
-
2026-05-05status Pending 827-char remark
Show marketing remark (827 chars)
Five Unit in Fox Point. Well-maintained and extensively updated 5-unit property in desirable Fox Point, offering a blend of strong rental income and future upside with extremely low vacancy. The property features low taxes for its size, parking for each unit and has 2 detached garages for ADU potential. Significant improvements have recently been completed, including a new roof, upgraded electrical service, central air in all units, exterior updates, a newly renovated shared laundry room and other in-unit upgrades. Located just off Ives and Wickenden and close to India Point Park, this property sits in the heart of the vibrant Fox Point neighborhood with some of Providence's best restaurants and bars. A rare opportunity to acquire a turnkey asset in one of the city's most sought-after rental markets. See MLS 1409912
-
2026-04-13$1,295,000 Active 827-char remark
Show marketing remark (827 chars)
Five Unit in Fox Point. Well-maintained and extensively updated 5-unit property in desirable Fox Point, offering a blend of strong rental income and future upside with extremely low vacancy. The property features low taxes for its size, parking for each unit and has 2 detached garages for ADU potential. Significant improvements have recently been completed, including a new roof, upgraded electrical service, central air in all units, exterior updates, a newly renovated shared laundry room and other in-unit upgrades. Located just off Ives and Wickenden and close to India Point Park, this property sits in the heart of the vibrant Fox Point neighborhood with some of Providence's best restaurants and bars. A rare opportunity to acquire a turnkey asset in one of the city's most sought-after rental markets. See MLS 1409912
-
2024-09-25historical $1,595
-
2024-09-17historical $1,595
-
2024-09-17$1,595
-
2024-09-13$1,495
-
2020-08-12soldstatus $660,000
ⓘ Source: listings_history table (triggers on properties + properties_extension) + one-shot
backfill from property_details.listing_events for pre-trigger history.
Tax reassessment forecast RI · Partial reset (capped growth)
- Current annual tax
- $5,853 · $488/mo
- Projected year-2 tax
- $13,481 · $1,123/mo
- Expected delta
- +$7,628/yr (+$636/mo · 130.3%)
ⓘ Screening estimate from a state-policy table — verify with the county assessor before closing.
Climate risk First Street
- Flood 1/10 Low FEMA zone X (unshaded) · 0% chance over 30 yrs
- Wildfire 1/10 Low
- Heat 6/10 Major 7 d/yr ≥97°F today · 15 d/yr by 30 yrs out
- Wind 6/10 Major 74% chance of damaging wind over 30 yrs
- Air quality 2/10 Low 1 unhealthy d/yr today · 2 by 30 yrs out
Nearby sold comps map
Loading sold comps map…
Walkable amenities ~0.75 mi
Loading nearby amenities…
Taxation est. · year 1
- Rental income
- $187,512
- − Mortgage interest
- −$72,540
- − Property taxes
- −$5,853
- − Insurance
- −$6,475
- − Repairs & maintenance
- −$15,001
- − Management
- −$15,001
- − Depreciation
- −$37,673
- Taxable income
- $34,969
- Est. tax owed @ 24.0%
- −$8,393
- After-tax cash flow
- $45,920/yr
For passive investors: Depreciation is non-cash, so a rental often shows a tax loss while cash-flowing — sheltering income. Rental losses are passive: they offset passive income freely, and up to $25,000/yr can offset ordinary (W-2) income if you actively participate and your MAGI is under $100k (phasing out to $0 by $150k); unused losses carry forward. On sale, claimed depreciation is recaptured at up to 25%, and gains may owe capital-gains tax (a 1031 exchange can defer both). Figures are a year-1 estimate at your 24.0% rate — not tax advice; consult a CPA.
Schools (NCES district)
- District
- Providence
- NCES district ID
- 4400900
- Math proficiency
- 8% ▼ -4.00%
- Reading proficiency
- 16% ▼ -2.00%
- Median HH income
- $38,197
- Composite
- 10.12/100
- National rank
- #9803
- State rank
- #34 of 39 in RI
Livability — Providence
- Score
- 84/100
- State rank
- #2
- US rank
- #794
Category grades
Schools grade is shown separately in the Schools card above.
Census & demographics
- Census place
- Providence, RI
- County
- Providence County · 548,917 people
- City population
- 212,734
- Metro
- Providence-Warwick, RI-MA
- Population (ZIP)
- 26,380
- Household income
- $103,050
- Rent vs Own
- Severe rent burden
- 1567.0
Population outlook (Providence County) Hauer SSP2
- Today (2025)
- 653,469 people
- By 2030
- 660,819 · +1.1%
- By 2040
- 672,747 · +3.0%
- By 2050
- 683,741 · +4.6%
- By 2075
- 720,435 · +10.2%
- By 2100
- 741,582 · +13.5%
Race, ethnicity, and origin ACS 2023
- Neighborhood character
- Predominantly White (72%)
- Race & ethnicity
- White 72% Asian 11% Hispanic / Latino 8% Two or more races 8% Black 3%
- Hispanic origin (detail)
- Mexican 2% Puerto Rican 1%
- Common ancestry
- Lithuanian 6% Romanian 5% Scotch-Irish 4%
- Foreign-born
- 17% · Canada, China, South Korea
- Languages at home
- 80% English-only · Other Indo-European 6% Spanish 5% Chinese 3%
Political lean MEDSL · Providence
- 2024 margin
- D (+14.4) · D 56.1% · R 41.7% · Other 2.2%
- 2008→2024 swing
- -20.0pp toward R · 2008: 34.4pp · 2024: 14.4pp
- All cycles
- 2024: D+14.4 2020: D+22.9 2016: D+21.2 2012: D+34.9 2008: D+34.4
Not yet ingested
- Civics
- —
Market trends
- HPI YoY
- ▼ -792.46%
- Current HPI
- 355.3795
- Rent YoY
- ▲ 7.46%
- Metro
- Providence-Warwick, RI-MA
- State GDP YoY
- ▲ 2.25%
- F500 in state
- 10
Industry mix (Fortune 500 HQ in RI)
| Industry | F500 HQs | Revenue |
|---|---|---|
| Healthcare | 1 | $373B |
|
||
| Food Distribution | 1 | $31B |
|
||
| Aerospace / Defense | 1 | $14B |
|
||
| Financial Services | 1 | $8B |
|
||
| Consumer Goods | 1 | $4B |
|
||
Price history
+96.2% since first listed7 events — show timeline
- 2026-05-05 Pending — RIS
- 2026-04-13 Listed $1,295,000 RIS
- 2024-09-25 Rental Removed $1,595 RENTALBEAST
- 2024-09-17 Rental Removed $1,595 RENTALBEAST
- 2024-09-17 Listed for Rent $1,595 RENTALBEAST
- 2024-09-13 Listed for Rent $1,495 RENTALBEAST
- 2020-08-12 Sold (Public Records) $660,000 Public Records
Property tax history
-3.8%/yrLatest (2025): $5,853 · -40.0% YoY. Source: county tax records.
Cash-flow waterfall
monthlySold comps — $/sqft
last 12 mo · ≤1 miLoading sold comps…