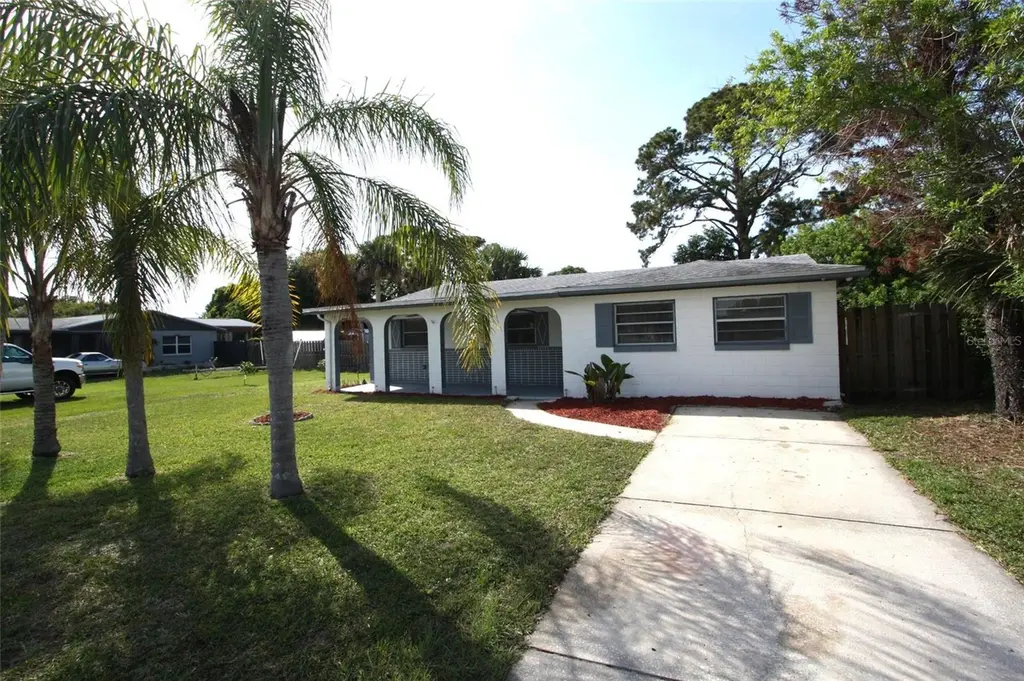
141 W Connecticut Ave · Edgewater, FL
Flood risk 6/10 · Moderate
- FEMA flood zone
- X (unshaded)
- Chance of flooding over 30 yrs
- 0.71%
- Est. flood insurance / yr
- $507 – $1,088
Fire risk 4/10 · Minor
- Est. fire insurance / yr
- $947 – $1,759
Heat risk 10/10 · Severe
- Hot days now (above 105°F)
- 7 days/yr
- Hot days in 30 yrs
- 22 days/yr
Wind risk 10/10 · Severe
- Chance of severe wind over 30 yrs
- 99.0%
Air-quality risk 2/10 · Minimal
- Unhealthy air days now
- 1 days/yr
- Unhealthy air days in 30 yrs
- 1 days/yr
Risk factors via First Street. Map © Google.
Why this score? — see what drove the D grade
The composite is a weighted blend of 9 inputs, each scored 0–100. Each bar is that input's sub-score; the figure is the points it added to the 100-point composite (weight × sub-score).
- Cash flow +13.1/30.0
- ARV discount +7.5/15.0
- DSCR +3.9/10.0
- Schools +3.9/10.0
- 1% rule +3.8/10.0
- Livability +3.6/5.0
- Rent growth +2.5/5.0
- Condition / age +2.5/5.0
- Appreciation +0.0/10.0
$324,900
🖨 Deal sheet 📄 Offer letter ✓ Due diligence
Listing remarks
Welcome to this cement block, well-maintained 3-bedroom, 2-bath home in the heart of Edgewater! Step inside to discover versatile living spaces, including a spacious 33' x 14' flex room with its own bathroom and meal prep area—separated by French doors—offering endless possibilities. This flexible space is perfect for extended family, guests, or even as a private office. The open kitchen is designed for both convenience and style, featuring a breakfast bar, and a dedicated dining area. Beautiful laminate flooring flows throughout the home, adding a touch of warmth and easy maintenance. Enjoy outdoor living on the expansive covered front porch (26' x 8'), or head to the over-size
Key facts
- Covered front porch
- Shed workshop
- Meal prep area
Tags
Property features AI
Finance
- Other: Property type: Residential, single family; Lot size about 0.36 acres (0.25–0.5 acre range); Zoning: 07R3
- HOA & community: Located in the Edgewater Acres development
Exterior
- Parking: Driveway
- Utilities: Electricity connected; Public sewer; Water connected
- Home design: Single family residence; One story; North-facing
- Construction: Concrete construction; Shingle roof; Slab foundation; Built area approximately 1,953 living / 2,236 total (public records)
- Exterior features: Sliding doors; Storage; Wood fencing; Asphalt road access
Interior
- Kitchen: Dishwasher; Microwave; Range; Refrigerator
- Bedrooms: 3 bedrooms
- Flooring: Laminate
- Bathrooms: 2 full bathrooms
- Heating & cooling: Central heating; Central air conditioning
- Interior features: Ceiling fans
- Laundry & utility: Indoor laundry
Neighborhood map
What this means for you Summary
Snapshot
- This is a 3-bed/2.0-bath single-family listed at $325k.
Deal economics
- At list price, monthly cash flow is $-14 ($-165/yr) — negative.
- To cash-flow at today's rent, offer at most $322k (0.7% below list).
- To meet the 1% rule (rent ≥ 1% of price), the offer needs to be $285k (12.4% below list).
- Recommended offer: $285k (12.4% below list) — sets the bar for 1% rule.
Location & tenants
- Location reads 72/100 on livability (#329 in FL) — a middle-class / working-renter tenant base. Strengths: cost of living A+, housing A+, health & safety A+; Watch: amenities D-, commute F.
- Volusia (suburban): math 44% / reading 49% proficiency, ranked #47 of 73 in FL (top 64%) — families likely to look elsewhere, expect single-tenant / working-renter base with shorter leases.
- Market conditions: 95 active listings in the ZIP; 4 comparable units currently listed for rent nearby; rentals at typical pace (median 19d on market — plan ~3-4 weeks tenant-placement turnaround); 3,402 units permitted in Volusia County in 2024 (681 in 5+ unit buildings).
Forward outlook
- Local home prices are declining (-3.0%/yr); year-one equity from $2k of loan paydown is wiped out by about $10k of value loss. Plan a longer hold.
- Volusia County population projected at +19% by 2050 — long-run rental-demand tailwind backs the buy-and-hold thesis.
Negotiation context
- It's been on market 42 days — a 3% lower offer ($315k) is reasonable based on typical stale-listing flexibility.
- Current owner paid $124k; list at $325k implies a 162% gain — meaningful room to come down on a strong offer.
Risks & watch-outs
- Climate carrying-cost: major flood risk; severe wind risk, 99% chance of damaging wind over 30y; extreme-heat days projected 7→22/yr by 2055 (HVAC capex compounding) — expect insurance premiums to compound above CPI over the hold.
Questions for the listing agent
- What do current leases actually rent for vs. the listed asking? Can we see a recent rent roll and the last 12 months of T-12 income?
- It's been on market 42 days. Have you received any prior offers? Is the seller open to a 12% concession, seller financing, or rate buy-down credit?
- Built in 1971 — when were the roof, HVAC, electrical panel, plumbing, and water heater last replaced?
- Is there a deadline driving the sale (1031 exchange, divorce, estate, relocation)? That informs how much negotiation room exists.
- The area grade is low — what's the realistic commute time and amenity access for the typical tenant pool here? Any planned neighborhood developments (good or bad) we should know about?
- What's the average days-on-market for RENTAL listings here right now (not sales)? A rising rental-DOM trend means longer vacancies and softer asking-rent achievability than the comps imply.
- What's the recent tenant-quality profile in this submarket — average credit score on applications, eviction rate, late-payment / NSF rate, and stable-employment percentage? A property-management company in the area should have these aggregated.
- How much new for-sale + rental construction is in the pipeline within 1–3 miles? Heavy new supply typically softens prices + rents 12–24 months out; constrained supply supports both.
Investment metrics
- 1% rule
- 0.88% ✗
- Cap rate
- 6.24%
- Cash-on-cash
- -0.18%
- DSCR
- 0.99
- GRM
- 9.5
CMA / ARV
No comps found within radius.
Projected returns pro-forma
-3.0% appreciation · 3.0% rent growth · sell at horizon
- IRR
- -16.6%
- Equity multiple
- 0.41×
- Total profit
- $-53,471
- Equity at exit
- $48,444
- IRR
- -8.3%
- Equity multiple
- 0.48×
- Total profit
- $-47,473
- Equity at exit
- $28,091
Cash invested: $90,972 (down + closing). Projections, not guarantees.
Landlord ↔ Tenant lean methodology
- Overall (STATE)
- 87 Strongly Landlord-Friendly
- State Florida
- 87 Strongly Landlord-Friendly · R+3
- County
- — inherits STATE
- City
- — inherits STATE
ZIP-level market 32132
- Home prices YoY
- -20.1%
- Active inventory
- 95
- Price-to-rent
- 9.5×
Monthly cashflow live
- Estimated rent
- $2,846 medium interval (Pro) →
- Mortgage (P&I)
- −$1,704
- Tax from tax record
- −$423 /mo · $5,075/yr
- Insurance
- −$135
- HOA
- −$0
- Vacancy / Maint / Mgmt
- −$598
- Net cashflow
- $-14
Break-even live
UW: 25.0% down · 7.5% · 30yr · 1.5% tax · 5.0% vac · 8.0% maint · 8.0% mgmt
Financing live
Cash to close
- Down payment
- $81,225
- Closing costs
- $9,747
- Reserves months
- —
- Total cash needed
- —
Loan-product check · same deal, 3 products live
Conventional
25% down · 7.5% · 30yr
- Down + closing
- —
- Monthly P&I
- —
- Monthly cashflow
- —
- DSCR
- —
- Eligible?
- —
Personal DTI + credit; lowest rate.
DSCR
20% down · 8.5% · 30yr
- Down + closing
- —
- Monthly P&I
- —
- Monthly cashflow
- —
- DSCR
- —
- Eligible?
- —
No personal income docs; deal must DSCR.
Hard money
10% down · 12.0% · 12mo
- Down + closing
- —
- Monthly P&I
- —
- Monthly cashflow
- —
- DSCR
- —
- Eligible?
- —
Short-term bridge; refi at stabilization.
Rent comps 4 comps
| Address | Beds | Baths | Sqft | Rent | $/sqft | DOM | Units | Dist |
|---|---|---|---|---|---|---|---|---|
| 308 Wildwood Dr Edgewater, FL | 3.0 | 2.0 | 1485 | $2,195 | $1.48 | 18d | 1 | 0.84mi |
| 1405 S Riverside Dr Edgewater, FL | 3.0 | 2.5 | 2100 | $4,500 | $2.14 | 23d | 1 | 0.85mi |
| 120 Hardin Pl Edgewater, FL | 3.0 | 2.0 | 1455 | $2,075 | $1.43 | 14d | 1 | 1.04mi |
| 1822 Royal Palm Dr Edgewater, FL | 3.0 | 2.0 | 1400 | $1,620 | $1.16 | 14d | 1 | 1.31mi |
Listing history 19 events
-
2026-06-18days on market $324,900 Active 42 DOM
-
2026-06-17days on market $324,900 Active 41 DOM
-
2026-06-16days on market $324,900 Active 40 DOM
-
2026-06-15days on market $324,900 Active 39 DOM
-
2026-06-14pricedays on market $324,900 Active 37 DOM
-
2026-06-10days on market $332,900 Active 34 DOM
-
2026-06-09days on market $332,900 Active 33 DOM
-
2026-06-08days on market $332,900 Active 32 DOM
-
2026-06-07days on market $332,900 Active 31 DOM
-
2026-06-05days on market $332,900 Active 28 DOM
-
2026-06-03days on market $332,900 Active 27 DOM
-
2026-06-03pricedays on market $332,900 Active 26 DOM
-
2026-06-01days on market $344,900 Active 25 DOM
-
2026-05-31days on market $344,900 Active 24 DOM
-
2026-05-31days on market $344,900 Active 23 DOM
-
2026-05-07$344,900 Active 1287-char remark
-
2021-07-07soldstatus $123,992
-
2004-06-29soldstatus $120,000
-
1983-02-01soldstatus $36,000
ⓘ Source: listings_history table (triggers on properties + properties_extension) + one-shot
backfill from property_details.listing_events for pre-trigger history.
Tax reassessment forecast FL · Resets to sale price
- Current annual tax
- $5,075 · $423/mo
- Projected year-2 tax
- $5,075 · $423/mo
- Expected delta
- $0/yr ($0/mo · 0.0%)
ⓘ Screening estimate from a state-policy table — verify with the county assessor before closing.
Climate risk First Street
- Flood 6/10 Major FEMA zone X (unshaded) · 71% chance over 30 yrs
- Wildfire 4/10 Moderate
- Heat 10/10 Extreme 7 d/yr ≥105°F today · 22 d/yr by 30 yrs out
- Wind 10/10 Extreme 99% chance of damaging wind over 30 yrs
- Air quality 2/10 Low 1 unhealthy d/yr today · 1 by 30 yrs out
Nearby sold comps map
Loading sold comps map…
Walkable amenities ~0.75 mi
Loading nearby amenities…
Taxation est. · year 1
- Rental income
- $34,152
- − Mortgage interest
- −$18,199
- − Property taxes
- −$5,075
- − Insurance
- −$1,624
- − Repairs & maintenance
- −$2,732
- − Management
- −$2,732
- − Depreciation
- −$9,452
- Taxable loss
- −$5,663
- Est. tax savings @ 24.0%
- +$1,359
- After-tax cash flow
- $1,194/yr
For passive investors: Depreciation is non-cash, so a rental often shows a tax loss while cash-flowing — sheltering income. Rental losses are passive: they offset passive income freely, and up to $25,000/yr can offset ordinary (W-2) income if you actively participate and your MAGI is under $100k (phasing out to $0 by $150k); unused losses carry forward. On sale, claimed depreciation is recaptured at up to 25%, and gains may owe capital-gains tax (a 1031 exchange can defer both). Figures are a year-1 estimate at your 24.0% rate — not tax advice; consult a CPA.
Schools (NCES district)
- District
- Volusia
- NCES district ID
- 1201920
- Math proficiency
- 44% ▼ -9.00%
- Reading proficiency
- 49% ▼ -3.00%
- Median HH income
- $42,946
- Composite
- 39.2/100
- National rank
- #4019
- State rank
- #47 of 73 in FL
Livability — Edgewater
- Score
- 72/100
- State rank
- #329
- US rank
- #5753
Category grades
Schools grade is shown separately in the Schools card above.
Census & demographics
- Census place
- Edgewater, FL
- City population
- 18,726
- Population (ZIP)
- 8,132
Population outlook (Volusia County) Hauer SSP2
- Today (2025)
- 572,749 people
- By 2030
- 598,695 · +4.5%
- By 2040
- 644,880 · +12.6%
- By 2050
- 681,451 · +19.0%
- By 2075
- 759,957 · +32.7%
- By 2100
- 778,902 · +36.0%
Race, ethnicity, and origin ACS 2023
- Neighborhood character
- Predominantly White (90%)
- Race & ethnicity
- White 90% Two or more races 6% Hispanic / Latino 5% Black 1%
- Hispanic origin (detail)
- Puerto Rican 1% Cuban 2%
- Common ancestry
- Lithuanian 4% Romanian 3% Estonian 2%
- Foreign-born
- 7% · Canada
- Languages at home
- 95% English-only · Other Indo-European 3% Spanish 2%
Political lean MEDSL · Volusia
- 2024 margin
- Strong R (+21.8) · D 38.7% · R 60.5%
- 2008→2024 swing
- -27.4pp toward R · 2008: 5.7pp · 2024: -21.8pp
- All cycles
- 2024: R+21.8 2020: R+14.1 2016: R+13.1 2012: R+1.2 2008: D+5.7
Not yet ingested
- Civics
- —
Market trends
- HPI YoY
- ▼ -92.25%
- Current HPI
- 366.8512
- Rent YoY
- —
- Metro
- —
- State GDP YoY
- ▲ 3.28%
- F500 in state
- 36
Industry mix (Fortune 500 HQ in FL)
| Industry | F500 HQs | Revenue |
|---|---|---|
| Industrial Technology | 2 | $29B |
|
||
| Insurance | 2 | $17B |
|
||
| Retail | 1 | $60B |
|
||
| Technology Distribution | 1 | $58B |
|
||
| Homebuilding | 1 | $35B |
|
||
| Technology Manufacturing | 1 | $35B |
|
||
Price history
+802.5% since first listed6 events — show timeline
- 2026-06-12 Price Changed $324,900 Stellar MLS as Distributed by MLS Grid
- 2026-06-01 Price Changed $332,900 Stellar MLS as Distributed by MLS Grid
- 2026-05-07 Listed $344,900 Stellar MLS as Distributed by MLS Grid
- 2021-07-07 Sold (Public Records) $123,992 Public Records
- 2004-06-29 Sold (Public Records) $120,000 Public Records
- 1983-02-01 Sold (Public Records) $36,000 Public Records
Property tax history
+22.6%/yrLatest (2025): $5,075 · -3.4% YoY. Source: county tax records.
Cash-flow waterfall
monthlySold comps — $/sqft
last 12 mo · ≤1 miLoading sold comps…