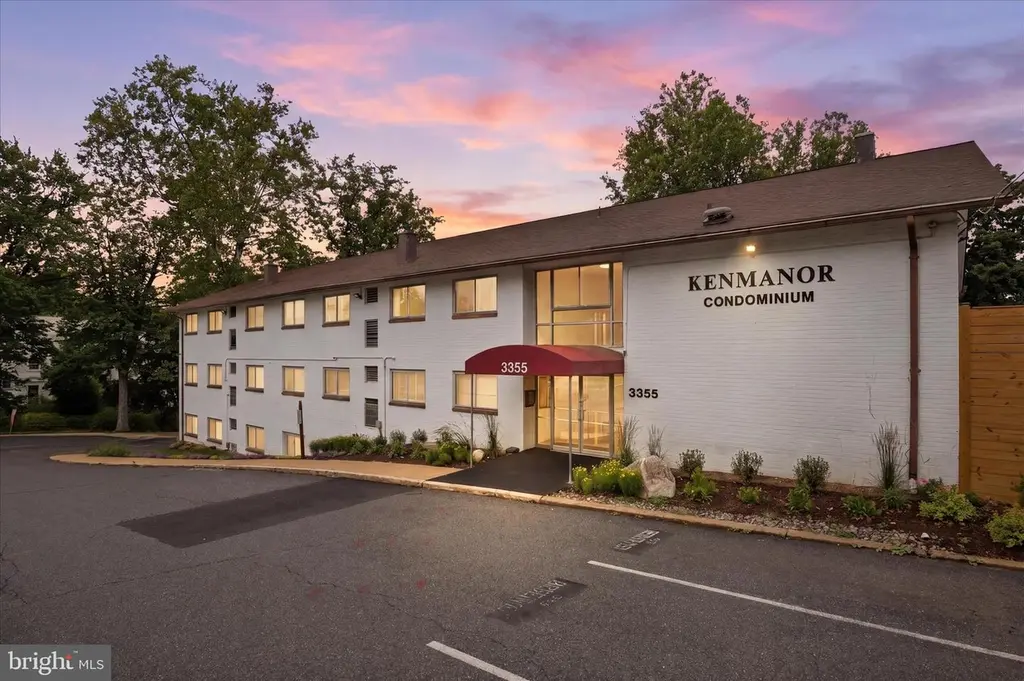
3355 University Blvd W #106 · North Kensington, MD
Flood risk 8/10 · Major
- FEMA flood zone
- X (unshaded)
- Chance of flooding over 30 yrs
- 0.99%
- Est. flood insurance / yr
- $507 – $1,088
Fire risk 1/10 · Minimal
- Est. fire insurance / yr
- $755 – $1,403
Heat risk 6/10 · Moderate
- Hot days now (above 103°F)
- 7 days/yr
- Hot days in 30 yrs
- 15 days/yr
Wind risk 4/10 · Minor
- Chance of severe wind over 30 yrs
- 16.0%
Air-quality risk 3/10 · Minor
- Unhealthy air days now
- 3 days/yr
- Unhealthy air days in 30 yrs
- 4 days/yr
Risk factors via First Street. Map © Google.
Why this score? — see what drove the D grade
The composite is a weighted blend of 9 inputs, each scored 0–100. Each bar is that input's sub-score; the figure is the points it added to the 100-point composite (weight × sub-score).
- Cash flow +11.2/30.0
- 1% rule +8.5/10.0
- ARV discount +7.5/15.0
- Livability +4.4/5.0
- Schools +3.6/10.0
- DSCR +3.3/10.0
- Rent growth +2.5/5.0
- Condition / age +2.5/5.0
- Appreciation +0.0/10.0
$164,000
🖨 Deal sheet 📄 Offer letter ✓ Due diligence
Listing remarks MLS
Newly remodeled kitchen and bath. Granite countertops, new appliances & cabinets. Jetted tub in BA. Hardwood floors, new windows. Bright open-concept floorplan w/ lrg living room, kitchen, dining room. Steps to downtown Kensington, MARC Train, Wheaton Metro, shops & restaurants, Kensington Heights Park.
Key facts
- Wonderful pergola
- Extra storage
- Granite counters
Tags
Property features AI
Finance
- Other: Property manager present; Commuter access: Metro/Subway and commuter rail station less than 1 mile; Directions reference: University; Finished area above grade listed as 863 (source: assessor)
- HOA & community: Condo fee $783 monthly; Condo fee covers common area maintenance, exterior building maintenance, lawn maintenance, management, sewer, snow removal, trash, and water; Building offers laundry facilities
Exterior
- Parking: Parking lot with 1 space (total 1 garage/parking space)
- Utilities: Public water; Public sewer
- Home design: Garden-style building (1–4 floors); Unit/flat
- Construction: Brick construction
- Exterior features: Condominium ownership; Pets allowed (dogs and cats); Common grounds; Picnic area; Extra storage; Above-grade and below-grade structures noted; Located outside city limits; Entry on floor 1
Interior
- Bedrooms: 2 bedrooms on the main level
- Bathrooms: 1 full bathroom on the main level
- Heating & cooling: Forced air heating (natural gas); Central air conditioning (electric); Natural gas hot water
- Interior features: No basement; Finished living area measured by assessor
- Laundry & utility: No washer/dryer hook-up in unit
Neighborhood map
What this means for you Summary
Snapshot
- This is a 2-bed/1.0-bath condo listed at $164k.
Deal economics
- At list price, monthly cash flow is $-128 ($-2k/yr) — negative.
- To cash-flow at today's rent, offer at most $141k (13.8% below list).
- Meets the 1% rule at list price ($2k rent vs $164k).
- Recommended offer: $141k (13.8% below list) — sets the bar for cash-flow.
- Cap rate 5.8% vs local median 3.0% in North Kensington — top-decile yield for the area; either an underpriced asset or a hidden risk that comps aren't pricing in. Stress-test before assuming the spread holds.
Location & tenants
- Location reads 88/100 on livability (#4 in MD, #193 nationally) — a professional / high-income tenant draw. Strengths: schools A+, amenities A+, commute A+; Watch: cost of living F.
- Montgomery County Public Schools (suburban): math 27% / reading 45% proficiency, ranked #3 of 24 in MD (top 12%) — families likely to look elsewhere, expect single-tenant / working-renter base with shorter leases.
- Market conditions: 81 active listings in the ZIP; 19 comparable units currently listed for rent nearby; rentals at typical pace (median 19d on market — plan ~3-4 weeks tenant-placement turnaround); 3,880 units permitted in Montgomery County in 2024 (2,054 in 5+ unit buildings).
Forward outlook
- Local home prices are declining (-3.0%/yr); year-one equity from $1k of loan paydown is wiped out by about $5k of value loss. Plan a longer hold.
- Montgomery County population projected at +27% by 2050 — long-run rental-demand tailwind backs the buy-and-hold thesis.
Negotiation context
- It's been on market 22 days — a 2% lower offer ($162k) is reasonable based on typical stale-listing flexibility.
- 9 sale attempts since 27y ago with the ask held roughly flat each time — persistent listings suggest the price (not the market) is what's stuck; bring a comps-based counter.
Risks & watch-outs
- Watch-outs: flood insurance adds $66/mo; HOA is 35% of rent.
- Climate carrying-cost: severe flood risk; extreme-heat days projected 7→15/yr by 2055 (HVAC capex compounding) — expect insurance premiums to compound above CPI over the hold.
Questions for the listing agent
- What do current leases actually rent for vs. the listed asking? Can we see a recent rent roll and the last 12 months of T-12 income?
- Built in 1964 — when were the roof, HVAC, electrical panel, plumbing, and water heater last replaced?
- What's the actual annual flood-insurance premium (NFIP or private), and is the property in a SFHA with mandatory coverage?
- What does the HOA fee cover, when was the last increase, and are there any pending special assessments or reserve-fund shortfalls?
- Any open or pending special assessments — roof, HVAC, plumbing, elevator, façade? What's the per-unit balance and payoff schedule, and is the seller paying it off at close or rolling it to the buyer?
- Is there a deadline driving the sale (1031 exchange, divorce, estate, relocation)? That informs how much negotiation room exists.
- Schools are A-rated — typically a magnet for longer-tenancy family renters. What's the average tenant stay here, and is there a school-zone premium baked into asking?
- The area grade is low — what's the realistic commute time and amenity access for the typical tenant pool here? Any planned neighborhood developments (good or bad) we should know about?
- What's the average days-on-market for RENTAL listings here right now (not sales)? A rising rental-DOM trend means longer vacancies and softer asking-rent achievability than the comps imply.
- What's the recent tenant-quality profile in this submarket — average credit score on applications, eviction rate, late-payment / NSF rate, and stable-employment percentage? A property-management company in the area should have these aggregated.
- How much new apartment / multifamily construction is in the pipeline within 1–3 miles? Heavy new supply (>2% of stock underway) typically softens rents 12–24 months out; light construction supports rent growth.
Investment metrics
- 1% rule
- 1.35% ✓
- Cap rate
- 5.84%
- Cash-on-cash
- -1.62%
- DSCR
- 0.93
- GRM
- 6.2
CMA / ARV
No comps found within radius.
Projected returns pro-forma
-3.0% appreciation · 3.0% rent growth · sell at horizon
- IRR
- -21.5%
- Equity multiple
- 0.25×
- Total profit
- $-34,258
- Equity at exit
- $24,453
- IRR
- -14.3%
- Equity multiple
- 0.16×
- Total profit
- $-38,366
- Equity at exit
- $14,180
Cash invested: $45,920 (down + closing). Projections, not guarantees.
Landlord ↔ Tenant lean methodology
- Overall (STATE)
- 27 Tenant-Leaning
- State Maryland
- 27 Tenant-Leaning · D+14
- County
- — inherits STATE
- City
- — inherits STATE
ZIP-level market 20895
- Active inventory
- 81
- Price-to-rent
- 6.2×
Monthly cashflow live
- Estimated rent
- $2,211 high interval (Pro) →
- Mortgage (P&I)
- −$860
- Tax from tax record
- −$97 /mo · $1,168/yr
- Insurance
- −$68
- Flood insurance flood zone
- −$66 /mo · $798/yr
- HOA
- −$783
- Vacancy / Maint / Mgmt
- −$464
- Net cashflow
- $-128
Break-even live
UW: 25.0% down · 7.5% · 30yr · 1.5% tax · 5.0% vac · 8.0% maint · 8.0% mgmt
Financing live
Cash to close
- Down payment
- $41,000
- Closing costs
- $4,920
- Reserves months
- —
- Total cash needed
- —
Loan-product check · same deal, 3 products live
Conventional
25% down · 7.5% · 30yr
- Down + closing
- —
- Monthly P&I
- —
- Monthly cashflow
- —
- DSCR
- —
- Eligible?
- —
Personal DTI + credit; lowest rate.
DSCR
20% down · 8.5% · 30yr
- Down + closing
- —
- Monthly P&I
- —
- Monthly cashflow
- —
- DSCR
- —
- Eligible?
- —
No personal income docs; deal must DSCR.
Hard money
10% down · 12.0% · 12mo
- Down + closing
- —
- Monthly P&I
- —
- Monthly cashflow
- —
- DSCR
- —
- Eligible?
- —
Short-term bridge; refi at stabilization.
Rent comps 19 comps
| Address | Beds | Baths | Sqft | Rent | $/sqft | DOM | Units | Dist |
|---|---|---|---|---|---|---|---|---|
| 3355 University Blvd W #100 Kensington, MD | 2.0 | 1.0 | 865 | $2,049 | $2.37 | 24d | 1 | 0.02mi |
| 3419 University Blvd W Apt 103 Kensington, MD | 2.0 | 1.0 | 728 | $2,300 | $3.16 | 18d | 1 | 0.12mi |
| 3015 Upton Dr Unit 223 Kensington, MD | 1.0 | 1.0 | 570 | $1,500 | $2.63 | 43d | 1 | 0.46mi |
| 3015 Upton Dr Unit 240 Kensington, MD | 2.0 | 1.0 | 884 | $2,400 | $2.71 | 43d | 1 | 0.46mi |
| 4009 Halsey St Kensington, MD | 3.0 | 1.5 | 1100 | $2,800 | $2.55 | 43d | 1 | 0.65mi |
| 10225 Frederick Ave Kensington, MD | 1.0–3.0 | 1.0–2.0 | 847 | $1,900 | $2.24 | 5d | 1 | 0.78mi |
| 3104 Parker Ave Silver Spring, MD | 3.0 | 1.0 | 978 | $2,700 | $2.76 | 43d | 1 | 0.80mi |
| 11215 Georgia Ave Wheaton, MD | 2.0 | 1.0–2.0 | 899 | $2,585 | $2.87 | 1d | 21 | 0.97mi |
| 11141 Georgia Ave Silver Spring, MD | 1.0 | 1.0 | 588 | $2,111 | $3.59 | 1d | 11 | 0.98mi |
| 11175 Georgia Ave Silver Spring, MD | 2.0 | 1.0–2.0 | 825 | $2,467 | $2.99 | 2d | 4 | 1.00mi |
| 11101 Georgia Ave Silver Spring, MD | 1.0–2.0 | 1.0–2.5 | 1086 | $2,492 | $2.29 | 1d | 22 | 1.00mi |
| 10820 Georgia Ave Silver Spring, MD | 1.0–2.0 | 1.0 | 900 | $1,815 | $2.02 | 7d | 7 | 1.02mi |
| 2425 Blueridge Ave Silver Spring, MD | 3.0 | 1.0–3.0 | 952 | $2,513 | $2.64 | 2d | 1 | 1.06mi |
| 10898 Bucknell Dr Silver Spring, MD | 1.0–3.0 | 1.0–2.0 | 1052 | $2,656 | $2.52 | 1d | 5 | 1.15mi |
| 11312 King George Dr #4 Silver Spring, MD | 2.0 | 1.0 | 860 | $2,499 | $2.91 | 5d | 1 | 1.19mi |
| 11508 Bucknell Dr #87 Silver Spring, MD | 2.0 | 1.0 | 930 | $2,200 | $2.37 | 44d | 1 | 1.30mi |
| 10670 Weymouth St Apt 202 Bethesda, MD | 1.0 | 1.0 | 780 | $1,750 | $2.24 | 43d | 1 | 1.35mi |
| 10600 Montrose Ave Apt 201 Bethesda, MD | 1.0 | 1.0 | 786 | $1,800 | $2.29 | 24d | 1 | 1.44mi |
| 10654 Montrose Ave #104 Bethesda, MD | 2.0 | 1.0 | 1000 | $2,380 | $2.38 | 43d | 1 | 1.46mi |
HOA detail condo
- Monthly dues
- $783 · $9,396/yr
- Assessments
- None detected in remarks — confirm with the listing agent.
Listing history 46 events
-
2026-06-18days on market $164,000 Active 22 DOM
-
2026-06-17days on market $164,000 Active 21 DOM
-
2026-06-16days on market $164,000 Active 20 DOM
-
2026-06-15days on market $164,000 Active 19 DOM
-
2026-06-13pricedays on market $164,000 Active 17 DOM
-
2026-06-09days on market $169,000 Active 13 DOM
-
2026-06-08days on market $169,000 Active 12 DOM
-
2026-06-07days on market $169,000 Active 11 DOM
-
2026-06-04days on market $169,000 Active 8 DOM
-
2026-06-03days on market $169,000 Active 7 DOM
-
2026-06-02days on market $169,000 Active 6 DOM
-
2026-06-01days on market $169,000 Active 5 DOM
-
2026-05-31days on market $169,000 Active 4 DOM
-
2026-05-27$169,000 Active
-
2016-10-12soldstatus $162,000
-
2016-09-23soldstatus $162,000 316-char remark
Show marketing remark (316 chars)
Newly remodeled kitchen and bath. Granite countertops, new appliances & cabinets. Jetted tub in BA. Hardwood floors, new windows. Bright open-concept floorplan w/ lrg living room, kitchen, dining room. Steps to downtown Kensington, MARC Train, Wheaton Metro, shops & restaurants, Kensington Heights Park.
-
2016-09-23soldstatus $162,000 Sold 316-char remark
Show marketing remark (316 chars)
Newly remodeled kitchen and bath. Granite countertops, new appliances & cabinets. Jetted tub in BA. Hardwood floors, new windows. Bright open-concept floorplan w/ lrg living room, kitchen, dining room. Steps to downtown Kensington, MARC Train, Wheaton Metro, shops & restaurants, Kensington Heights Park.
-
2016-08-29status Contingent (No Kick Out) 316-char remark
Show marketing remark (316 chars)
Newly remodeled kitchen and bath. Granite countertops, new appliances & cabinets. Jetted tub in BA. Hardwood floors, new windows. Bright open-concept floorplan w/ lrg living room, kitchen, dining room. Steps to downtown Kensington, MARC Train, Wheaton Metro, shops & restaurants, Kensington Heights Park.
-
2016-06-24price $178,000 316-char remark
Show marketing remark (316 chars)
Newly remodeled kitchen and bath. Granite countertops, new appliances & cabinets. Jetted tub in BA. Hardwood floors, new windows. Bright open-concept floorplan w/ lrg living room, kitchen, dining room. Steps to downtown Kensington, MARC Train, Wheaton Metro, shops & restaurants, Kensington Heights Park.
-
2016-05-10$189,000 Active 316-char remark
Show marketing remark (316 chars)
Newly remodeled kitchen and bath. Granite countertops, new appliances & cabinets. Jetted tub in BA. Hardwood floors, new windows. Bright open-concept floorplan w/ lrg living room, kitchen, dining room. Steps to downtown Kensington, MARC Train, Wheaton Metro, shops & restaurants, Kensington Heights Park.
-
2016-05-10historical
Show marketing remark (316 chars)
Newly remodeled kitchen and bath. Granite countertops, new appliances & cabinets. Jetted tub in BA. Hardwood floors, new windows. Bright open-concept floorplan w/ lrg living room, kitchen, dining room. Steps to downtown Kensington, MARC Train, Wheaton Metro, shops & restaurants, Kensington Heights Park.
-
2016-04-21Active
-
2016-04-21$189,900
-
2013-09-25soldstatus $125,000
-
2013-08-13soldstatus $125,000
-
2013-08-02historical
-
2013-07-31soldstatus $125,000 Sold
-
2013-07-31soldstatus $125,000
-
2013-02-24historical
-
2013-02-16status Contract
-
2013-02-05price $124,700
-
2012-11-13price $140,200
-
2012-10-09$152,000 Active
-
2012-10-09$124,700
-
2005-10-04soldstatus $240,000
-
2005-08-19soldstatus $240,000
-
2005-07-17historical
-
2005-06-17$235,000
-
1999-09-16soldstatus $61,500
-
1999-08-30soldstatus $61,500
-
1999-08-11historical
-
1999-08-04historical
-
1999-08-02$62,500
-
1999-04-29
-
1987-01-29soldstatus $52,000
ⓘ Source: listings_history table (triggers on properties + properties_extension) + one-shot
backfill from property_details.listing_events for pre-trigger history.
Tax reassessment forecast MD · Partial reset (capped growth)
- Current annual tax
- $1,168 · $97/mo
- Projected year-2 tax
- $1,478 · $123/mo
- Expected delta
- +$310/yr (+$26/mo · 26.5%)
ⓘ Screening estimate from a state-policy table — verify with the county assessor before closing.
Climate risk First Street
- Flood 8/10 Severe FEMA zone X (unshaded) · 99% chance over 30 yrs
- Wildfire 1/10 Low
- Heat 6/10 Major 7 d/yr ≥103°F today · 15 d/yr by 30 yrs out
- Wind 4/10 Moderate 16% chance of damaging wind over 30 yrs
- Air quality 3/10 Moderate 3 unhealthy d/yr today · 4 by 30 yrs out
Nearby sold comps map
Loading sold comps map…
Walkable amenities ~0.75 mi
Loading nearby amenities…
Taxation est. · year 1
- Rental income
- $26,535
- − Mortgage interest
- −$9,187
- − Property taxes
- −$1,168
- − Insurance
- −$1,618
- − Repairs & maintenance
- −$2,123
- − Management
- −$2,123
- − HOA
- −$9,396
- − Depreciation
- −$4,771
- Taxable loss
- −$3,850
- Est. tax savings @ 24.0%
- +$924
- After-tax cash flow
- $-616/yr
For passive investors: Depreciation is non-cash, so a rental often shows a tax loss while cash-flowing — sheltering income. Rental losses are passive: they offset passive income freely, and up to $25,000/yr can offset ordinary (W-2) income if you actively participate and your MAGI is under $100k (phasing out to $0 by $150k); unused losses carry forward. On sale, claimed depreciation is recaptured at up to 25%, and gains may owe capital-gains tax (a 1031 exchange can defer both). Figures are a year-1 estimate at your 24.0% rate — not tax advice; consult a CPA.
Schools (NCES district)
- District
- Montgomery County Public Schools
- NCES district ID
- 2400480
- Math proficiency
- 27% ▼ -21.00%
- Reading proficiency
- 45% ▼ -10.00%
- Median HH income
- $97,191
- Composite
- 35.62/100
- National rank
- #4889
- State rank
- #3 of 24 in MD
Livability — North Kensington
- Score
- 88/100
- State rank
- #4
- US rank
- #193
Category grades
Schools grade is shown separately in the Schools card above.
Census & demographics
- Census place
- North Kensington, MD
- Population (ZIP)
- 19,042
Population outlook (Montgomery County) Hauer SSP2
- Today (2025)
- 1,173,231 people
- By 2030
- 1,237,402 · +5.5%
- By 2040
- 1,365,115 · +16.4%
- By 2050
- 1,491,592 · +27.1%
- By 2075
- 1,803,893 · +53.8%
- By 2100
- 2,035,619 · +73.5%
Race, ethnicity, and origin ACS 2023
- Neighborhood character
- Predominantly White (67%)
- Race & ethnicity
- White 67% Hispanic / Latino 15% Two or more races 14% Black 5% Asian 5%
- Hispanic origin (detail)
- Mexican 2% Puerto Rican 1%
- Common ancestry
- Italian 3% Lithuanian 3% Slovak 2%
- Foreign-born
- 17% · Canada, South Korea, China
- Languages at home
- 77% English-only · Spanish 13% Other Indo-European 3% French/Haitian/Cajun 2%
Political lean MEDSL · Montgomery
- 2024 margin
- Solid D (+53.3) · D 75.2% · R 21.9% · Other 2.9%
- 2008→2024 swing
- +8.7pp toward D · 2008: 44.6pp · 2024: 53.3pp
- All cycles
- 2024: D+53.3 2020: D+59.6 2016: D+55.5 2012: D+43.4 2008: D+44.6
Not yet ingested
- Civics
- —
Market trends
- HPI YoY
- ▼ -673.67%
- Current HPI
- 281.3567
- Rent YoY
- —
- Metro
- —
- State GDP YoY
- ▲ 2.97%
- F500 in state
- 12
Industry mix (Fortune 500 HQ in MD)
| Industry | F500 HQs | Revenue |
|---|---|---|
| Aerospace / Defense | 1 | $71B |
|
||
| Utilities | 1 | $25B |
|
||
| Hotels | 1 | $24B |
|
||
| Consumer Goods | 1 | $7B |
|
||
| Real Estate | 1 | $6B |
|
||
| Chemicals | 1 | $2B |
|
||
Price history
+225.0% since first listed33 events — show timeline
- 2026-05-27 Listed $169,000 BRIGHT MLS
- 2016-10-12 Sold (Public Records) $162,000 Public Records
- 2016-09-23 Sold (MLS) $162,000 MRIS
- 2016-09-23 Sold (MLS) $162,000 BRIGHT MLS
- 2016-08-29 Pending — MRIS
- 2016-06-24 Price Changed $178,000 MRIS
- 2016-05-10 Listed $189,000 MRIS
- 2016-05-10 Delisted — MRIS
- 2016-05-10 Listing Removed — BRIGHT MLS
- 2016-04-21 Listed — MRIS
- 2016-04-21 Listed $189,900 BRIGHT MLS
- 2013-09-25 Sold (Public Records) $125,000 Public Records
- 2013-08-13 Sold (Public Records) $125,000 Public Records
- 2013-08-02 Delisted — MRIS
- 2013-07-31 Sold (MLS) $125,000 BRIGHT MLS
- 2013-07-31 Sold (MLS) $125,000 MRIS
- 2013-02-24 Listing Removed — BRIGHT MLS
- 2013-02-16 Pending — MRIS
- 2013-02-05 Price Changed $124,700 MRIS
- 2012-11-13 Price Changed $140,200 MRIS
- 2012-10-09 Listed $152,000 MRIS
- 2012-10-09 Listed $124,700 BRIGHT MLS
- 2005-10-04 Sold (Public Records) $240,000 Public Records
- 2005-08-19 Sold (MLS) $240,000 MRIS
- 2005-07-17 Delisted — MRIS
- 2005-06-17 Listed $235,000 MRIS
- 1999-09-16 Sold (Public Records) $61,500 Public Records
- 1999-08-30 Sold (MLS) $61,500 MRIS
- 1999-08-11 Delisted — MRIS
- 1999-08-04 Delisted — MRIS
- 1999-08-02 Listed $62,500 MRIS
- 1999-04-29 Listed — MRIS
- 1987-01-29 Sold (Public Records) $52,000 Public Records
Property tax history
+1.1%/yrLatest (2025): $1,168 · +16.8% YoY. Source: county tax records.
Cash-flow waterfall
monthlySold comps — $/sqft
last 12 mo · ≤1 miLoading sold comps…