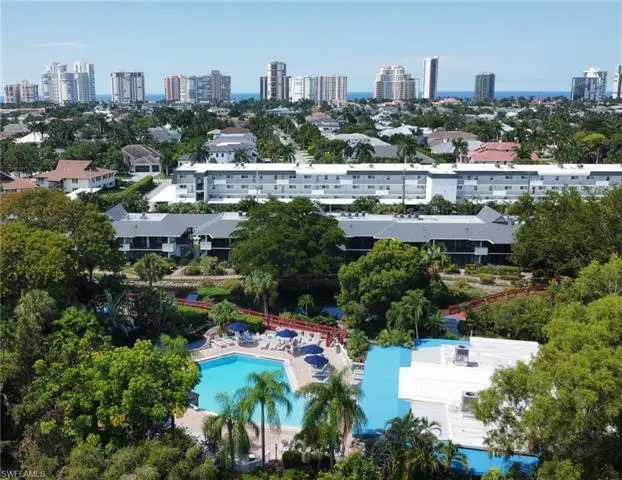
600 Neapolitan Way #226 · Naples, FL
Flood risk 7/10 · Major
- FEMA flood zone
- X (shaded)
- Chance of flooding over 30 yrs
- 0.92%
- Est. flood insurance / yr
- $507 – $1,088
Fire risk 1/10 · Minimal
- Est. fire insurance / yr
- $947 – $1,759
Heat risk 10/10 · Severe
- Hot days now (above 107°F)
- 7 days/yr
- Hot days in 30 yrs
- 29 days/yr
Wind risk 10/10 · Severe
- Chance of severe wind over 30 yrs
- 99.0%
Air-quality risk 2/10 · Minimal
- Unhealthy air days now
- 2 days/yr
- Unhealthy air days in 30 yrs
- 2 days/yr
Risk factors via First Street. Map © Google.
Why this score? — see what drove the B- grade
The composite is a weighted blend of 9 inputs, each scored 0–100. Each bar is that input's sub-score; the figure is the points it added to the 100-point composite (weight × sub-score).
- Cash flow +24.5/30.0
- 1% rule +10.0/10.0
- DSCR +7.9/10.0
- ARV discount +7.5/15.0
- Rent growth +5.0/5.0
- Schools +5.0/10.0
- Livability +4.0/5.0
- Condition / age +2.5/5.0
- Appreciation +0.0/10.0
$335,000
🖨 Deal sheet (PDF) 📄 Offer letter ✓ Due diligence
Listing remarks
Discover a wonderful blend of comfort, style, and opportunity in this condo, attractively priced for today’s market. Located within the highly sought-after Park Shore Resort, this property offers an exceptional chance to own in one of Naples’ most desirable communities, just minutes from the Gulf’s white sand beaches. Inside, you’ll find a welcoming living space with an open layout and peaceful tropical garden views, creating a relaxed coastal atmosphere. The residence is being offered turnkey and is move-in ready, making it a great option for seasonal use, full-time living, or a flexible investment opportunity. Park Shore Resort delivers a true resort-style experien
Key facts
- Bbq grilling areas
- Fitness center
- On-site restaurant
Tags
Property features AI
Other
- Possession: Possession at closing
- Location details: Directions: US 41 to Neapolitan Way to 1st stop sign, left into ParkShore Resort; Sub-condo: PARK SHORE RESORT
- Multi-unit information: 2 units per floor; 157 units in complex; 8 units in building; 1 floor in building
Finance
- HOA & community: Mandatory HOA; Quarterly HOA fee; HOA covers cable, insurance, internet/WiFi, irrigation water, laundry facilities, lawn/land maintenance, legal/accounting, on-site manager, exterior pest control, reserves, and water; On-site management; Community amenities include basketball, BBQ/picnic area, common laundry, community spa/hot tub, exercise room, internet access, pickleball, streetlights, and tennis court; Community type: Condo/Hotel; Total annual recurring HOA fees: $15,392; One-time fees: $150
Exterior
- Parking: See remarks for parking details
- Security: Lobby security
- Utilities: Central water; Central sewer; Cable available; Central electric power
- Home design: Residential condo (Garden apartment); Low-rise building (1-3 stories); Rear exposure facing south; Located in Park Shore / Park Shore Resort
- Construction: Concrete block construction; Stucco exterior; Shingle roof; Built in 1982
- Exterior features: Patio; Automatic sprinkler system; Tennis court
Interior
- Kitchen: Cooktop (electric); Dishwasher; Disposal; Microwave; Range; Refrigerator / Freezer; Refrigerator with icemaker
- Bedrooms: 2 bedrooms
- Flooring: Tile flooring
- Bathrooms: 2 full bathrooms; Master bath with combo tub and shower
- Heating & cooling: Central electric heat; Central electric cooling
- Interior features: Cable prewire; High-speed internet available; Multiple phone lines; Smoke detectors; Walk-in closet; Pantry; Dining area combined with living; Screened lanai/porch; Common elevator; Turnkey furnished
- Laundry & utility: Washer; Dryer; Washer/Dryer hookup; Laundry in residence
Neighborhood map
What this means for you Summary
Snapshot
- This is a 2-bed/2.0-bath condo listed at $335k.
Deal economics
- At list price, monthly cash flow is $621 ($7k/yr) — positive.
- The deal already cash-flows at list — no discount required.
- Meets the 1% rule at list price ($5k rent vs $335k).
- Recommended offer: $325k (3.0% below list) — sets the bar for market timing.
Location & tenants
- Location reads 80/100 on livability (#126 in FL, #1,903 nationally) — a professional / high-income tenant draw. Strengths: crime A+, amenities A+, employment A+; Watch: commute D+, cost of living F.
- Collier (suburban): math 60% / reading 56% proficiency, ranked #16 of 73 in FL (top 22%) — acceptable for families but not a draw, mixed tenant base, ~2y average lease.
- Zoned schools: Sea Gate Elementary School (math 86% / reading 81%, grade A+, #60 of 2,144 statewide, top 3%, 703 students, 26% FRL); Gulfview Middle School (math 78% / reading 68%, grade A, #44 of 571 statewide, top 8%, 582 students, 40% FRL); Naples High School (math 47% / reading 52%, grade D, #179 of 667 statewide, top 29%, 1,719 students, 39% FRL) — zoned schools average 35% FRL vs 55% district-wide (20 pts lower); this property's tenant base skews higher-income than the district average.
- Market conditions: Rents rising fast (+14.6%/yr); 481 active listings in the ZIP; 21 comparable units currently listed for rent nearby; rentals at typical pace (median 25d on market — plan ~3-4 weeks tenant-placement turnaround); high-income renter base; 3,520 units permitted in Collier County in 2024 (959 in 5+ unit buildings).
- At $5,205/mo this rent would consume 53% of the median local household income ($117k/yr) (locally 311% of renters already pay >50% of income on rent) — very limited rent-growth headroom before tenants either downsize or default.
Forward outlook
- Local home prices are declining (-3.0%/yr); year-one equity from $2k of loan paydown is wiped out by about $10k of value loss. Plan a longer hold.
- Collier County population projected at +30% by 2050 — long-run rental-demand tailwind backs the buy-and-hold thesis.
- At projected returns (-3.0% appreciation + 8.0% rent growth), your $94k cash investment doubles in ~8 years — after that, you're playing with house money.
Negotiation context
- It's been on market 49 days — a 3% lower offer ($325k) is reasonable based on typical stale-listing flexibility.
- 3 sale attempts since 11y ago with the ask held roughly flat each time — persistent listings suggest the price (not the market) is what's stuck; bring a comps-based counter.
- Current owner paid $117k; list at $335k implies a 186% gain — meaningful room to come down on a strong offer.
Risks & watch-outs
- Watch-outs: flood insurance adds $66/mo; HOA is 25% of rent.
- Climate carrying-cost: major flood risk; severe wind risk, 99% chance of damaging wind over 30y; extreme-heat days projected 7→29/yr by 2055 (HVAC capex compounding) — expect insurance premiums to compound above CPI over the hold.
Questions for the listing agent
- It's been on market 49 days. Have you received any prior offers? Is the seller open to a 3% concession, seller financing, or rate buy-down credit?
- What's the actual annual flood-insurance premium (NFIP or private), and is the property in a SFHA with mandatory coverage?
- What does the HOA fee cover, when was the last increase, and are there any pending special assessments or reserve-fund shortfalls?
- Any open or pending special assessments — roof, HVAC, plumbing, elevator, façade? What's the per-unit balance and payoff schedule, and is the seller paying it off at close or rolling it to the buyer?
- Is there a deadline driving the sale (1031 exchange, divorce, estate, relocation)? That informs how much negotiation room exists.
- Schools are B-rated — typically a magnet for longer-tenancy family renters. What's the average tenant stay here, and is there a school-zone premium baked into asking?
- What's the average days-on-market for RENTAL listings here right now (not sales)? A rising rental-DOM trend means longer vacancies and softer asking-rent achievability than the comps imply.
- What's the recent tenant-quality profile in this submarket — average credit score on applications, eviction rate, late-payment / NSF rate, and stable-employment percentage? A property-management company in the area should have these aggregated.
- How much new apartment / multifamily construction is in the pipeline within 1–3 miles? Heavy new supply (>2% of stock underway) typically softens rents 12–24 months out; light construction supports rent growth.
Investment metrics
- 1% rule
- 1.55% ✓
- Cap rate
- 8.75%
- Cash-on-cash
- 8.79%
- DSCR
- 1.39
- GRM
- 5.4
CMA / ARV
No comps found within radius.
Projected returns pro-forma
-3.0% appreciation · 8.0% rent growth · sell at horizon
- IRR
- 3.5%
- Equity multiple
- 1.14×
- Total profit
- $13,552
- Equity at exit
- $49,950
- IRR
- 18.6%
- Equity multiple
- 3.04×
- Total profit
- $191,151
- Equity at exit
- $28,965
Cash invested: $93,800 (down + closing). Projections, not guarantees.
Landlord ↔ Tenant lean methodology
- Overall (STATE)
- 87 Strongly Landlord-Friendly
- State Florida
- 87 Strongly Landlord-Friendly · R+3
- County
- — inherits STATE
- City
- — inherits STATE
ZIP-level market 34103
- Rents YoY
- 14.6%
- Active inventory
- 481
- Price-to-rent
- 5.4×
Monthly cashflow live
- Estimated rent
- $5,205 high interval (Pro) →
- Mortgage (P&I)
- −$1,757
- Tax from tax record
- −$245 /mo · $2,945/yr
- Insurance
- −$140
- Flood insurance flood zone
- −$66 /mo · $798/yr
- HOA
- −$1,283
- Vacancy / Maint / Mgmt
- −$1,093
- Net cashflow
- $621
Break-even live
Sensitivity live
| Price | -10% $810 | -5% $715 | +0% $621 | +5% $526 | +10% $431 |
|---|---|---|---|---|---|
| Rent | -10% $209 | -5% $415 | +0% $621 | +5% $826 | +10% $1,032 |
| Rate | -1.0pp $789 | -0.5pp $706 | base $621 | +0.5pp $534 | +1.0pp $446 |
UW: 25.0% down · 7.5% · 30yr · 1.5% tax · 5.0% vac · 8.0% maint · 8.0% mgmt
Financing live
Cash to close
- Down payment
- $83,750
- Closing costs
- $10,050
- Reserves months
- —
- Total cash needed
- —
Loan-product check · same deal, 3 products live
Conventional
25% down · 7.5% · 30yr
- Down + closing
- —
- Monthly P&I
- —
- Monthly cashflow
- —
- DSCR
- —
- Eligible?
- —
Personal DTI + credit; lowest rate.
DSCR
20% down · 8.5% · 30yr
- Down + closing
- —
- Monthly P&I
- —
- Monthly cashflow
- —
- DSCR
- —
- Eligible?
- —
No personal income docs; deal must DSCR.
Hard money
10% down · 12.0% · 12mo
- Down + closing
- —
- Monthly P&I
- —
- Monthly cashflow
- —
- DSCR
- —
- Eligible?
- —
Short-term bridge; refi at stabilization.
Rent comps 21 comps
| Address | Beds | Baths | Sqft | Rent | $/sqft | DOM | Units | Dist |
|---|---|---|---|---|---|---|---|---|
| 600 Neapolitan Way Naples, FL | 1.0–2.0 | 2.0 | 832 | $5,200 | $6.25 | 25d | 2 | 0.14mi |
| 4523 Fluvia Ave Naples, FL | 2.0 | 1.0 | 1050 | $5,500 | $5.24 | 25d | 1 | 0.51mi |
| 4525 Fluvia Ave Naples, FL | 2.0 | 1.0 | 1050 | $5,500 | $5.24 | 25d | 1 | 0.51mi |
| 788 Park Shore Dr Naples, FL | 1.0–2.0 | 1.5–2.0 | 931 | $5,500 | $5.90 | 15d | 3 | 0.71mi |
| 1100 Pine Ridge Rd Naples, FL | 1.0 | 1.0 | 868 | $2,125 | $2.45 | 15d | 3 | 0.75mi |
| 1400 Pompei Ln Naples, FL | 2.0 | 2.0 | 1012 | $1,888 | $1.86 | 25d | 2 | 0.75mi |
| 1400 Pompei Ln Unit O-21 Naples, FL | 2.0 | 2.0 | 1025 | $2,200 | $2.15 | 25d | 1 | 0.76mi |
| 1400 Pompei Ln Unit S-21 Naples, FL | 2.0 | 2.0 | 1025 | $3,000 | $2.93 | 25d | 1 | 0.76mi |
| 5934 Premier Way Naples, FL | 1.0–3.0 | 1.0–3.0 | 1350 | $3,618 | $2.68 | 15d | 29 | 1.18mi |
| 45 High Point Cir S #303 Naples, FL | 2.0 | 2.0 | 1015 | $5,500 | $5.42 | 25d | 1 | 1.20mi |
| 3030 Binnacle Dr #201 Naples, FL | 2.0 | 2.0 | 1092 | $5,000 | $4.58 | 25d | 1 | 1.21mi |
| 820 Ketch Dr #2 Naples, FL | 2.0 | 2.0 | 1100 | $5,700 | $5.18 | 25d | 1 | 1.30mi |
| 820 Ketch Dr #3 Naples, FL | 2.0 | 2.0 | 1100 | $5,500 | $5.00 | 25d | 1 | 1.30mi |
| 3200 Gulf Shore Blvd N #105 Naples, FL | 2.0 | 2.0 | 1116 | $8,500 | $7.62 | 25d | 1 | 1.34mi |
| 1085 Forest Lakes Dr Unit 8305 Naples, FL | 1.0 | 1.0 | 766 | $3,000 | $3.92 | 15d | 1 | 1.36mi |
| 1085 Forest Lakes Dr Unit 8202 Naples, FL | 2.0 | 2.0 | 1086 | $2,800 | $2.58 | 15d | 1 | 1.36mi |
| 1085 Forest Lakes Dr Unit 8106 Naples, FL | 2.0 | 2.0 | 1000 | $1,900 | $1.90 | 15d | 1 | 1.36mi |
| 1086 Forest Lakes Dr Unit 9303 Naples, FL | 2.0 | 2.0 | 1000 | $2,395 | $2.40 | 15d | 1 | 1.39mi |
| 333 Harbour Dr #211 Naples, FL | 2.0 | 2.0 | 975 | $5,500 | $5.64 | 15d | 1 | 1.43mi |
| 287 Quail Forest Blvd #117 Naples, FL | 2.0 | 2.0 | 993 | $1,695 | $1.71 | 15d | 1 | 1.44mi |
| 287 Quail Forest Blvd #117 Naples, FL | 2.0 | 2.0 | 993 | $1,995 | $2.01 | 22d | 1 | 1.44mi |
HOA detail condo
- Monthly dues
- $1,283 · $15,396/yr
- Assessments
- None detected in remarks — confirm with the listing agent.
Listing history 10 events
-
2026-05-22status Pending
-
2026-05-15status Pending With Contingencies
-
2026-03-27$335,000 Active
-
2025-09-15historical
-
2025-03-22$429,000 Active
-
2016-03-02historical
-
2015-09-01$215,000 Active
-
2001-04-09soldstatus $117,000
-
1998-04-09soldstatus $96,500
-
1998-04-09soldstatus $96,500
ⓘ Source: listings_history table (triggers on properties + properties_extension) + one-shot
backfill from property_details.listing_events for pre-trigger history.
Tax reassessment forecast FL · Resets to sale price
- Current annual tax
- $2,945 · $245/mo
- Projected year-2 tax
- $2,945 · $245/mo
- Expected delta
- $0/yr ($0/mo · 0.0%)
ⓘ Screening estimate from a state-policy table — verify with the county assessor before closing.
Climate risk First Street
- Flood 7/10 Severe FEMA zone X (shaded) · 92% chance over 30 yrs
- Wildfire 1/10 Low
- Heat 10/10 Extreme 7 d/yr ≥107°F today · 29 d/yr by 30 yrs out
- Wind 10/10 Extreme 99% chance of damaging wind over 30 yrs
- Air quality 2/10 Low 2 unhealthy d/yr today · 2 by 30 yrs out
Nearby sold comps map
Loading sold comps map…
Walkable amenities ~0.75 mi
Loading nearby amenities…
Taxation est. · year 1
- Rental income
- $62,459
- − Mortgage interest
- −$18,765
- − Property taxes
- −$2,945
- − Insurance
- −$2,472
- − Repairs & maintenance
- −$4,997
- − Management
- −$4,997
- − HOA
- −$15,396
- − Depreciation
- −$9,745
- Taxable income
- $3,141
- Est. tax owed @ 24.0%
- −$754
- After-tax cash flow
- $6,694/yr
For passive investors: Depreciation is non-cash, so a rental often shows a tax loss while cash-flowing — sheltering income. Rental losses are passive: they offset passive income freely, and up to $25,000/yr can offset ordinary (W-2) income if you actively participate and your MAGI is under $100k (phasing out to $0 by $150k); unused losses carry forward. On sale, claimed depreciation is recaptured at up to 25%, and gains may owe capital-gains tax (a 1031 exchange can defer both). Figures are a year-1 estimate at your 24.0% rate — not tax advice; consult a CPA.
Schools (NCES district)
- District
- Collier
- NCES district ID
- 1200330
- Math proficiency
- 60% ▼ -4.00%
- Reading proficiency
- 56% ▼ -2.00%
- Median HH income
- $58,275
- Composite
- 50.23/100
- National rank
- #1892
- State rank
- #16 of 73 in FL
Livability — Naples
- Score
- 80/100
- State rank
- #126
- US rank
- #1903
Category grades
Schools grade is shown separately in the Schools card above.
Census & demographics
- Census place
- Naples, FL
- County
- Collier County · 396,295 people
- City population
- 344,941
- Metro
- Naples-Marco Island, FL
- Population (ZIP)
- 11,299
- Household income
- $116,875
- Rent vs Own
- Severe rent burden
- 311.0
Population outlook (Collier County) Hauer SSP2
- Today (2025)
- 420,858 people
- By 2030
- 450,054 · +6.9%
- By 2040
- 502,232 · +19.3%
- By 2050
- 544,932 · +29.5%
- By 2075
- 627,203 · +49.0%
- By 2100
- 659,015 · +56.6%
Race, ethnicity, and origin ACS 2023
- Neighborhood character
- Predominantly White (87%)
- Race & ethnicity
- White 87% Hispanic / Latino 10% Two or more races 8% Asian 1%
- Hispanic origin (detail)
- Common ancestry
- Romanian 4% Lithuanian 2% Portuguese 2%
- Foreign-born
- 13% · Canada
- Languages at home
- 87% English-only · Spanish 9% Other Indo-European 2% German/W. Germanic 1%
Political lean MEDSL · Collier
- 2024 margin
- Solid R (+33.1) · D 33.1% · R 66.2%
- 2008→2024 swing
- -10.6pp toward R · 2008: -22.5pp · 2024: -33.1pp
- All cycles
- 2024: R+33.1 2020: R+24.7 2016: R+26.0 2012: R+30.1 2008: R+22.5
Not yet ingested
- Civics
- —
Market trends
- HPI YoY
- ▼ -327.53%
- Current HPI
- 315.1396
- Rent YoY
- ▲ 14.55%
- Metro
- Naples-Marco Island, FL
- State GDP YoY
- ▲ 3.28%
- F500 in state
- 36
Industry mix (Fortune 500 HQ in FL)
| Industry | F500 HQs | Revenue |
|---|---|---|
| Industrial Technology | 2 | $29B |
|
||
| Insurance | 2 | $17B |
|
||
| Retail | 1 | $60B |
|
||
| Technology Distribution | 1 | $58B |
|
||
| Homebuilding | 1 | $35B |
|
||
| Technology Manufacturing | 1 | $35B |
|
||
Price history
+247.2% since first listed10 events — show timeline
- 2026-05-22 Pending — NAPLESMLS
- 2026-05-15 Pending — NAPLESMLS
- 2026-03-27 Listed $335,000 NAPLESMLS
- 2025-09-15 Listing Removed — FORTMLS
- 2025-03-22 Listed $429,000 FORTMLS
- 2016-03-02 Listing Removed — NAPLESMLS
- 2015-09-01 Listed $215,000 NAPLESMLS
- 2001-04-09 Sold (Public Records) $117,000 Public Records
- 1998-04-09 Sold (Public Records) $96,500 Public Records
- 1998-04-09 Sold (Public Records) $96,500 Public Records
Property tax history
+7.7%/yrLatest (2025): $2,945 · +1.2% YoY. Source: county tax records.
Cash-flow waterfall
monthlySold comps — $/sqft
last 12 mo · ≤1 miLoading sold comps…