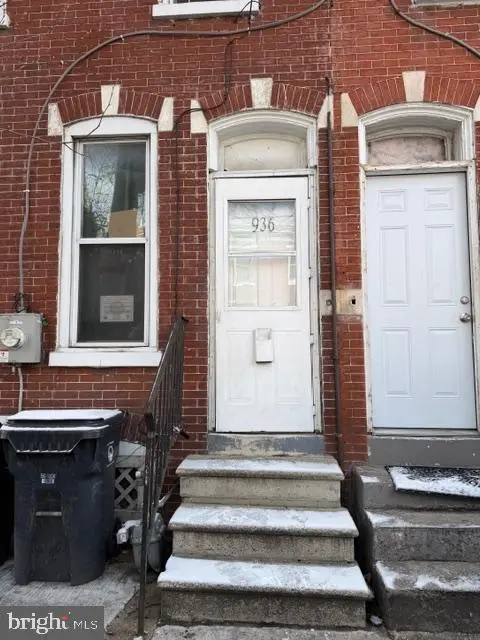
936 N Spruce St · Wilmington, DE
Flood risk 4/10 · Minor
- FEMA flood zone
- X (unshaded)
- Chance of flooding over 30 yrs
- 0.22%
- Est. flood insurance / yr
- $473 – $860
Fire risk 1/10 · Minimal
- Est. fire insurance / yr
- $476 – $884
Heat risk 8/10 · Major
- Hot days now (above 103°F)
- 7 days/yr
- Hot days in 30 yrs
- 16 days/yr
Wind risk 6/10 · Moderate
- Chance of severe wind over 30 yrs
- 27.0%
Air-quality risk 3/10 · Minor
- Unhealthy air days now
- 3 days/yr
- Unhealthy air days in 30 yrs
- 5 days/yr
Risk factors via First Street. Map © Google.
Why this score? — see what drove the C+ grade
The composite is a weighted blend of 9 inputs, each scored 0–100. Each bar is that input's sub-score; the figure is the points it added to the 100-point composite (weight × sub-score).
- Cash flow +30.0/30.0
- DSCR +10.0/10.0
- 1% rule +9.4/10.0
- Livability +3.2/5.0
- Rent growth +2.9/5.0
- Schools +2.5/10.0
- Condition / age +2.5/5.0
- ARV discount +0.0/15.0
- Appreciation +0.0/10.0
$130,000
🖨 Deal sheet (PDF) 📄 Offer letter ✓ Due diligence
Listing remarks MLS
RECENT UPDATES TO PROPERTY!! Check out bathroom and kitchen! Solid opportunity for those seeking a value-add property in the City of Wilmington. This home features 3 bedrooms plus a bonus room, ideal for a 4th bedroom, home office, or flex space. The property has good bones, making it a great candidate for any type of buyer - investor or homeowner. Layout allows for efficient improvements with the potential to increase rental income and overall value. Located in a convenient Wilmington neighborhood with easy access to public transportation, shops, and local amenities - a very attractive feature. With strong rental demand in the area, this property presents an excellent opportunity to add to your portfolio. Perfect for new homeowners, investors, landlords, or rehabbers looking for a solid property with upside. SOLD AS-IS.
Key facts
- Strong rental demand
- Bonus room
- Local amenities
Tags
Neighborhood map
What this means for you Summary
Snapshot
- This is a 3-bed/1.0-bath townhouse listed at $130k.
Deal economics
- At list price, monthly cash flow is $687 ($8k/yr) — positive.
- The deal already cash-flows at list — no discount required.
- Meets the 1% rule at list price ($2k rent vs $130k).
- Recommended offer: $114k (12.0% below list) — sets the bar for market timing.
- Cap rate 12.6% vs local median 5.7% in Wilmington — top-decile yield for the area; either an underpriced asset or a hidden risk that comps aren't pricing in. Stress-test before assuming the spread holds.
Location & tenants
- Location reads 64/100 on livability (#52 in DE) — a middle-class / working-renter tenant base. Strengths: cost of living A+, housing A; Watch: employment D+, commute D, crime F.
- Christina School District (suburban): math 22% / reading 33% proficiency, ranked #18 of 26 in DE (top 69%) — low school quality limits family demand, transient renter base, plan for 1-2y turnover.
- Zoned schools: Stubbs Early Education Center (190 students, 0% FRL); The Bayard School (math 3% / reading 10%, grade F, #102 of 105 statewide, top 97%, 508 students, 0% FRL); Christiana High School (math 49% / reading 66%, grade C, #3 of 40 statewide, top 5%, 1,256 students, 0% FRL) — zoned schools average 0% FRL vs 50% district-wide (50 pts lower); this property's tenant base skews higher-income than the district average.
- Market conditions: Rents rising (+1.6%/yr); 75 active listings in the ZIP; 40 comparable units currently listed for rent nearby; rentals at typical pace (median 19d on market — plan ~3-4 weeks tenant-placement turnaround); 1,367 units permitted in New Castle County in 2024 (201 in 5+ unit buildings).
Forward outlook
- Local home prices are declining (-3.0%/yr); year-one equity from $899 of loan paydown is wiped out by about $4k of value loss. Plan a longer hold.
- New Castle County population projected at +9% by 2050 — modest demand growth; plan on rents tracking national, not racing it.
- At projected returns (-3.0% appreciation + 1.6% rent growth), your $36k cash investment doubles in ~6 years — after that, you're playing with house money.
Negotiation context
- It's been on market 151 days — a 12% lower offer ($114k) is reasonable based on typical stale-listing flexibility.
- 7 sale attempts since 22y ago with the ask held roughly flat each time — persistent listings suggest the price (not the market) is what's stuck; bring a comps-based counter.
- Current owner paid $48k; list at $130k implies a 174% gain — meaningful room to come down on a strong offer.
Risks & watch-outs
- Watch-outs: built in 1900 — expect roof / HVAC / electrical / plumbing capex.
- Climate carrying-cost: major wind risk, 27% chance of damaging wind over 30y; extreme-heat days projected 7→16/yr by 2055 (HVAC capex compounding) — expect insurance premiums to compound above CPI over the hold.
Questions for the listing agent
- It's been on market 151 days. Have you received any prior offers? Is the seller open to a 12% concession, seller financing, or rate buy-down credit?
- Built in 1900 — when were the roof, HVAC, electrical panel, plumbing, and water heater last replaced?
- Why hasn't it sold? Are there any deal-killer items the seller is aware of (foundation, flood, title, zoning, code violations)?
- Is there a deadline driving the sale (1031 exchange, divorce, estate, relocation)? That informs how much negotiation room exists.
- Schools are D-rated, which usually means shorter tenancies and higher turnover. Who's the typical renter profile here, and what's been the actual vacancy rate?
- Crime grade is F in this area — have there been break-ins, vandalism, or insurance claims at this property in the last 3 years? What carrier currently insures it and at what premium?
- What's the average days-on-market for RENTAL listings here right now (not sales)? A rising rental-DOM trend means longer vacancies and softer asking-rent achievability than the comps imply.
- What's the recent tenant-quality profile in this submarket — average credit score on applications, eviction rate, late-payment / NSF rate, and stable-employment percentage? A property-management company in the area should have these aggregated.
- How much new for-sale + rental construction is in the pipeline within 1–3 miles? Heavy new supply typically softens prices + rents 12–24 months out; constrained supply supports both.
Investment metrics
- 1% rule
- 1.44% ✓
- Cap rate
- 12.63%
- Cash-on-cash
- 22.63%
- DSCR
- 2.01
- GRM
- 5.8
CMA / ARV
- ARV (median comp)
- $103,290
- List price
- $130,000
- Delta
- 25.86%
- Verdict
- OVERPRICED
- Comps
- 20 within 1.0 mi
Show comp detail 12 sales within ~0.75 mi
| Address | Dist | Beds/Ba | Sqft | Sold | Price | $/sf | Match |
|---|---|---|---|---|---|---|---|
| 735 E 10th St | 0.05mi | 3/1.0 | 950 (-3%) | 5mo | $101,000 | $106 | 89 |
| 1001 N Church St | 0.06mi | 2/1.0 (-1) | 894 (-8%) | 1mo | $148,000 | $166 | 78 |
| 1007 N Spruce St | 0.05mi | 3/1.5 | 1,075 (+10%) | 3mo | $145,000 | $135 | 76 |
| 806 E Eighth St | 0.19mi | 2/1.0 (-1) | 1,000 (+3%) | 8mo | $128,000 | $128 | 76 |
| 1004 N Pine | 0.08mi | 3/1.5 | 1,100 (+13%) | 4mo | $170,000 | $155 | 69 |
| 910 N Spruce St | 0.03mi | 2/1.0 (-1) | 850 (-13%) | 4mo | $107,500 | $126 | 69 |
| 827 E 17th St | 0.46mi | 2/1.0 (-1) | 925 (-5%) | 1mo | $75,000 | $81 | 64 |
| 1230 Forrest St | 0.37mi | 3/1.0 | 1,075 (+10%) | 5mo | $185,000 | $172 | 62 |
| 321 E 9th St | 0.25mi | 2/1.0 (-1) | 850 (-13%) | 4mo | $58,000 | $68 | 59 |
| 610 E 22nd St | 0.57mi | 2/1.0 (-1) | 1,025 (+5%) | 4mo | $71,000 | $69 | 56 |
| 2111 N Locust St | 0.54mi | 3/1.5 | 1,075 (+10%) | 3mo | $175,600 | $163 | 54 |
| 329 E 13th | 0.32mi | 2/1.5 (-1) | 1,080 (+11%) | 8mo | $176,000 | $163 | 53 |
Match score weights: distance 35% · size 25% · config 20% · recency 20%. Top-matched comps best support the ARV.
Projected returns pro-forma
-3.0% appreciation · 1.59% rent growth · sell at horizon
- IRR
- 14.0%
- Equity multiple
- 1.55×
- Total profit
- $20,009
- Equity at exit
- $19,383
- IRR
- 21.7%
- Equity multiple
- 2.73×
- Total profit
- $63,147
- Equity at exit
- $11,240
Cash invested: $36,400 (down + closing). Projections, not guarantees.
Landlord ↔ Tenant lean methodology
- Overall (STATE)
- 70 Landlord-Friendly
- State Delaware
- 70 Landlord-Friendly · D+7
- County
- — inherits STATE
- City
- — inherits STATE
ZIP-level market 19801
- Rents YoY
- 1.6%
- Active inventory
- 75
- Price-to-rent
- 5.8×
Monthly cashflow live
- Estimated rent
- $1,868 high interval (Pro) →
- Mortgage (P&I)
- −$682
- Tax from tax record
- −$53 /mo · $641/yr
- Insurance
- −$54
- HOA
- −$0
- Vacancy / Maint / Mgmt
- −$392
- Net cashflow
- $687
Break-even live
Sensitivity live
| Price | -10% $760 | -5% $723 | +0% $687 | +5% $650 | +10% $613 |
|---|---|---|---|---|---|
| Rent | -10% $539 | -5% $613 | +0% $687 | +5% $760 | +10% $834 |
| Rate | -1.0pp $752 | -0.5pp $720 | base $687 | +0.5pp $653 | +1.0pp $619 |
UW: 25.0% down · 7.5% · 30yr · 1.5% tax · 5.0% vac · 8.0% maint · 8.0% mgmt
Financing live
Cash to close
- Down payment
- $32,500
- Closing costs
- $3,900
- Reserves months
- —
- Total cash needed
- —
Loan-product check · same deal, 3 products live
Conventional
25% down · 7.5% · 30yr
- Down + closing
- —
- Monthly P&I
- —
- Monthly cashflow
- —
- DSCR
- —
- Eligible?
- —
Personal DTI + credit; lowest rate.
DSCR
20% down · 8.5% · 30yr
- Down + closing
- —
- Monthly P&I
- —
- Monthly cashflow
- —
- DSCR
- —
- Eligible?
- —
No personal income docs; deal must DSCR.
Hard money
10% down · 12.0% · 12mo
- Down + closing
- —
- Monthly P&I
- —
- Monthly cashflow
- —
- DSCR
- —
- Eligible?
- —
Short-term bridge; refi at stabilization.
Rent comps 40 comps
| Address | Beds | Baths | Sqft | Rent | $/sqft | DOM | Units | Dist |
|---|---|---|---|---|---|---|---|---|
| 1004 N Spruce St Wilmington, DE | 3.0 | 1.5 | 1075 | $1,800 | $1.67 | 20d | 1 | 0.05mi |
| 1026 Bennett St Wilmington, DE | 3.0 | 1.0 | 1125 | $1,685 | $1.50 | 0d | 1 | 0.07mi |
| 835 N Spruce St Wilmington, DE | 3.0 | 1.0 | 775 | $1,700 | $2.19 | 0d | 1 | 0.10mi |
| 518 E 12th St Wilmington, DE | 2.0 | 1.0 | 875 | $1,425 | $1.63 | 22d | 1 | 0.21mi |
| 918 E 17th St Unit 1 Wilmington, DE | 3.0 | 1.0 | 1100 | $1,795 | $1.63 | 0d | 1 | 0.44mi |
| 913 N Market St Wilmington, DE | 1.0–2.0 | 1.0–2.0 | 974 | $1,985 | $2.04 | 46d | 5 | 0.50mi |
| 116 W 9th St Wilmington, DE | 1.0–2.0 | 1.0–2.0 | 813 | $2,270 | $2.79 | 1d | 17 | 0.55mi |
| 1001 N Orange St Wilmington, DE | 1.0–2.0 | 1.0–2.0 | 833 | $2,135 | $2.56 | 0d | 61 | 0.57mi |
| 801 N Orange St Wilmington, DE | 3.0 | 1.0–3.0 | 1118 | $3,991 | $3.57 | 1d | 115 | 0.59mi |
| 703 Orange St Wilmington, DE | 1.0–2.0 | 1.0 | 800 | $1,475 | $1.84 | 46d | 1 | 0.60mi |
| 228 W 9th St Unit 201 Wilmington, DE | 2.0 | 2.0 | 1031 | $1,695 | $1.64 | 46d | 1 | 0.61mi |
| 15 W Girard St Unit 105 Wilmington, DE | 2.0 | 1.0 | 740 | $1,645 | $2.22 | 7d | 1 | 0.61mi |
| 517 N Shipley St Wilmington, DE | 2.0 | 1.0–2.0 | 822 | $2,670 | $3.25 | 1d | 15 | 0.61mi |
| 225 W 4th St Unit 2 Wilmington, DE | 2.0 | 1.0 | 1000 | $1,599 | $1.60 | 46d | 1 | 0.70mi |
| 6 W 20th St Wilmington, DE | 2.0 | 1.0 | 650 | $1,395 | $2.15 | 46d | 1 | 0.71mi |
| 103 E 24th St Unit 1 Wilmington, DE | 3.0 | 1.0 | 1025 | $1,795 | $1.75 | 46d | 1 | 0.77mi |
| 401 A St Wilmington, DE | 2.0 | 1.0–2.0 | 716 | $2,605 | $3.64 | 0d | 12 | 0.79mi |
| 2601 N Heald St Wilmington, DE | 3.0 | 1.0 | 1025 | $1,795 | $1.75 | 0d | 1 | 0.82mi |
| 711 Windsor St Wilmington, DE | 2.0 | 1.0 | 980 | $1,460 | $1.49 | 46d | 1 | 0.84mi |
| 709 Windsor St Unit 3 Wilmington, DE | 2.0 | 1.0 | 980 | $1,500 | $1.53 | 46d | 1 | 0.84mi |
| 507 W 4th St Wilmington, DE | 3.0 | 1.5 | 1075 | $1,800 | $1.67 | 15d | 1 | 0.84mi |
| 613 W 10th St Wilmington, DE | 2.0 | 1.0 | 1100 | $1,745 | $1.59 | 46d | 1 | 0.85mi |
| 115 Christina Landing Dr Wilmington, DE | 1.0–2.0 | 1.0–2.0 | 1195 | $2,796 | $2.34 | 1d | 11 | 0.85mi |
| 617 W 6th St Unit 617 B Wilmington, DE | 3.0 | 1.0 | 1000 | $1,600 | $1.60 | 7d | 1 | 0.86mi |
| 2705 Speakman Pl Wilmington, DE | 3.0 | 1.5 | 1100 | $1,975 | $1.80 | 15d | 1 | 0.89mi |
| 105 Christina Landing Dr #1503 Wilmington, DE | 2.0 | 2.0 | 1025 | $2,500 | $2.44 | 19d | 1 | 0.90mi |
| 105 Christina Landing Dr Wilmington, DE | 2.0 | 2.0 | 1025 | $2,400 | $2.34 | 12d | 1 | 0.90mi |
| 820 W 7th St Wilmington, DE | 3.0 | 1.0 | 1000 | $1,650 | $1.65 | 46d | 1 | 0.98mi |
| 306 Concord Ave Unit 2 Wilmington, DE | 3.0 | 1.0 | 1100 | $1,350 | $1.23 | 46d | 1 | 0.99mi |
| 312 Concord Ave Unit 2 Wilmington, DE | 2.0 | 1.0 | 700 | $1,295 | $1.85 | 26d | 1 | 1.00mi |
| 409 W 20th St Unit 2 Wilmington, DE | 2.0 | 1.0 | 1100 | $1,500 | $1.36 | 15d | 1 | 1.01mi |
| 409 W 20th St Unit 2 Wilmington, DE | 2.0 | 1.0 | 1100 | $1,700 | $1.55 | 12d | 1 | 1.01mi |
| 606 S Claymont St Wilmington, DE | 2.0 | 1.0 | 1000 | $1,399 | $1.40 | 20d | 1 | 1.04mi |
| 606 S Claymont St Wilmington, DE | 2.0 | 1.0 | 1000 | $1,399 | $1.40 | 19d | 1 | 1.04mi |
| 1000 W 8th St Unit 3 Wilmington, DE | 2.0 | 1.0 | 1050 | $1,695 | $1.61 | 26d | 1 | 1.07mi |
| 604 W 20th St Unit 2 Wilmington, DE | 2.0 | 1.0 | 900 | $1,195 | $1.33 | 26d | 1 | 1.10mi |
| 608 W 20th St Wilmington, DE | 2.0 | 1.0 | 800 | $1,400 | $1.75 | 46d | 1 | 1.12mi |
| 331 Justison St Wilmington, DE | 1.0–2.0 | 1.0–2.0 | 859 | $2,205 | $2.57 | 0d | 9 | 1.16mi |
| 400 W 29th St Wilmington, DE | 3.0 | 1.5 | 1125 | $1,950 | $1.73 | 46d | 1 | 1.22mi |
| 1301 N Harrison St Wilmington, DE | 1.0–2.0 | 1.0 | 1050 | $1,850 | $1.76 | 7d | 1 | 1.22mi |
Listing history 39 events
-
2026-06-21days on market $130,000 Active 151 DOM
-
2026-06-18days on market $130,000 Active 148 DOM
-
2026-06-17days on market $130,000 Active 147 DOM
-
2026-06-16days on market $130,000 Active 146 DOM
-
2026-06-15days on market $130,000 Active 145 DOM
-
2026-06-13days on market $130,000 Active 143 DOM
-
2026-06-13days on market $130,000 Active 142 DOM
-
2026-06-09days on market $130,000 Active 139 DOM
-
2026-06-08days on market $130,000 Active 138 DOM
-
2026-06-07days on market $130,000 Active 137 DOM
-
2026-06-04days on market $130,000 Active 134 DOM
-
2026-06-03days on market $130,000 Active 133 DOM
-
2026-06-02days on market $130,000 Active 132 DOM
-
2026-06-01days on market $130,000 Active 131 DOM
-
2026-05-31days on market $130,000 Active 130 DOM
-
2026-02-05status Active 832-char remark
Show marketing remark (832 chars)
RECENT UPDATES TO PROPERTY!! Check out bathroom and kitchen! Solid opportunity for those seeking a value-add property in the City of Wilmington. This home features 3 bedrooms plus a bonus room, ideal for a 4th bedroom, home office, or flex space. The property has good bones, making it a great candidate for any type of buyer - investor or homeowner. Layout allows for efficient improvements with the potential to increase rental income and overall value. Located in a convenient Wilmington neighborhood with easy access to public transportation, shops, and local amenities - a very attractive feature. With strong rental demand in the area, this property presents an excellent opportunity to add to your portfolio. Perfect for new homeowners, investors, landlords, or rehabbers looking for a solid property with upside. SOLD AS-IS.
-
2026-02-03historical Active Under Contract 832-char remark
Show marketing remark (832 chars)
RECENT UPDATES TO PROPERTY!! Check out bathroom and kitchen! Solid opportunity for those seeking a value-add property in the City of Wilmington. This home features 3 bedrooms plus a bonus room, ideal for a 4th bedroom, home office, or flex space. The property has good bones, making it a great candidate for any type of buyer - investor or homeowner. Layout allows for efficient improvements with the potential to increase rental income and overall value. Located in a convenient Wilmington neighborhood with easy access to public transportation, shops, and local amenities - a very attractive feature. With strong rental demand in the area, this property presents an excellent opportunity to add to your portfolio. Perfect for new homeowners, investors, landlords, or rehabbers looking for a solid property with upside. SOLD AS-IS.
-
2026-01-19$130,000 Active 832-char remark
Show marketing remark (832 chars)
RECENT UPDATES TO PROPERTY!! Check out bathroom and kitchen! Solid opportunity for those seeking a value-add property in the City of Wilmington. This home features 3 bedrooms plus a bonus room, ideal for a 4th bedroom, home office, or flex space. The property has good bones, making it a great candidate for any type of buyer - investor or homeowner. Layout allows for efficient improvements with the potential to increase rental income and overall value. Located in a convenient Wilmington neighborhood with easy access to public transportation, shops, and local amenities - a very attractive feature. With strong rental demand in the area, this property presents an excellent opportunity to add to your portfolio. Perfect for new homeowners, investors, landlords, or rehabbers looking for a solid property with upside. SOLD AS-IS.
-
2021-05-10soldstatus $47,500
-
2021-05-04soldstatus $47,500 Closed 352-char remark
Show marketing remark (352 chars)
Investor Alert! 3 bedroom1 full bath investment property! Add this property to your portfolio today! Instant Cash Flow! Tenant Occupied and very difficult to show. Property being Sold in "As Is Condition" Renovation loan, Hard Money or Cash Offers. Pictures were taken prior to tenant moving in the property. Tenant on Month to Month Lease
-
2021-04-19status Pending 352-char remark
Show marketing remark (352 chars)
Investor Alert! 3 bedroom1 full bath investment property! Add this property to your portfolio today! Instant Cash Flow! Tenant Occupied and very difficult to show. Property being Sold in "As Is Condition" Renovation loan, Hard Money or Cash Offers. Pictures were taken prior to tenant moving in the property. Tenant on Month to Month Lease
-
2021-04-19price $47,500 352-char remark
Show marketing remark (352 chars)
Investor Alert! 3 bedroom1 full bath investment property! Add this property to your portfolio today! Instant Cash Flow! Tenant Occupied and very difficult to show. Property being Sold in "As Is Condition" Renovation loan, Hard Money or Cash Offers. Pictures were taken prior to tenant moving in the property. Tenant on Month to Month Lease
-
2021-04-16$37,500 Active 352-char remark
Show marketing remark (352 chars)
Investor Alert! 3 bedroom1 full bath investment property! Add this property to your portfolio today! Instant Cash Flow! Tenant Occupied and very difficult to show. Property being Sold in "As Is Condition" Renovation loan, Hard Money or Cash Offers. Pictures were taken prior to tenant moving in the property. Tenant on Month to Month Lease
-
2018-07-13price $27,500
-
2018-01-22soldstatus $23,500 Closed
-
2018-01-22soldstatus $23,500 Sold
-
2017-12-20status Under Contract
-
2017-11-13price $27,500
-
2017-09-29$30,000 Active
-
2017-09-29$30,000 Active
-
2017-07-24$33,000 Active
-
2005-03-22soldstatus $58,000
-
2005-03-21soldstatus $58,000
-
2005-01-31historical
-
2004-10-27$58,000
-
2002-02-08soldstatus $26,000
-
1992-08-04soldstatus $21,000
-
1989-03-01soldstatus $265,000
-
1985-10-01soldstatus $30,000
ⓘ Source: listings_history table (triggers on properties + properties_extension) + one-shot
backfill from property_details.listing_events for pre-trigger history.
Tax reassessment forecast DE · Partial reset (capped growth)
- Current annual tax
- $641 · $53/mo
- Projected year-2 tax
- $698 · $58/mo
- Expected delta
- +$56/yr (+$5/mo · 8.8%)
ⓘ Screening estimate from a state-policy table — verify with the county assessor before closing.
Climate risk First Street
- Flood 4/10 Moderate FEMA zone X (unshaded) · 22% chance over 30 yrs
- Wildfire 1/10 Low
- Heat 8/10 Severe 7 d/yr ≥103°F today · 16 d/yr by 30 yrs out
- Wind 6/10 Major 27% chance of damaging wind over 30 yrs
- Air quality 3/10 Moderate 3 unhealthy d/yr today · 5 by 30 yrs out
Nearby sold comps map
Loading sold comps map…
Walkable amenities ~0.75 mi
Loading nearby amenities…
Taxation est. · year 1
- Rental income
- $22,419
- − Mortgage interest
- −$7,282
- − Property taxes
- −$641
- − Insurance
- −$650
- − Repairs & maintenance
- −$1,794
- − Management
- −$1,794
- − Depreciation
- −$3,782
- Taxable income
- $6,477
- Est. tax owed @ 24.0%
- −$1,554
- After-tax cash flow
- $6,684/yr
For passive investors: Depreciation is non-cash, so a rental often shows a tax loss while cash-flowing — sheltering income. Rental losses are passive: they offset passive income freely, and up to $25,000/yr can offset ordinary (W-2) income if you actively participate and your MAGI is under $100k (phasing out to $0 by $150k); unused losses carry forward. On sale, claimed depreciation is recaptured at up to 25%, and gains may owe capital-gains tax (a 1031 exchange can defer both). Figures are a year-1 estimate at your 24.0% rate — not tax advice; consult a CPA.
Schools (NCES district)
- District
- Christina School District
- NCES district ID
- 1000200
- Math proficiency
- 22% ▼ -12.00%
- Reading proficiency
- 33% ▼ -5.00%
- Median HH income
- $58,838
- Composite
- 24.93/100
- National rank
- #7567
- State rank
- #18 of 26 in DE
Livability — Wilmington
- Score
- 64/100
- State rank
- #52
- US rank
- #14251
Category grades
Schools grade is shown separately in the Schools card above.
Census & demographics
- Census place
- Wilmington, DE
- County
- New Castle County · 483,412 people
- City population
- 173,480
- Metro
- Philadelphia-Camden-Wilmington, PA-NJ-DE-MD
- Population (ZIP)
- 16,327
- Household income
- $52,810
- Rent vs Own
- Severe rent burden
- 919.0
Population outlook (New Castle County) Hauer SSP2
- Today (2025)
- 594,686 people
- By 2030
- 609,164 · +2.4%
- By 2040
- 632,154 · +6.3%
- By 2050
- 649,068 · +9.1%
- By 2075
- 687,771 · +15.7%
- By 2100
- 694,961 · +16.9%
Race, ethnicity, and origin ACS 2023
- Neighborhood character
- Predominantly Black (67%)
- Race & ethnicity
- Black 67% White 15% Hispanic / Latino 9% Two or more races 7% Asian 4%
- Hispanic origin (detail)
- Mexican 3% Puerto Rican 4%
- Common ancestry
- Romanian 1% Slovak 1% Italian 1%
- Foreign-born
- 9% · Canada, China, Vietnam
- Languages at home
- 87% English-only · Spanish 7% Other Indo-European 2% Chinese 1%
Political lean MEDSL · New Castle
- 2024 margin
- Solid D (+32.6) · D 65.5% · R 32.9% · Other 1.6%
- 2008→2024 swing
- -8.1pp toward R · 2008: 40.6pp · 2024: 32.6pp
- All cycles
- 2024: D+32.6 2020: D+37.1 2016: D+29.6 2012: D+34.1 2008: D+40.6
Not yet ingested
- Civics
- —
Market trends
- HPI YoY
- ▼ -112.65%
- Current HPI
- 151.1288
- Rent YoY
- ▲ 1.59%
- Metro
- Philadelphia-Camden-Wilmington, PA-NJ-DE-MD
- State GDP YoY
- —
- F500 in state
- 0
Price history
+333.3% since first listed24 events — show timeline
- 2026-02-05 Relisted — BRIGHT MLS
- 2026-02-03 Contingent — BRIGHT MLS
- 2026-01-19 Listed $130,000 BRIGHT MLS
- 2021-05-10 Sold (Public Records) $47,500 Public Records
- 2021-05-04 Sold (MLS) $47,500 BRIGHT MLS
- 2021-04-19 Pending — BRIGHT MLS
- 2021-04-19 Price Changed $47,500 BRIGHT MLS
- 2021-04-16 Listed $37,500 BRIGHT MLS
- 2018-07-13 Price Changed $27,500 BRIGHT MLS
- 2018-01-22 Sold (MLS) $23,500 TREND
- 2018-01-22 Sold (MLS) $23,500 BRIGHT MLS
- 2017-12-20 Pending — TREND
- 2017-11-13 Price Changed $27,500 TREND
- 2017-09-29 Listed $30,000 TREND
- 2017-09-29 Listed $30,000 BRIGHT MLS
- 2017-07-24 Listed $33,000 BRIGHT MLS
- 2005-03-22 Sold (Public Records) $58,000 Public Records
- 2005-03-21 Sold (MLS) $58,000 BRIGHT MLS
- 2005-01-31 Listing Removed — BRIGHT MLS
- 2004-10-27 Listed $58,000 BRIGHT MLS
- 2002-02-08 Sold (Public Records) $26,000 Public Records
- 1992-08-04 Sold (Public Records) $21,000 Public Records
- 1989-03-01 Sold (Public Records) $265,000 Public Records
- 1985-10-01 Sold (Public Records) $30,000 Public Records
Property tax history
+3.9%/yrLatest (2024): $641 · +2.6% YoY. Source: county tax records.
Cash-flow waterfall
monthlySold comps — $/sqft
last 12 mo · ≤1 miLoading sold comps…